HDFC BANK Levels // 2 HoursHello Everyone 👋
Overview:
HDFC Bank is one of India’s leading private sector banks.
It provides a wide range of banking and financial services, including retail banking, corporate banking, and treasury operations.
The bank was founded in 1994 and is headquartered in Mumbai, India.
Branches and ATMs:
You can find HDFC Bank branches and ATMs across India. Here are a few locations in New Delhi:
Connaught Place: 2nd Floor, 44 Regal Building, Connaught Place, New Delhi - 110001.
Barakhamba Road: Ground Floor, DCM Building, IOH Block, Barakhamba Road, New Delhi - 110001.
Gole Market: No. 6, No. 104 Baird Road, Block 90, Gole Market, New Delhi - 110001.
Connaught Circus: H-69, Outer Circle, Connaught Circus, New Delhi - 110001.
Kasturba Gandhi Marg: 209 to 214 & 26, Kailash Building, Kasturba Gandhi Marg, New Delhi - 110001.
Janpath: 72, Ved Mansion, Janpath, New Delhi - 110001.
Bengali Market: Shop No. 43 to 46, Plot No. 1, Ground Floor, Block No. 205/C, Bengali Market, New Delhi - 110001.
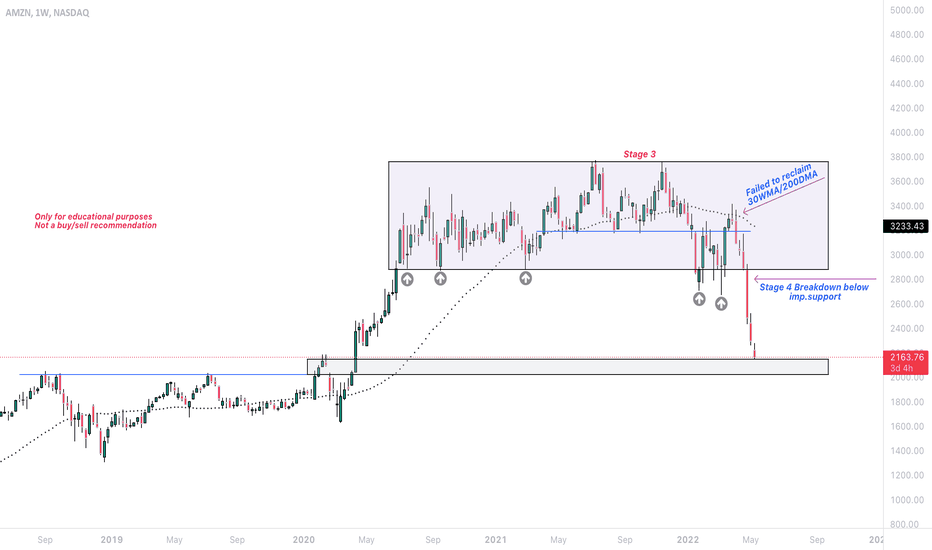
Amazon
Investment_ AmazonNamaste!
Amazon has corrected enough to look attractive to value investors. VI basically mean they will look for:
1. Low P/E ratio,
2. An long term up-trending stock (Amazon is that),
3. Fear in the markets, Etc.
Investors like Warren Buffet doesn't buy when the market is at all time high and people think it will keep going up in a straight line.
He and other value investors wait for an opportunity, when there is fear and it results in considerable fall in the stock prices. It's when they come in.
For Amazon, I can say with 100% confidence, value investors must be jumping in. This opportunity (because of correction) is rare and happens in 4-5 years approx. They are smart people and following them is a smarter decision. Amazon is definitely a buy, at current prices or at break of 118.
The most important rule in Investing is, never ever sell at a loss. There are only two possibilities in my opinion, either the company goes bankrupt, or you make money.
Disclaimer: Investment carries an element of financial risk. Investment does not guarantee a fixed return due to volatile nature of markets. Please do your due-diligence before investing. You are solely responsible for your decisions.
Bank Nifty Friday Analysis!~Buyers are still holding Bank nifty but facing big resistance between 44400 to 44500. Buyers can get active if hold above 44500 to 44600 and then breakout will go till 44900.
~Trap Area's 44400 to 44500
~Range at 44170 & 44250 will work as support & Resistance
~Downside if breaks previous day low then support at 43800
~Might be a gap down opening for tomorrow
Note : Do your own analysis before taking any trade or investment..
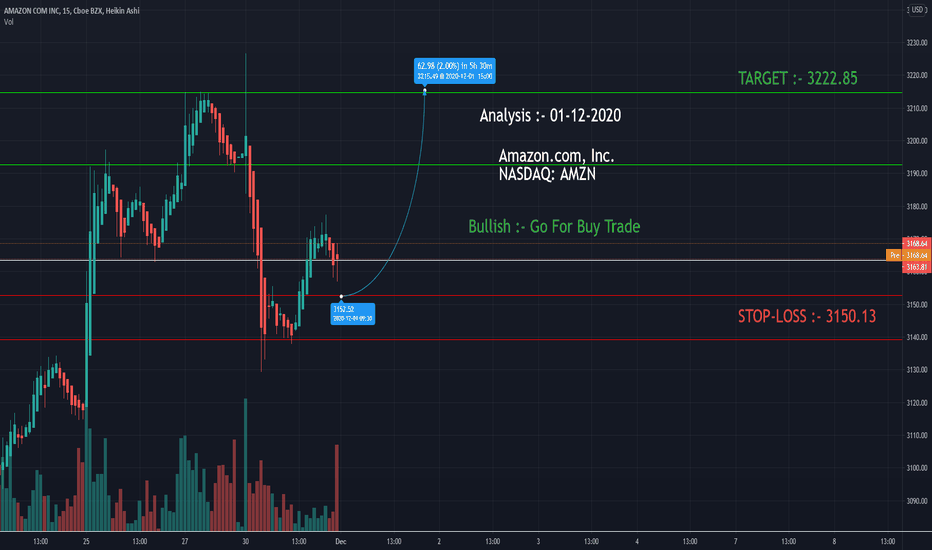
Amazon.com (AMZN) technical analysisHello, This is my first ever published Technical Analysis.
According to my analysis the price will go up.
We should take entry at 3262
The target should be at 3340
Stop Loss at 3234.
Note: This is just a Technical Analysis if by any chance my target doesn't become reality and you lose money then I will not be the liable person for your investment on any particular asset that you have made, only you will be the responsible for your trade/investment.
How to ride on a swing trade ??? Ex :AMZNHow to ride on a swing trade?
One good strategy in price action is to use 21 EMA and ride on swing trades for short or long terms. 21-day EMA can be called as the Goldilocks of all moving averages. 5,8,13 can be too tight and 50,100,200 are too loose for looking at moving averages, hence 21 EMA can be considered as a powerful average.
In this strategy 21 EMA LOW and 21 EMA HIGH are plotted on the graph forming a channel. Any channel breakout up or down triggers a buy or sell respectively. The bar which detaches with the bar which pierced out of channel can be used as a buy or sell. Please remember this bar should be in the trend up or down respectively to the earlier bar which is piercing out of the channel and not at same levels. In uptrend, high of that second bar can be used to buy and in downtrend, low of the second bar can be used to sell.
Put stop loss of one bar below for uptrend and one bar above for downtrend. Keep trailing as per the risk appetite. We can add during the trend when the candlestick bars touches the channel line and again detaches itself to follow trend, same second bar high should be used as explained earlier for buy or sell respectively.
Keep raiding this trend until the bars touch lower channel in uptrend and upper channel in downtrend respectively. There are many ways to take profit as per your money management. Book profit at 1:2 or 1:3 or 1:4 etc as per the risk. One best way is to put trailing stop loss at high of every bar, it can also be at low but if the size of bar is big and in case of reversal of trend, that bar length of profit would be lost. If the bars are too big then half of the bar can be used for stop loss to average out of profit on reversal. If the bars are far away from channel profits can be booked.
This works very well for 1 hour and above time period. Certain stocks may not fall into this strategy due to way they operate or may very rarely follow the above 21 EMA channel pattern.
Above chart is an example and we tried to put strategy as simple as we can. Exceptions to strategies will always be there, so please back test as much as you can to understand this method.
Hope this helps to gain a bit of knowledge!
Please press like or thumbs up button, if you like this strategy, Thanks
Nifty respects 16350 resistance and ends close to day lowNIFTY 50 EOD ANALYSIS -06-08-21
IN SUMMARY
Open / High / Low / Close
16304.4 / 16336.75 / 16223.3 / 16238.2
Trading Range Low to High: 139 points
Likely Max Realistic Opportunity @ 50%: 69.5 points
India VIX: 12.61 / --2.02%
FII DII activities: -680 Crores
CHART BASED CONCLUSIONS
Nifty made a slightly higher low but a slightly lower high.
This is indicating indecisiveness on how far it can go up as there was no attempt to retest the ATH today.
After the opening gap-up, Nifty did not recover and kept drifting down especially after RELIANCE tanked more than 2% upon losing case against Amazon in the SC.
Nifty barely managed to end the day a few points above the day low.
Though on the daily charts, it looks as if it is likely to come down further, on the weekly charts, Nifty is looking well poised for a move upwards as the momentum is picking up and the RSI has some headroom for bullish moves.
TOP 6 LOSERS
CIPLA is # 1 and SHREE CEMENTS is # 3 and ULTRA TECH # 4.
But the real problem lies in the heavyweights occupying the other spots.
RELIANCE -2.12%
SBIN -1.4%
HDFC -1.26%
When these 3 are combined, one imagines the plight of Nifty so today’s losers area is differently covered.
TOP 3 GAINERS
Likewise, in this area,
INDUSIND BANK +3.19%
ADANI PORTS +2.47%
IOC +1.88%
Are the leaders, however, Nifty was saved for the day by the following heavyweights
TECH M +1.31%
MARUTI +1.04%
TCS +0.79%
HUL +0.59%
HDFC BANK +0.53%
The positivity of HDFC BANK, as well as KOTAK BANK, ensured that BANK NIFTY did not go down much which helped prevent further slide and a possible sell off in Nifty.
POSITIVES
16200 level held for the day as well as the week.
HDFC BANK, KOTAK BANK, MARUTI, and TCS holding the fort amidst pressure from other biggies.
BANK NIFTY maintained composure despite SBIN leading the losers’ pack.
NEGATIVES
SBIN continues to be under pressure possibly on account of exposure to Vodafone Idea.
RELIANCE slipped back in the sideways zone just as it was attempting to break past the high of yesterday. The fall was sharp and severe which changed the market sentiment.
FIIs DIIs are net sellers of 680 Crores.
TRADING RANGE FOR W/B 9-8-21
Nifty broad range for the week 16000-16500. As of now, it has not made any significant movement from where one could derive the likely supports and resistances.
BANK NIFTY support base at 35200-600 and resistance at 36200-36500.
INSIGHT / OBSERVATIONS
RBI policy has become a non-event. There is hype but that is all.
Despite VIX falling, Nifty moves were choppy. This possibly indicates that the overall trend is likely to be intact and the intraday moves could be choppy when news-driven scrips make moves.
HDFC BANK was raring to close past 1500 but peer pressure prevented it from doing so. It is now above the 50 DMA which is a good sign.
Are scrips like RELIANCE worth trading? If a major scrip can slip on account of the SC verdict, is it really a solid scrip? Or all this is just done by those who have the power to sell off and a premonition about the likely verdict.
Should SEBI not look into such matters?
What do you think?
Thank you, and Happy Money Making!
Umesh
6-8-21
P.S. If you choose to comment on the above, please do so with your analytical view rather than merely passing a comment. Your presentation of the view held by you would help other readers as well.
NOTE --
This write-up is not a prediction mechanism for the movement of Indices in the Indian markets as the markets are unpredictable in nature. I may refer to many data points in the article but I do not base my view on any of these standalone. In fact, I prefer to react to the price moves than predict the price moves. I also do not review Open Interest. Whatever data points I am using, are all stated in the article. The article title, as well as its contents, can at best be stated as --- This Is How I Read Nifty. I hope I have been able to set the expectations right.
AMZN 1 Year Old Resistance Broken and Pullback Level TestedAMZN was Testing this level since Sep 2020, which recently had a Breakout @3575 Level. The Pull Back is also Complete and the @3575 Levels are tested.
This level was very strong Resistance for AMZN Price, which after breakout technically got converted into a Strong Support.
Might Think of going long with Stops around @3500.
Do follow for more trading setups like these
Thanks, if you have any queries/suggestions related to above pattern, feel free to type below in the comment section.


