Shrinking Bond Yield Differentials leading to fall in Rupee India has over the past year. by design, maintained a low interest rate environment. This has led to interest rate differentials shrinking between US and Indian bonds. While low interest rates in India are an indicator of a strong economy, a falling interest rate differential leads to capital flow out of India, thereby hurting the Rupee.
Its Budget Season in India, and at such a time if the equity markets are falling and so is the Rupee, then popular opinion gets shriller.
Hence this video to calm the nerves of investors by looking at the deeper data trends rather then falling prey to mindless cacophony.
Bondyields
Budget Analysis: Mother of Bull Markets Coming... The Government has managed to keep the fiscal math under control. More capex, less borrowing, reduced revenue deficit - all make up for a sound platform on which the economic development can take off.
As and when the global economy picks up and India gets a ratings upgrade, expect yields to cool down even more and equity markets to shoot through the roof.
If you can't read this from yesterday's budget, you are losing on a giant of an opportunity.
Liz Truss, Rishi Sunak, Starmer - Lessons for India from UKIndian Budget will be presented in Jul 2024. This will be a coalition government budget, hence there is a chance of the government going populist and yielding to coalition partners demands. Indian government has done a fabulous job in the last decade of maintaining the public finances in a strong position.
This video tries to highlight where we stand due to our correct economic policies of the last decade - including a once in a century pandemic - against the global backdrop
Predicting Nifty direction looking at India Govt 10Y Bond YieldWe can see an interesting correlation between t NSE:NIFTY1! he and the $TVC:IN10Y.
See the charts. The top chart is showing India Govt 10 Yr Bond Yield (IN10Y) and the below chart is current Nifty Future.
The IN10Y is making lower highs while our Nifty is making higher highs.
In the chart with purple color mentioned the direction. We can see whenever the IN10Y is gong up, Nifty is going down and vice versa.
The purpose of the study is to understand the recent Reserve Bank of India (RBI) highest ever dividend to Indian Govt. As we can see the IN10Y is negotiating it's long term support of around 7.00/6.95 level. (695-700 basic points, bp). And we can see the Nifty is at ATH (23K).
Due to the high dividend of RBI naturally the Govt needs less money to be borrowed from money market through CGs and t-bills. Hence it will push the demand for the existing bonds higher, thus resulting a lower bond yield. If it breaks the 6.95 level in Weekly chart, it will see more downfall, resulting more upside to the Nifty.
Enjoy the show.
Understanding Impact of Bond Yield Differential on EquitiesOver the past decade the interest rate differential between US and India has been constantly going down. This has largely been due to stronger fiscal position of India and also gradual weakening of US Public Finances.
This has led to the Rupee becoming more stable against the Greenback, thereby reducing the rate of inflation in India.
Further, this has resulted in rising of equity markets over the last decade, and more importantly, the same setup is likely to stay or become better over the next two decades.
Hence long term retail investors in India can benefit from this by placing algo based orders to buy Index ETFs on dips and reduce their cost of buying and stay invested over the long term thereby getting benefit of power of compounding.
---------------------
Trading View Script:
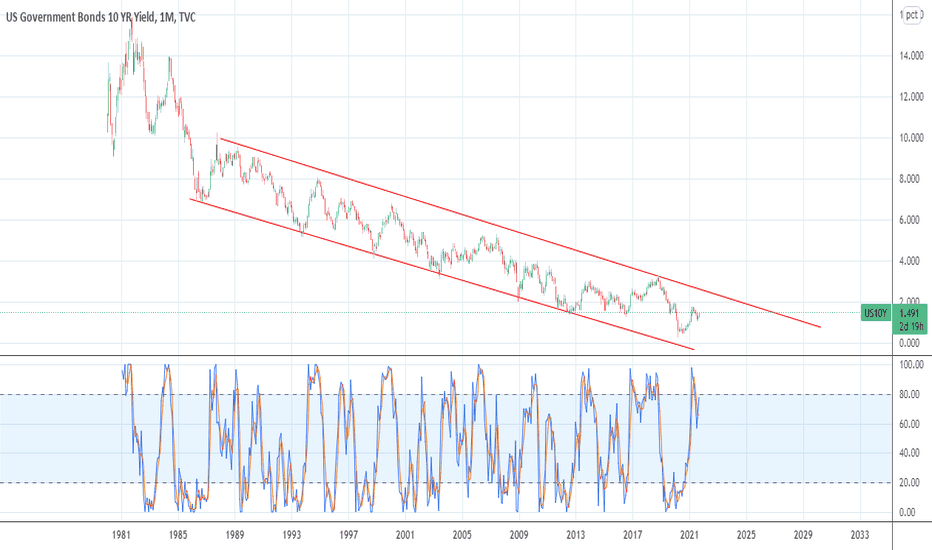
US10Ythe fall started from 15% in Oct' 1981 until 0.533% in Jul 2020 has formed a parallel channel.
Though the rise has been sharp and with very little consolidation.
However it may start consolidating from 6-8%
retracement from that may not be much, however time correction is needed as bond yield has increase too much in little time.
Indian and US G Sec Yields and impact on USDINR and EquitiesBond Yields in India are anchored at 7% whereas in US the curve is inverted and interest rates are going to be 'higher for longer'.
Inspite of this Rupee is not getting hammerred, due to huge forex reserves and even the Indian stock market is fairly resilient, thanks to deluge of local money.
So going forward, a long term investor is likely to benefit if he/ she keeps buying the dip and just stay invested.
End of rate hike cycleUS fed rare hike cycle is near about to end in next 6-9 months or it has already reached to the peak. Reversal in inversion from above 0% level had given signals of stoppages of rate hike cycle in last 3 incidents. 1-2 more hike may come but that's end of upmove in interest rate. Time to lock 10 year bond yield.
Disc : It's not an investment advise to buy or sell
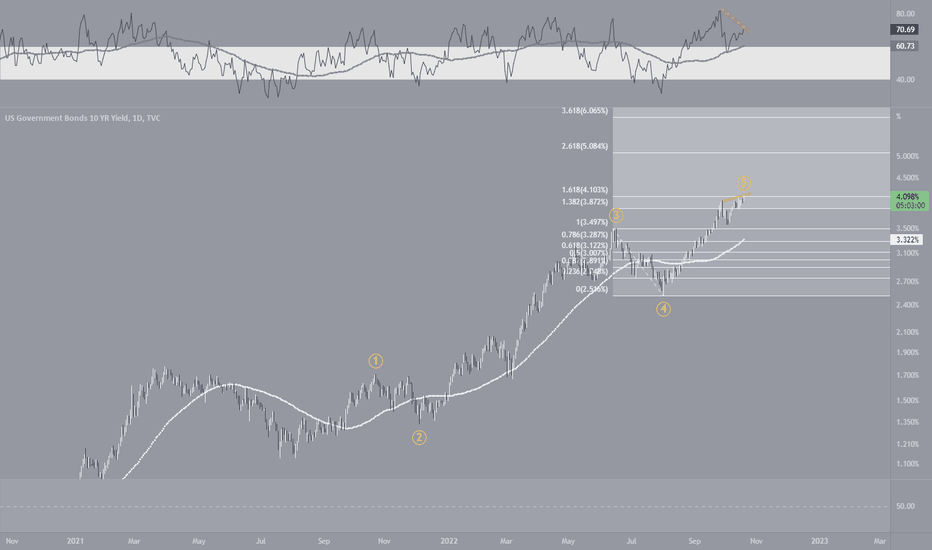
US10Y - Looks like a high is completedUS10Y could be in at its peak in current wave cycle to stary a ABC correction.
RSI on daily is also showing divergence indicating topping out sign. The correction in US10 will be good for equities.
View will be invalid if the high 4.123 is broken and wave 5 might get extended.
User discretion!
Rounding bottom (Cup & Handle) formation breakout?? #US10YCharts show breakout of rounding bottom formation on Weekly/Monthly charts of US 10year yields. Already got monthly closing above the breakout line.
If sustains above the breakout line minimum target for 10y yield will be around 5.5/6.5 pc. If so, there will bloodbath across all asset classes. Only below 3.4/3.3 negates the idea.
Brace! Brace! Brace! If true, difficult times ahead.
Hope I'm wrong.
Happy trading
TLT stabilizing after big fall. Bond buying starts from here?US Treasury long-term bond yields have risen significantly and sharply over the last few weeks. This is apparent in the steep fall of TLT, the long-term US Treasury bond ETF, from 145 to its two year support of 135. In fact the price touched 136 on 26 Feb'21. The price has now begun to stabilize with RSI giving bullish divergence at this long term support level of 135.
Possible to see bond prices recover from this level, and hence finally a halt on the rising yields?
Indian govt 10y bond yields set to spikeWeekly chart
10 year yield broken 2 year resistance.
It is currently in the middle of the upward channel.
2 year resistance line could possibly act as a support which is at 7.50%-7.52%.
Yields could possibly retest support and then spike towards 8%.
Bond traders should ideally look to go short in price (long in yields at 7.50%) with stop at yield equivalent of 7.29% for a target of a price at yield equivalent of 8%.


