$LTC to $500–$1000? Could Explode in the Next Alt SeasonCRYPTOCAP:LTC to $500–$1000? Could Explode in the Next Alt Season
CRYPTOCAP:LTC has been slow-growing, but I see strong potential here. I’m holding tight.
Imo, CRYPTOCAP:LTC could easily hit $500 during the next alt season. If it drops below or near $90, that’s a solid opportunity to accumulate for long-term gains.
A 10x from here isn’t impossible: $500–$1000 is within reach, but it will require patience.
Worth noting: CRYPTOCAP:LTC didn’t hit a new ATH after the 3rd halving, unlike the first two, which reached new highs within about 1000 days. This suggests there’s still a real chance for CRYPTOCAP:LTC to hit a new ATH within the next one Year.
Stay patient, plan your entries, and don’t get caught up in FOMO.
⚠️ Disclaimer: NFA. Crypto is risky. DYOR and only invest what you can afford to lose.
Breakout!

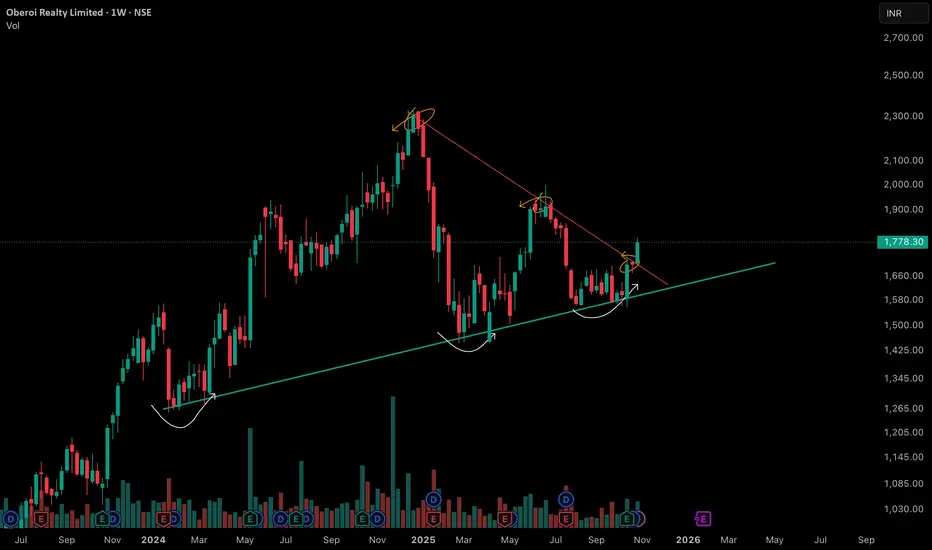
Volume Contraction Pattern Amidst Dual TrendlinesThe chart reveals important price structure and behavior over the past 18 months, featuring both a prominent counter trend line (marked in red) and a long-term support trendline (marked in green). Each element signifies distinct phases of supply absorption and buyer interest.
• Counter Trend Line (Red): This line has consistently acted as a pivot for multiple lower highs, reflecting the presence of vigilant sellers at each attempt to move higher. Multiple reaction points along this line indicate repeated supply emergence whenever price approached the zone, especially after sharp rallies earlier in the trend.
• Support Trend Line (Green): The green upward-sloping line marks sequential higher lows. This support axis has been respected multiple times, hinting at growing accumulation at each retest despite temporary price weakness in the broader market. The curvatures at lows (forming cup-like bases) display periods of volatility contraction and constructive price action as buyers step in at successively higher prices.
• VCP Dynamics: The pattern visible in the chart exhibits systematic contraction in the price swings. Each corrective structure—characterized by the curved reactions at support—shows a shrinking amplitude in both price and volume. This VCP sequence typically points toward consistent supply absorption, with sellers getting exhausted at lower levels after each contraction. The emergence of strong green candles with above-average volume near the support line often signals a revitalization of demand forces, as seen recently.
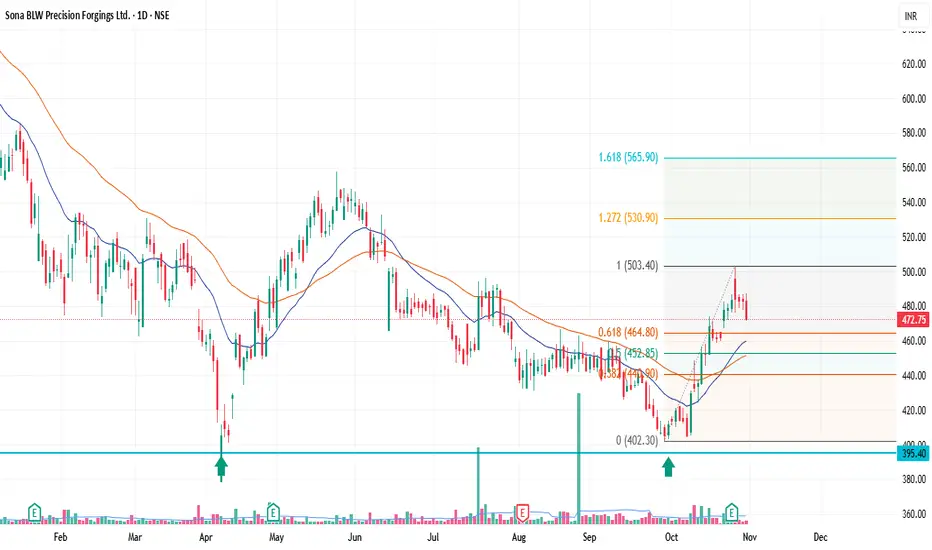
Sona BLW Precision Forgings Ltd. (SONACOMS) — pullback setup(SONACOMS) — Bullish Pullback Setup
📅 Timeframe: 1D | 💰 CMP: ₹472.75 | 📈 Volume: Above average
Technical View
Sona BLW has completed a strong impulse wave from ₹402 → ₹503, followed by a healthy pullback.
Price is now retracing near the 0.618 Fib level (₹464.8), aligning with the 21EMA — a zone that often acts as support during trend continuation.
Volume on the breakout was strong, showing accumulation interest.
Trade Plan
Entry Zone: ₹465–₹470
Stop Loss: ₹450 (below 0.5 Fib and 20EMA)
Targets:
🎯 T1: ₹503
🎯 T2: ₹530 (Fib 1.272)
🎯 T3: ₹566 (Fib 1.618)
Summary
✅ Uptrend resumption likely if ₹450 holds
✅ Rising 21EMA & 50EMA support the structure
✅ Strong breakout volume confirms institutional buying
Bias: Bullish
Risk–Reward: ~1:2.5+
Invalidation: Close below ₹450
Disclaimer : Risk management is crucial in this volatile market, so keep position sizing appropriate. This analysis is intended for educational purposes and not financial advice.
UNIONBANK: Cup & Handle Sets Stage for UpsideThe chart for Union Bank of India Limited (NSE: UNIONBANK) shows a classic "Cup and Handle" pattern forming over a multi-year period, which is a bullish technical setup supported by steadily increasing volume and positive price action.
• The cup portion covers a deep, rounded bottom with a gradual recovery, fulfilling classic characteristics of the pattern.
• The handle is a minor consolidation after the uptrend, with no deep pullback, which matches a bullish setup.
• Volume increases during the breakout, confirming upward momentum as per technical analysis norms
• The moving averages are trending up, further reinforcing the bullish sentiment.
Entry Target:
The ideal entry is around the breakout level of the handle, which is close to ₹148-150 per the latest monthly close shown on the chart, with a swing target of 160 on immediate basis.
Breakout Level:
The breakout occurs as price closes above the handle’s resistance, which aligns with the ₹160-162zone and provides confirmation. For better risk to reward ratio buyout above 162 levels is suggested.
Investor Targets:
• Target-1: ₹205, which is the first target based on the pattern's height projection.
• Target-2: ₹250, the next logical resistance level using the pattern’s depth and typical bullish extension.
• Price Target: ₹300-304, which is a long-term target if the momentum sustains and the bullish breakout persists.
Stop Loss:
• Place a stop loss below handle support, marked at ₹108 o n a closing basis to manage risk.
📌 Thanks a ton for checking out my idea! Hope it sparked some value for you.
🙏 Follow for more insights
👍 Boost if you found it helpful
✍️ Drop a comment with your thoughts below!

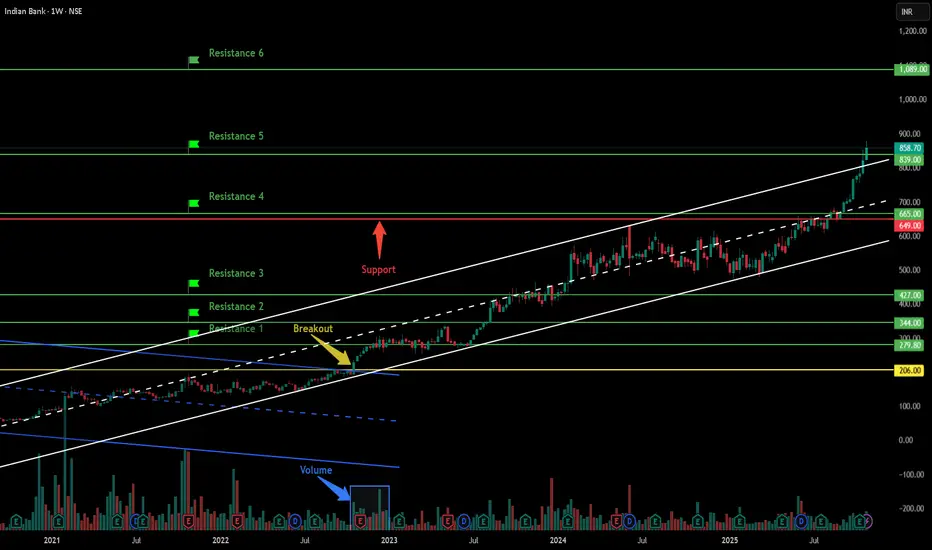
Indian Bank - Breakout Setup, Move is ON...#INDIANB trading above Resistance of 839
Next Resistance is at 1089
Support is at 649
Here are previous charts:
Chart is self explanatory. Levels of breakout, possible up-moves (where stock may find resistances) and support (close below which, setup will be invalidated) are clearly defined.
Disclaimer: This is for demonstration and educational purpose only. This is not buying or selling recommendations. I am not SEBI registered. Please consult your financial advisor before taking any trade.
Precision Wires (M): Strongly Bullish (ATH Breakout)The stock has decisively broken out of a 10-month consolidation range, creating a new All-Time High (ATH) on exceptional volume. This signals the potential start of a new, major uptrend.
📈 1. The Long-Term Context
- Sideways Trend: The stock was in a prolonged sideways consolidation phase starting from January 2024.
- Volume Contraction: During this sideways period, volume was "drying up," which is a classic bullish sign of seller exhaustion and accumulation.
- The "Lid": This consolidation formed a strong horizontal resistance level that capped all rally attempts throughout the year.
🚀 2. The Decisive Breakout (The October 2025 Event)
In October, the stock broke this pattern with explosive force:
- Massive Surge: The stock surged 23.11% in a single move.
- Exceptional Volume: This surge was backed by massive, high-conviction volume of 24.51 Million shares, confirming strong institutional interest.
- ATH Achieved: This move pushed the stock to a new All-Time High and, most importantly, closed firmly above the horizontal resistance that defined the 2024 & 2025 trading range.
📊 3. Key Technical Indicators
The underlying momentum supports this bullish breakout:
- EMAs: Short-term Exponential Moving Averages are in a "PCO" (Price Crossover) state, signaling a new, strong bullish trend.
- RSI: The Relative Strength Index (RSI) is rising, indicating that buying momentum is strong and accelerating.
🎯 4. Future Scenarios & Key Levels to Watch
⚠️ A Note of Caution
While the breakout is clear, we need to be cautious. After such a sharp vertical move, a "pause" or "pullback" is healthy. The primary risk to monitor is potential bearish divergence
🐂 The Bullish Case (Breakout Continuation)
- Confirmation: The old resistance must now act as new support. As long as the stock holds above this breakout level, the trend is intact.
- Target 1:₹320
- Target 2:₹410 (if momentum continues)
🐻 The Bearish Case (Breakout Failure)
- Trigger: If the breakout fails, the stock will fall back below the old horizontal resistance level (the one it just broke).
- Confirmation: A high-volume move back into the old range.
- Target: This would signal a "fakeout" and could lead to a sharp decline to the nearest support ₹170 .

$HYPE/USDT Breakdown Confirmed: 30–60% Downside Incoming!$HYPE/USDT Breakdown Confirmed: 30–60% Downside Incoming!
Price broke critical support + completed a bearish retest. I'm positioning for a 30-60% correction from current levels.
TARGET ZONE: $20-$25
Why I'm Bearish Short-Term:
✅ Support turned resistance after break
✅ Already pumped 500%+ in 6 months - early holders are rotating out
✅ Clear distribution pattern forming
✅ Risk/Reward heavily favors shorts here
THE NUCLEAR WARNING: Almost $500M worth of tokens unlocking in the next 28 days.
This isn't FUD - this is math. That kind of supply hitting the market? You do the calculation.
Long-Term Perspective:
$20 zone could be THE generational entry for patient money. But right now? Let the distribution play out.
GETTEX:HYPE Distribution Phase Confirmed? 👇
NFA & DYOR

$LINEA WARNING: Bearish Pressure + Accumulation Opportunity Ahea$LINEA WARNING: Bearish Pressure + Accumulation Opportunity Ahead!
Chart Analysis Recap:
Previous exit signal: $0.025 → #Linea is now ~50% down ✅ confirms chart-based strategy.
Current trend: Super bearish; expecting further downside 20%-40% before the next upward leg.
Long-Term Potential:
@Linea.eth could give 10x returns, targeting $0.1–$0.2, but success depends on smart entry points.
Key Strategy:
Ideal accumulation zone: below $0.01 for long-term holders.
Trade smart, enter on hard dips and manage risk.
Takeaway: Patience + technical discipline = positioning for potential massive upside.
NFa & DYOR

$XPL ALERT: Bearish Now, Massive Accumulation Ahead?AMEX:XPL ALERT: Bearish Now, Massive Accumulation Ahead?
Current Chart View:
AMEX:XPL (Plasma) is showing bearish momentum at current levels. Expect a potential 30%-50% downside, which could create a high-probability accumulation zone for strategic investors.
Key Resistance: $0.32 (blue trendline)
Only a close above $0.32 on higher timeframes (HTF) will trigger a bullish trend reversal. Until then, bears are in control.
Targets if Bullish Breakout Occurs:
Short-term: Price clears $0.32 → bullish momentum resumes
Long-term: $2 possible if price sustains above $0.32
Trading Strategy:
Accumulate in the lower support zone for maximum risk-reward
Wait for HTF confirmation above $0.32 for safer long positions
Watch volume & momentum for breakout validation
Market Insight:
AMEX:XPL offers strategic accumulation potential now, but patience is key. The next bullish move depends entirely on HTF breakout confirmation.
NFA & DYOR

Will SUI/USDT hit $20 in current bull market or future?SUI Testing Final Demand Zone: Reversal Imminent?
SUI is currently testing a major re-accumulation zone around $2.1 – $1.8, which previously acted as a strong demand area.
A liquidity grab below this level could trigger a sharp reversal, similar to the last time price swept lows before a massive rally.
The structure remains valid as long as this zone holds.
Once price reclaims the $2.7–$3.0 resistance, momentum could shift strongly bullish, targeting the $4.8 zone, and eventually the $20 macro target if the trend continues.
Support: $2.1 – $1.8
Resistance: $2.7 / $4.8
Macro Target: $20
Of course, NFA & Always DYOR

Indraprastha Medical Ltd | Bullish Flag Breakout | Swing SetupCompany Overview (Fundamental)
Indraprastha Medical Corporation Ltd (IMCL) operates under the Apollo Hospitals Group and manages the Indraprastha Apollo Hospital, New Delhi — one of India’s largest multi-specialty hospitals. Company financially strong, consistent profitability, improving margins, and low debt.
Fundamentally stable company with consistent earnings and a defensive sector (Healthcare).
Strong base for technical breakout follow-through.
💰 Market Cap: ~₹5,400 Cr
📈 Revenue Growth (YoY): +16% (Strong Growth)
💸 Net Profit Margin: ~10–12% (steady)
💵 Debt-to-Equity: 0.05 (virtually debt-free)
📊 ROE (Return on Equity): ~20%
Technical Overview
The setup represents a bullish continuation phase, with EMAs stacked positively and volume confirming accumulation.
Price trades above all 3 key EMAs (9, 20, 50) — strong bullish alignment.
Formation of a textbook Bullish Flag Pattern after a sharp pole rally from ₹460 to ₹610.
Recent candle closed bullish with +3.4% gain and high volume (2.48M) — indicating renewed buying interest.
RSI ~60 → Momentum healthy and not overbought.
MACD positive crossover developing, confirming bullish trend strength.
Price Action Analysis
Clean, bullish, momentum-driven move with volume confirmation.
Buy on dip near breakout retest at ₹580-583
Book Partial profit at ₹625–630
target 2: ₹655–660 this will be Flag breakout projection.
A perfect risk to reward ratio following.
Disclaimer
This analysis is for educational and research purposes only — not investment advice.
Always do your own due diligence and manage risk before trading.

Major Counter Trendline Structure, Strong Channel & Demand FlipThe weekly chart for Chennai Petroleum Corporation Ltd (CPCL) presents a robust technical development without classic breakout language.
-Price action has respected a prominent red counter trendline, with the latest move representing a shift in momentum against the prior trend.
-A clean parallel channel with dotted lines has formed, indicating sustained price progression and orderly accumulation over several months.
-There's a key supply-demand conversion zone, now acting as a pivotal support area after functioning as resistance. This is where previous selling interest is replaced by renewed buying activity.
-Notably, volumes are surging in alignment with this move, confirming broad participation and strong conviction among buyers.

RBLBANK ( M ) BREAKOUTStock Name : RBL BANK ( M )
Friends, after a long time, this stock has broken out in the monthly time frame after about five years and eight months. This type of breakout is considered very strong and there are only two days left for the completion of this month's candle. So we can consider this as a complete breakout. If you look at the range of the breakout, it was Rs 180. Then you can add the stock to your watch list.
Target 1 : 396 - 400
Target 2 : 475 - 500
Note: Our posts are posted for learning purposes. You will be responsible for any profit or loss you make from the advice given in the channel. Before investing in the stock market, you must consult your financial advisor.
WE ARE NOT A SEBI REGISTERED

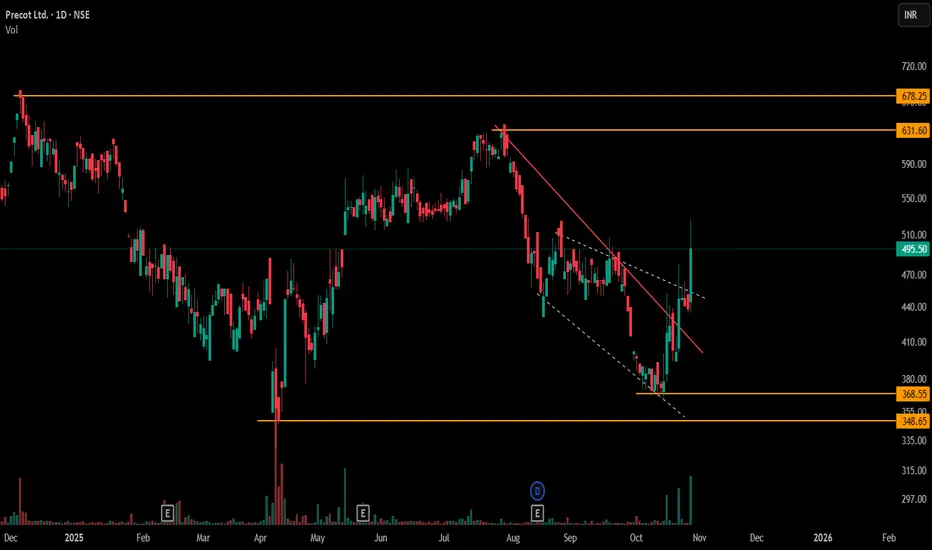
Objective Observation in Sideways Markets1) Sideways market action is clearly depicted here, with price oscillating between well-defined resistance and support bands (marked by orange horizontal lines). The presence of both multiple resistance and support levels typifies a range-bound environment, where relying solely on single breakout/CT patterns may lead to inconsistent observations.
2) To supplement this, a solid red counter-trendline has been drawn across recent swing highs/lows, offering a direct visual of shifting momentum pockets. In sideways phases, such counter-trendlines might limit or expand their analytical usefulness, depending on whether price respects or ignores these boundaries within the broader “box”.
3) Further, layering a secondary dotted formation—a small broadening pattern—provides additional observation reference points. Using both counter-trend and minor broadening structures together helps in mapping probable price responses at key junctions, especially when horizontal supports/resistances cluster.
4) By objectively tracking these intersections and reactions—rather than expecting a directional resolution—traders gain more nuanced insight for potential tactical responses on future moves. No forecasts here; just systematic, multi-pattern observation.
BUY TODAY SELL TOMORROW for 5%DON’T HAVE TIME TO MANAGE YOUR TRADES?
- Take BTST trades at 3:25 pm every day
- Try to exit by taking 4-7% profit of each trade
- SL can also be maintained as closing below the low of the breakout candle
Now, why do I prefer BTST over swing trades? The primary reason is that I have observed that 90% of the stocks give most of the movement in just 1-2 days and the rest of the time they either consolidate or fall
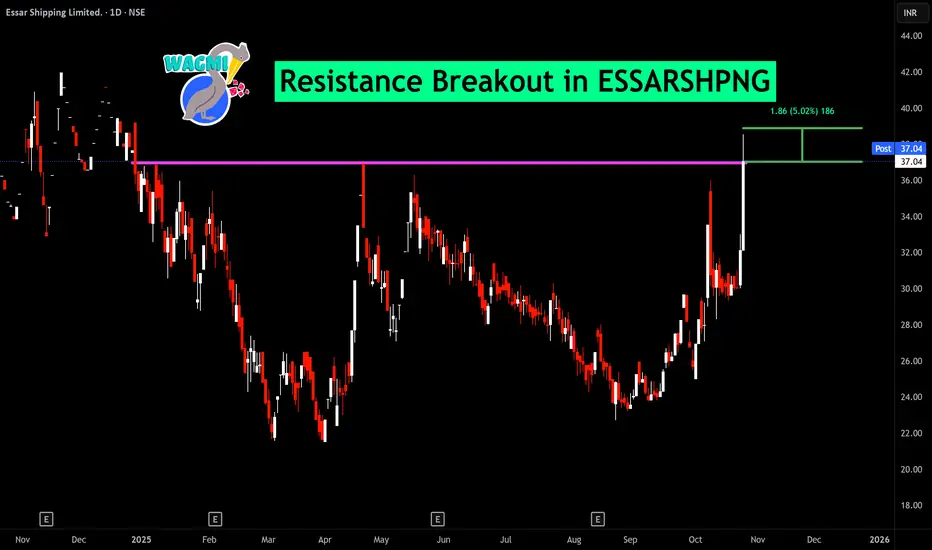
Resistance Breakout in ESSARSHPNG
BUY TODAY SELL TOMORROW for 5%
MRPL Triangle BreakoutMRPL has given a Breakout after forming a Triangle Pattern on 1D timeframe with very high volumes. The stock is also trading above its 200EMA.

Jaicorp ltdCup handle pattern with good volume in green days,
Negative days low dry volume .
178 resistance if it break then easily move more up side
Stop loss below handle
9%

BUY TODAY SELL TOMORROW for 5%DON’T HAVE TIME TO MANAGE YOUR TRADES?
- Take BTST trades at 3:25 pm every day
- Try to exit by taking 4-7% profit of each trade
- SL can also be maintained as closing below the low of the breakout candle
Now, why do I prefer BTST over swing trades? The primary reason is that I have observed that 90% of the stocks give most of the movement in just 1-2 days and the rest of the time they either consolidate or fall
Consolidation Breakout in KFINTECH
BUY TODAY SELL TOMORROW for 5%

Supply-Demand Squeeze: Symmetrical Triangle at the Flip zoneWitness a textbook supply-demand play on the monthly chart of Bharat Wire Ropes Ltd. as price contracts above a major zone conversion! The chart highlights a high-probability symmetrical triangle pattern—marked with a red counter trendline (lower highs) and a green trendline (higher lows).
This powerful squeeze forms right at the intersection of key supply and demand zones.
- Both supply (resistance) and demand (support) have been mapped for clear zone analysis.
- The symmetrical triangle shows classic price contraction
- Red line: Counter trendline connecting lower highs.
- Green line: Trendline connecting higher lows.
Disclaimer:
This Observation / Post is for educational purposes only and does not constitute investment advice. Please do your own research and consult with a financial advisor before making any trading decisions.

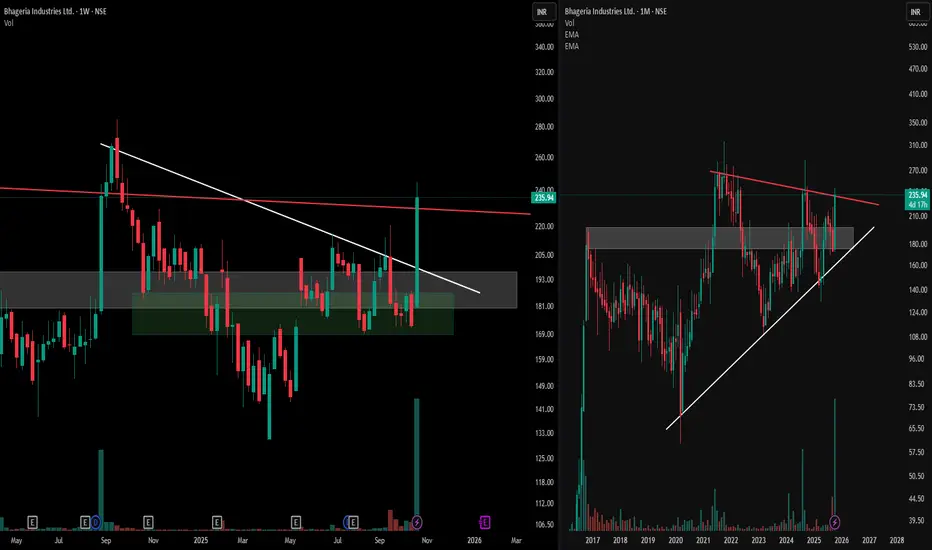
Mastering MTFA Charts : Symmetrical & Descending PatternsObserve the synergy of multiple time frames with this detailed analysis of Bhageria Industries Ltd.
Target Points -
1) The right panel displays a monthly chart, highlighting a broad symmetrical triangle formation within a prominent supply-demand zone—notice how the structure showcases the interplay of lower highs and higher lows, reflecting a period of equilibrium and market compression.
2) The left panel brings the focus to the weekly time frame, where a descending triangle pattern unfolds, providing additional insight into the ongoing price structure.
3) This multi-time frame approach emphasizes how patterns from broader time frames interact with shorter-term consolidations, enhancing our ability to spot critical decision areas on the charts.
4) Using both the monthly and weekly perspectives together, traders and learners can deepen their understanding of structural price action, pattern development, and the relevance of context provided by supply and demand zones. Dissecting these formations side by side promotes disciplined, informed chart reading without bias towards anticipating outcomes.
This analysis is for educational purposes only and does not constitute financial advice.
BUY TODAY SELL TOMORROW for 5%DON’T HAVE TIME TO MANAGE YOUR TRADES?
- Take BTST trades at 3:25 pm every day
- Try to exit by taking 4-7% profit of each trade
- SL can also be maintained as closing below the low of the breakout candle
Now, why do I prefer BTST over swing trades? The primary reason is that I have observed that 90% of the stocks give most of the movement in just 1-2 days and the rest of the time they either consolidate or fall
Resistance Breakout in RACLGEAR
BUY TODAY SELL TOMORROW for 5%

BUY TODAY SELL TOMORROW for 5%DON’T HAVE TIME TO MANAGE YOUR TRADES?
- Take BTST trades at 3:25 pm every day
- Try to exit by taking 4-7% profit of each trade
- SL can also be maintained as closing below the low of the breakout candle
Now, why do I prefer BTST over swing trades? The primary reason is that I have observed that 90% of the stocks give most of the movement in just 1-2 days and the rest of the time they either consolidate or fall
Resistance Breakout in NSIL
BUY TODAY SELL TOMORROW for 5%

BUY TODAY SELL TOMORROW for 5%DON’T HAVE TIME TO MANAGE YOUR TRADES?
- Take BTST trades at 3:25 pm every day
- Try to exit by taking 4-7% profit of each trade
- SL can also be maintained as closing below the low of the breakout candle
Now, why do I prefer BTST over swing trades? The primary reason is that I have observed that 90% of the stocks give most of the movement in just 1-2 days and the rest of the time they either consolidate or fall
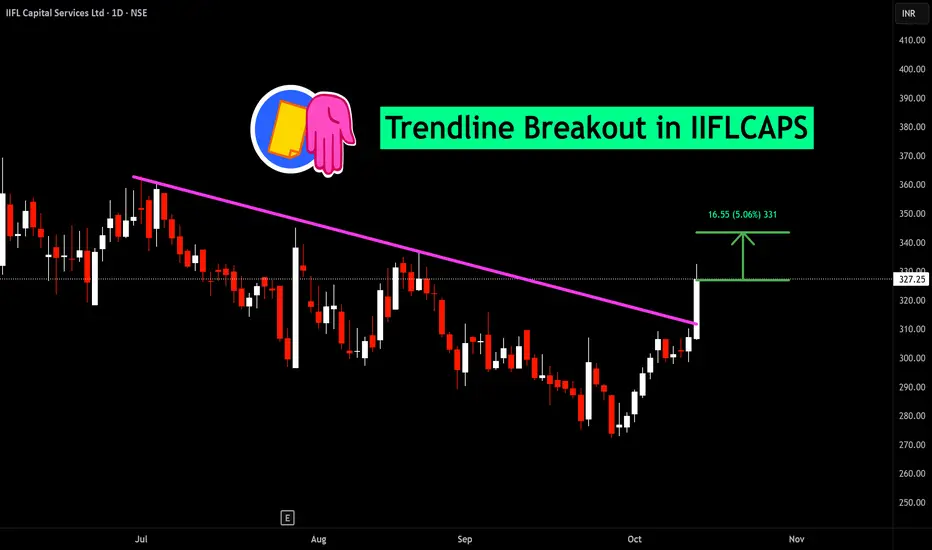
Trendline Breakout in IIFLCAPS
BUY TODAY SELL TOMORROW for 5%