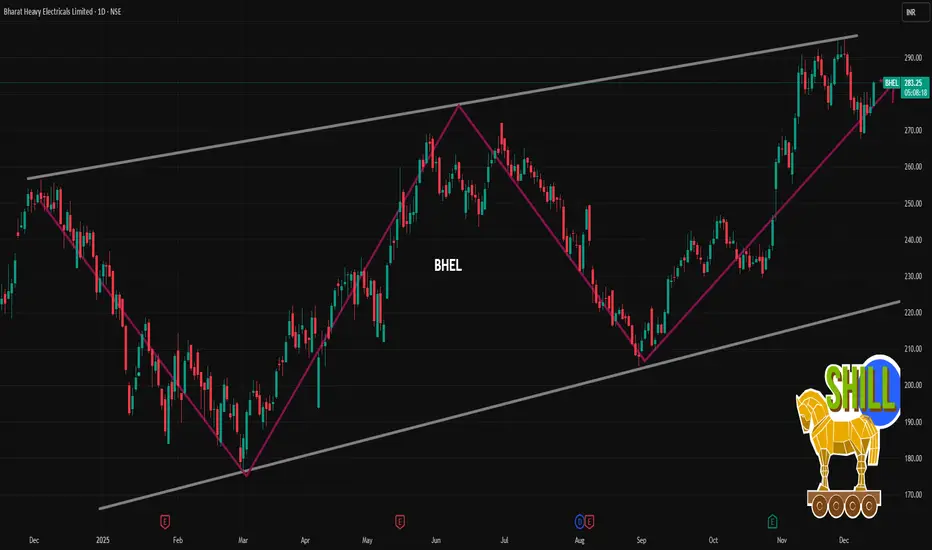
BHEL 1 Day Time Frame 📈 Live/Latest Price (1-Day View)
Current Price (approx): ~₹280.50–₹283.30 per share on NSE (latest intraday range) based on market data today.
Today’s Intraday High/Low: Roughly ₹273–₹279+ so far.
Previous Close / Today Open:
• Previous close near ₹277.75.
• Open around ₹275–₹286 depending on platform/time.
52-Week Range: Low ~₹176, High ~₹291–₹295+.
📊 1-Day Price Change
Recent trading shows relatively small daily movement indicating modest volatility typical of larger PSU stocks.
Chartpatternstrading
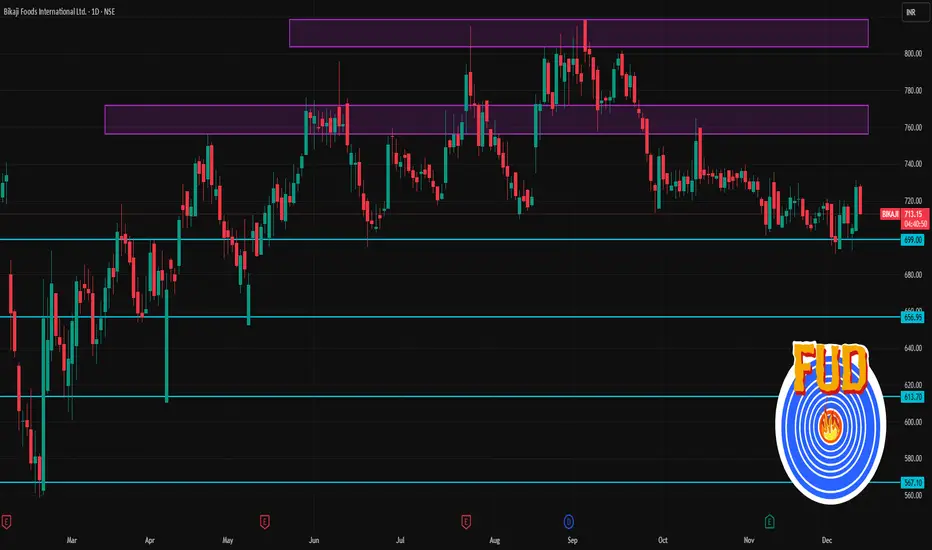
BIKAJI 1 Day Time Frame 📈 Recent Price & Basic Info
Latest price (NSE / BSE) ~ ₹725.60 (close on 10-Dec-2025)
Day’s range: ~ ₹703.90 to ₹731.15.
52-week range: ₹558.80 (low) to ~ ₹864.00 (high)
🧭 Support / Resistance / Pivot-based Levels (Daily)
From pivot-analysis (classic / Fibonacci / others) :
Pivot / Level Price (₹) / Range
Pivot (daily) ~ ₹724.95
Support 1 (S1) ~ ₹722–723 — near pivot
Resistance 1 (R1) ~ ₹727–728
Upper zones / Higher resistances (R2/R3) ~ ₹729–732
Indicative lower support zones (if price dips) ~ ₹699–¥690+
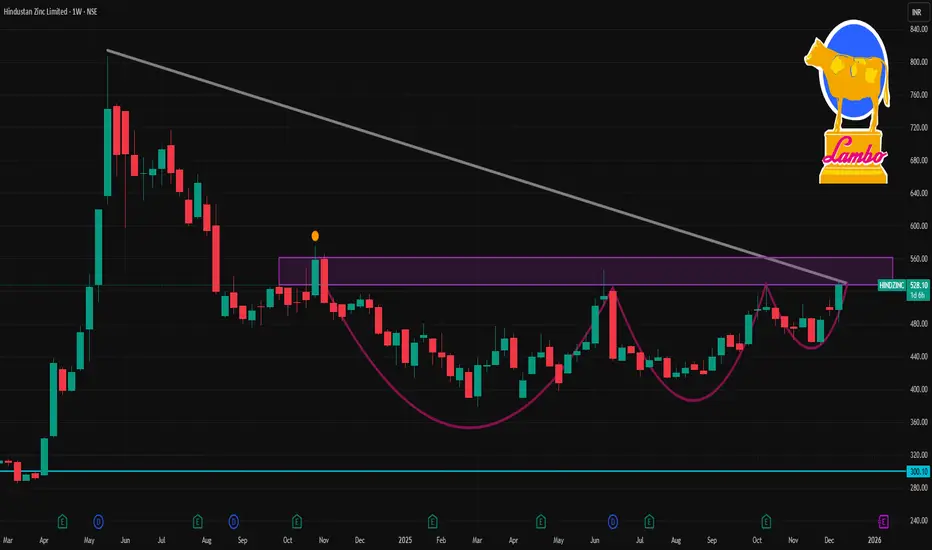
HINDZINC 1 Week Time Frame 📌 Current Situation & Context
Recent trading price (on some platforms) is around ₹528-532.
52-week trading range: ₹378.15 (low) to ₹546.80 (high).
There is renewed analyst interest: some brokerages have flagged HINDZINC among stocks with potential upside (up to ~48%).
⚙️ Key Technical / Pivot Levels (Near-Term)
According to a widely used pivot-point table for HINDZINC:
Level Type Approximate Price (₹)
Weekly Pivot (Standard) ~ ₹488.00
Weekly Support 1 (S1) ~ ₹476.00
Weekly Support 2 (S2) ~ ₹465.30
Weekly Resistance 1 (R1) ~ ₹498.70
Weekly Resistance 2 (R2) ~ ₹510.70
Weekly Resistance 3 (R3) ~ ₹521.40
✅ My Base Case (1-Week)
Given current price strength + analyst interest + global metals/commodity context:
Likely trading range over next week: ₹510 to ₹540, with possible upside toward ₹540–545 if momentum holds.
Key zone to watch (support): ₹498–510 — ideal for dip buying or watching consolidation.
ANGELONE 1 Week Time Frame 📈 Current Price & Technical Context
Recent quote: around ₹2,525–₹2,535.
According to a recent technical report, the stock’s 50-day and 200-day SMAs are near ₹2,526–₹2,561.
One recent analysis notes formation of a “Golden Cross” (50-DMA crossing above 200-DMA), which is bullish — but also points out that the stock is still trading slightly below 50-DMA, so a strong up-move depends on reclaiming that level.
The weekly technical outlook from a charting site flags a “neutral” trend this week.
✅ What to Watch Closely (Triggers & Conditions)
Reclaiming 50-day SMA (~₹2,526–₹2,561) seems important. Trading above that could strengthen bullish bias.
Volume / Broader Market Sentiment — since the broker-stock universe is impacted by overall F&O activity and market mood. Weakness in broader capital-markets index may drag down Angel One.
Support breach — If price slides below ~₹2,430, downside risk extends toward ₹2,350 or lower.
Catalyst-driven moves — any fresh company/business update, change in F&O regulation or macro cue could trigger sharp swings.

COALINDIA 1 Week Time Frame 📊 Key Context
Current price is ~ ₹379–380.
52‑week high/low: ~ ₹425–426 high, ~ ₹349–349.5 low.
Recent technical reports show a shift to a more “bearish/neutral” momentum—weekly MACD / moving‑average signals are negative.
🎯 Short‑Term (1‑Week) Levels to Watch
Level Role / Significance
₹374–376 Support zone — near recent intraday lows; a break below may
signal further downside.
₹370 Secondary support — close to the lower end of recent
consolidation; a strong bounce from here could attract buyers.
₹385–388 Near‑term resistance / range ceiling — in line with recent
intraday highs and short‑term moving averages.
₹390–392 Key resistance breakout zone — if price sustains above this,
short‑term bullish momentum may resume.
₹400 (round‑number mark) Psychological / tactical upside target — a breakout push toward
this will likely draw interest from swing traders.

TRENT 1 Day Time Frame 📊 Current Price (approx): ~₹4,085 – ₹4,090 on NSE intraday.
✅ Intraday 1-Day Levels (Support & Resistance)
These levels are useful for short-term setups (day trades, scalps):
Resistance
R1: ~₹4,114 – ₹4,138 (today’s high area)
R2: ~₹4,190 – ₹4,214 (near recent intra-day retracement band)
R3: ~₹4,270 + (higher resistance from Fibonacci levels)
Pivot
Pivot / CPR area: ~₹4,060 – ₹4,080 (central pivot range)
Support
S1: ~₹4,009 – ₹4,030 (immediate support lower band)
S2: ~₹3,980 – ₹3,988 (near recent 52-week low)
S3: ~₹3,875 – ₹3,920 (extended downside projection)
📌 Day Range Snapshot
Today’s Low: ~₹4,080
Today’s High: ~₹4,138

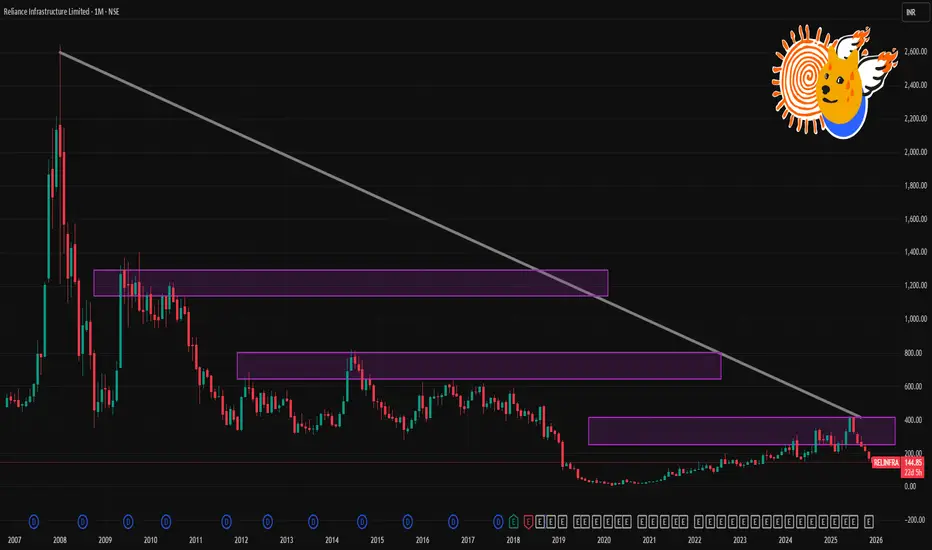
RELINFRA 1 Month Time Frame 📉 What’s Happening Now
As of 8–9 December 2025, Reliance Infrastructure is trading near ₹ 146–147 — its 52‑week low.
Over the past month the stock has seen a sharp drop of ~15–20%.
On 9 Dec it hit a fresh intraday low of ~₹ 139.6‑140, triggering lower‑circuit (i.e. trading halt for the day) — indicating heavy selling pressure.
🔎 Why the Weakness
The recent decline reflects broad selling pressure, partly driven by negative sentiment in its sector and possibly concerns over group‑level regulatory/legal issues.
While the company has been in distress compared with its earlier 52‑week high (~₹ 425), volatility remains high, with the share trading well below major moving averages.
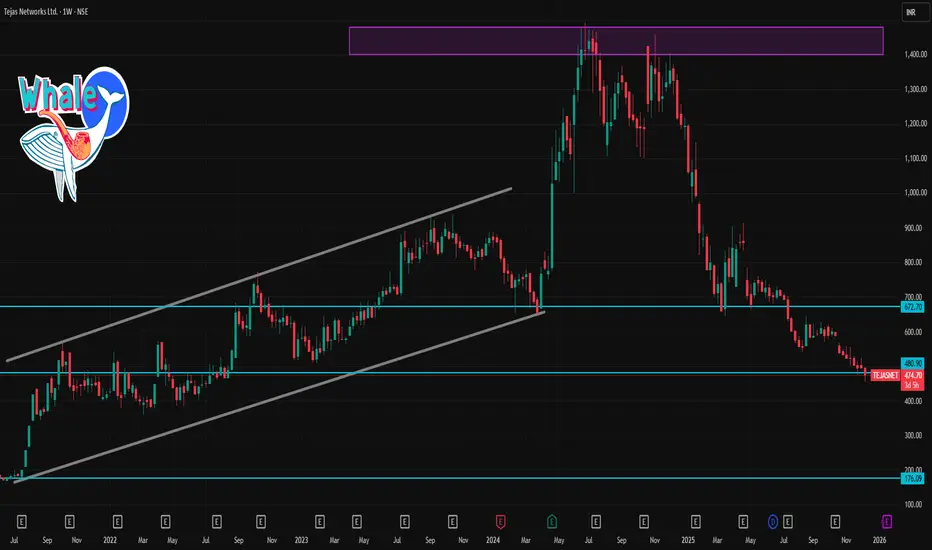
TEJASNET 1 Day Time Frame 📌 Recent Price & Context
According to a live quote on 9 Dec 2025, Tejas Networks is trading around ₹471–₹476.
Recent technical‑indicator feeds (on daily chart) show oversold conditions: e.g. RSI ~ 20 (oversold), MACD negative, ADX high — indicating downward momentum + volatility.
On weekly‑timeframe classification, some aggregator sources rate the trend as “strong sell.”
So at this moment, the bias is bearish to neutral, unless a reversal catalyst emerges.
🎯 Weekly Pivot / Key Levels (Support & Resistance)
Using the most recent weekly pivot analysis:
Level Price (Approx)
Weekly Pivot (central) ₹503.7
Support Zone 1 (S1) ~ ₹482.5
Support Zone 2 (S2) ~ ₹470.9
Resistance 1 (R1) ~ ₹515.3
Resistance 2 (R2) ~ ₹536.5
Resistance 3 (R3) ~ ₹548.0–₹550+
Interpretation
The pivot at ₹503.7 marks the “line of neutrality.” Weekly closes above this level would shift bias more bullish.
As of now, with price ~ ₹472–₹476, the stock is well below weekly pivot → bearish / consolidation regime.
Downside buffer / support lies around ₹470–₹482; a breakdown below that could open further downside risk (unless long‑term support zones hold).
Upside resistance cluster lies at ₹515 → ₹536 → ₹548. To regain bullish momentum, price needs to first clear ₹503–₹515 zone, then aim higher.
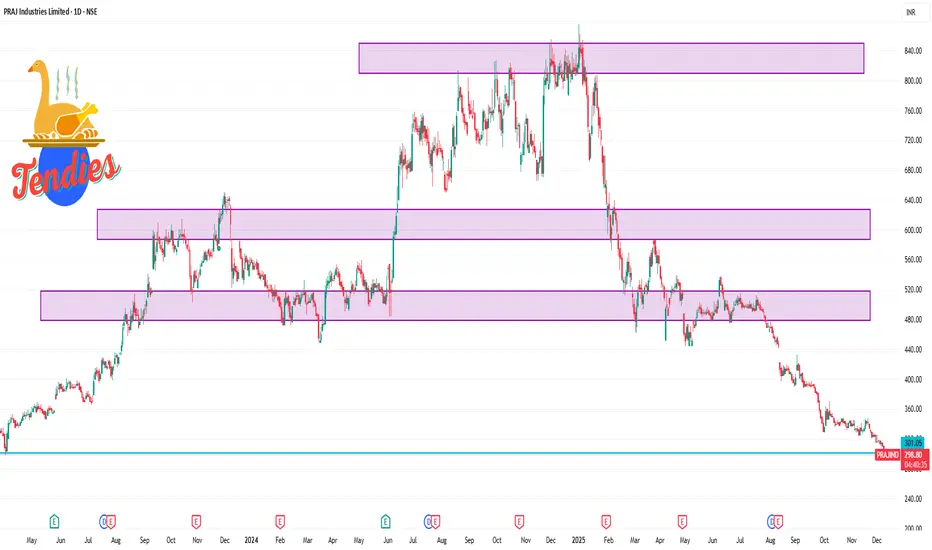
PRAJIND 1 Day Time Frame 📌 Current Live Price & Trend
✅ PRAJIND is trading around ₹300–₹302 on the NSE today (down ~2–3%).
✅ The stock recently hit a new 52-week low, showing a strong bearish trend and weakness.
Market Context (Short-Term Trend):
Price is trading below key moving averages (5D, 20D, 50D, etc.).
This suggests bearish pressure on the 1-day and short-term charts.
📊 1-Day Intraday Levels (Approximate)
🟥 Resistance (Upside Barriers):
R1: ~₹308 – initial resistance near short-term bounce area
R2: ~₹315 – psychological resistance zone
R3: ~₹322 – higher resistance from recent intra-week levels
🟩 Support (Downside Levels):
S1: ~₹297 – immediate intraday support
S2: ~₹290 – lower support from recent swing lows
S3: ~₹280 – significant downside support zone
KAYNES 1 Day Time Frame 📉 Current Price & Recent Context
Current (latest) price is around ₹ 4,132 – ₹ 4,141.
On 8 Dec, the stock’s intraday high was ~ ₹ 4,531.15, and intraday low ~ ₹ 4,125.55.
The 52‑week range remains ₹ 3,825.15 (low) to ₹ 7,822.00 (high).
🔎 Key Short‑Term Support & Resistance Zones
Based on intraday price action, pivot–point analysis (as per publicly available technical data) and recent trading range:
Support Zone (near‑term): ~ ₹ 4,120 – ₹ 4,130 (the intraday low touched ~ ₹ 4,125.55)
Lower Support (next): ~ ₹ 3,825 – ₹ 3,900 (near 52‑week low)
Resistance / Pivot Zone: ~ ₹ 4,770 – ₹ 4,950 (near intraday high + recent day’s upper range)
Higher Resistance Zone (if market recovers strongly): ~ ₹ 5,200–₹ 5,400+ (but note: much of this is well above current range — would require strong bullish breakout)
Interpretation (near‑term):
The ₹ 4,120–₹ 4,130 level is a critical short‑term support — a breakdown below this could test the 52‑week‑low zone near ₹ 3,825–₹ 3,900.
On the upside, the first hurdle is near ₹ 4,770–₹ 4,950. Clearing that convincingly could open up a move toward the ₹ 5,200–₹ 5,400 area — but given current bearish pressure, that seems a medium‑term scenario only.

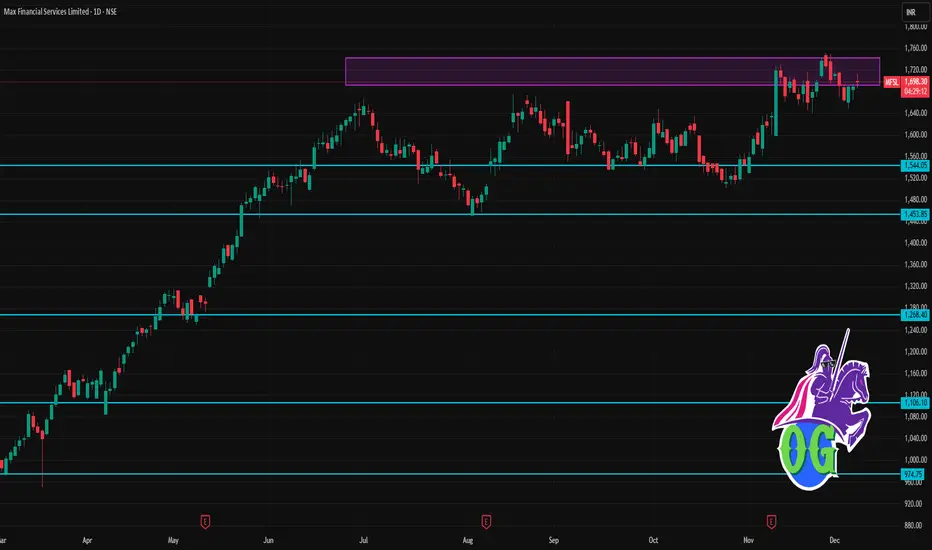
MFSL 1 Day Time Frame 📌 Current status
Latest quote for MFSL is ≈ ₹1,690.20.
52‑week range: Low ~ ₹950 — High ~ ₹1,751.40.
According to one technical‑analysis provider, the short‑term/mid‑term/long‑term bias remains bullish, though price is currently a few percent below recent resistance.
🎯 What this implies (on 1‑day timeframe)
As long as MFSL stays above S1 (~₹1,670), the short‑term trend remains stable; dips toward S2/S3 (~₹1,646 / ₹1,622) could offer re‑entry opportunities if price action stabilizes.
A breakout above R1 (~₹1,716–1,737) and sustained move toward R2 (~₹1,740–1,764) could open up upside potential toward R3 (~₹1,764–1,794).
If price falls below S2/S3, risk of a deeper correction rises — possibly pulling back toward lower support zones or consolidating.
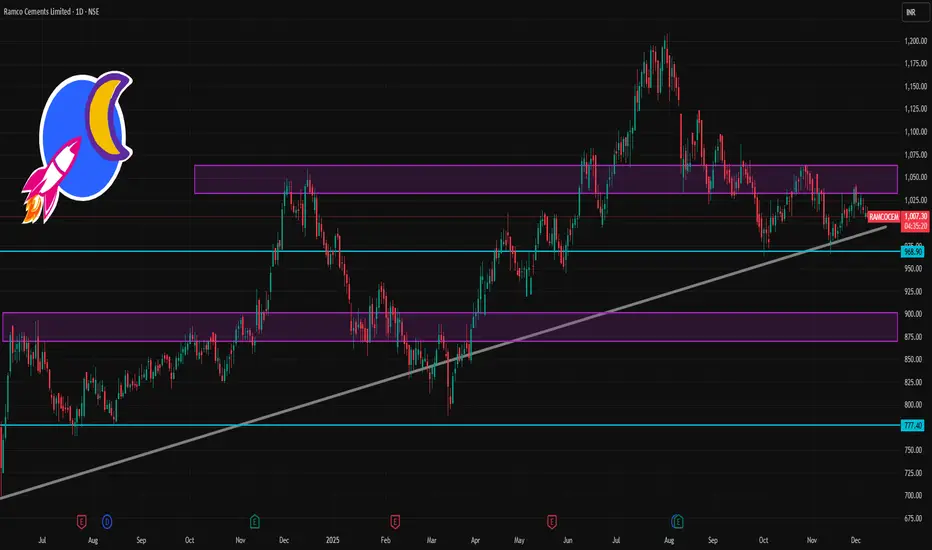
RAMCOCEM 1 Day Time Frame 📌 Current Price (Approx)
₹1007–₹1011 range on NSE during today’s session. Live market shows price around this zone (previous close ~₹1,011).
📊 Daily Pivot & Support/Resistance Levels (Updated)
(from reliable intraday pivot data)
Daily Pivot Zone
Central Pivot Point (CPR): ~₹1,011.4–₹1,011.8 (key equilibrium level)
Resistance Levels
R1: ~ ₹1,019
R2: ~ ₹1,027
R3: ~ ₹1,034–₹1,035
(above these levels can imply stronger upside if sustained)
Support Levels
S1: ~ ₹1,011–₹1,003
S2: ~ ₹996–₹992
S3: ~ ₹988–₹980
(broken support zones may accelerate downside)
✅ Key ODI pivots (Standard daily):
S1 ~ ₹1003.7
Pivot ~ ₹1019.1
R1 ~ ₹1027.3 (minor breakout level)
TATASTEEL 1 Day Time Frame 📌 Current status
Price is hovering around ₹166–167.
52‑week range: low ≈ ₹122.6, high ≈ ₹186.9.
✅ What This Means for Near‑Term Trading / Observation
As of now, the stock is in a neutral / consolidation phase — price sitting between support (~ ₹165) and resistance (~ ₹170–172).
A break below ~ ₹165 might open path toward ~₹163–164, or lower, depending on volume and market sentiment.
A break above ~ ₹170–172 — especially on good volume — could trigger upward movement toward ~₹180+ zones (with key watch on 52‑wk highs around ₹185–187).
Because we are closer to middle of the 52‑wk range rather than extremes, price volatility remains possible — so risk management (stop‑loss, position sizing) matters.

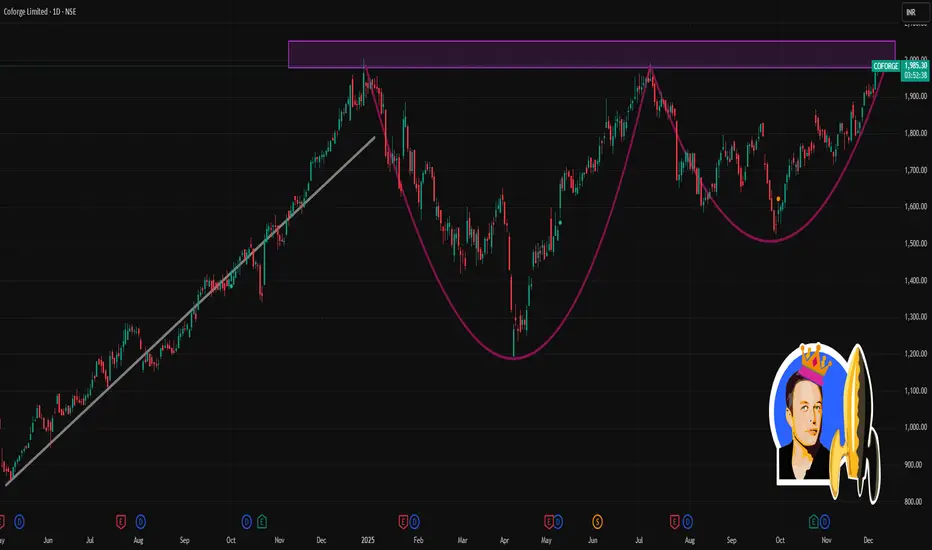
COFORGE 1 Day Time Frame 📈 Current Price & Range (as on recent close)
Last traded price: ~ ₹1,966.20
Day’s low–high: ~ ₹1,917.80 – ₹1,986.00
🧭 Key Moving‑Average & Technical Context
On daily chart, short‑ and medium‑term SMAs/EMAs (5‑, 10‑, 20‑, 50‑, 100‑, 200‑day) are all in “outperform” configuration — indicating bullish bias.
Other indicators on daily chart — RSI, MACD, Stochastic, ROC, CCI etc — are also showing strength (many in “outperform” zone).
⚠️ What to Monitor / What Can Happen
If Coforge breaks above ~₹1,986 with good volume — could extend higher, possibly retesting upper ranges near ₹2,000 (52‑week highs ~₹2,005).
If price falls below ~₹1,915 and fails to hold, next support zones around ~₹1,900 — and if that breaks, ~₹1,840‑₹1,850 becomes the important cushion.
Given strong moving‑average alignment plus bullish oscillator values, trend bias remains upward — but day‑to‑day volatility can still cause swings, so intraday trades should use tight stop‑loss.
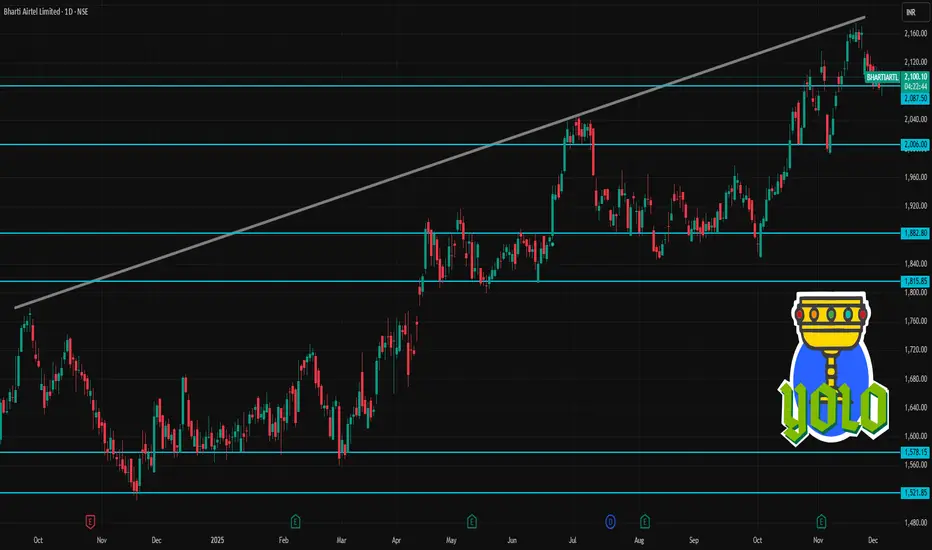
BHARTIARTL 1 Day Time Frame 📊 Current status
The latest price is about ₹ 2,103.8 (NSE/BSE) for Bharti Airtel.
Day’s trading range so far: roughly ₹ 2,090.00 – ₹ 2,106.10.
52‑week range: Low ≈ ₹ 1,559.50, High ≈ ₹ 2,174.50.
⚠️ What to watch out for / risk factors (intraday/trade‑view)
The stock has recently rallied a lot (52‑wk high not far behind), so upside may be limited unless there’s strong buying — there might be profit‑booking or consolidation.
Short‑term volatility could be high; intraday ranges are fairly wide.
External factors — broader index movements (Nifty / Sensex), sector sentiment, broader telecom/market news — could sway direction more than technicals.
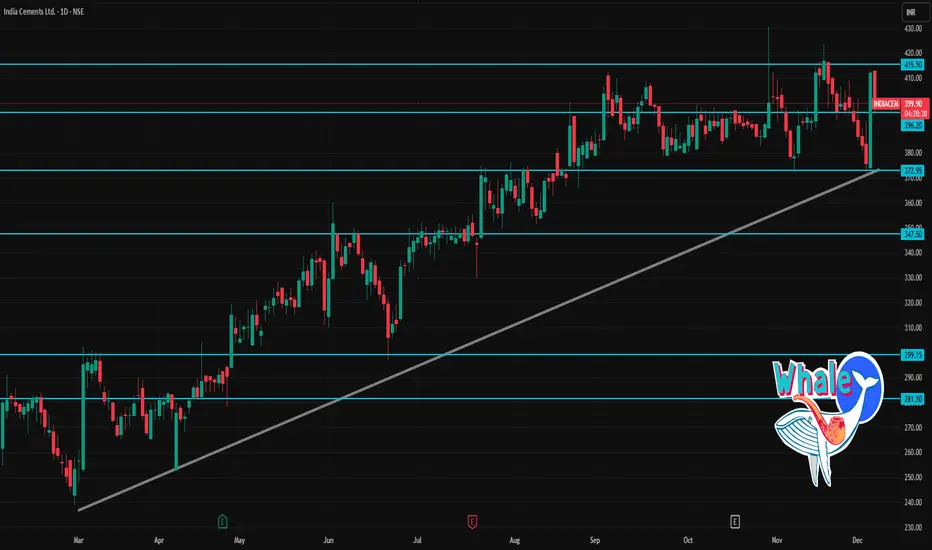
INDIACEM 1 Day Time Frame 📈 Key Recent Data & Context
Recent closing price was ~ ₹412.15, with VWAP ~ ₹402.10. That means price closed above VWAP — often seen as a short-term bullish signal.
The stock has experienced a significant volume spike recently (much higher than its 2-week average), which may suggest stronger conviction in current move.
According to one daily technical indicator set, the stock shows “neutral to slightly bullish” — RSI near mid-range, MACD modestly positive.
🔎 1-Day Pivot & Support / Resistance Levels
Using standard pivot-point calculations for INDIACEM:
Level Type Price (₹)
Daily Pivot 364.95
Support 1 (S1) 359.90
Support 2 (S2) 351.00
Support 3 (S3) 345.95
Resistance 1 (R1) 373.85
Resistance 2 (R2) 378.90
Resistance 3 (R3) 387.80
Interpretation:
If price retraces, the pivot ~ ₹365 may act as first “balancing” zone.
Key supports below are between ₹346–351 — failure below could weaken short-term bullishness.
Upside resistances from today’s pivot are ₹374 → ₹379 → ₹388 — crossing these may signal stronger bullish momentum for the day.
✅ My Trading-day “Game Plan” (Hypothetical)
If I were trading INDIACEM today (intraday or short-term):
Could consider a long entry if the stock sustains above ₹402–405, with stop-loss near ₹377–380 (just below R2/R3).
If price slips back and tests pivot ~ ₹365 or support ~ ₹350–355, that could be a buy-on-dip zone.
On the upside, a move beyond ₹388 could open up short-term upside toward ₹395–405 (given stock’s recent volatility).
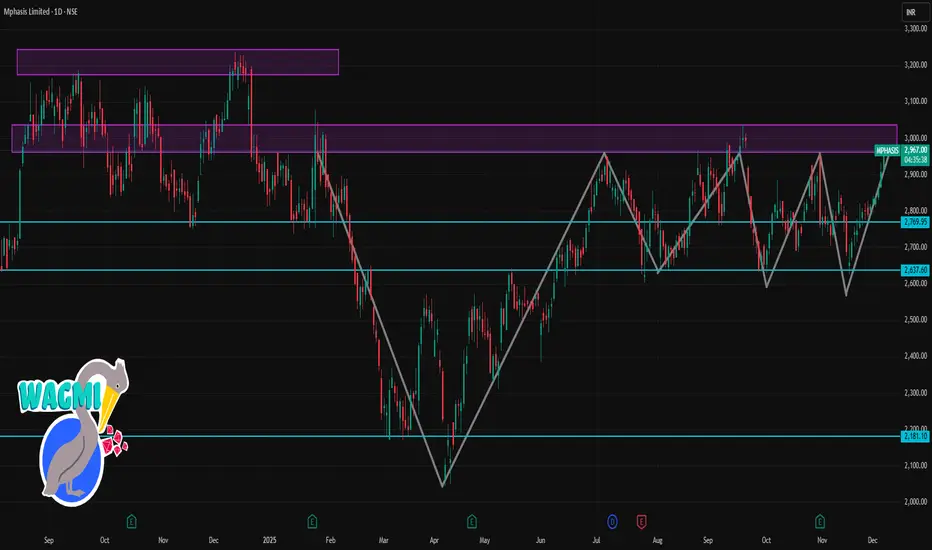
MPHASIS 1 Day Time Frame 📌 Key intraday / near-term levels & technicals
1. Current price (NSE) is around ₹2,908–₹2,927.
2. Day’s low ~ ₹2,865, day’s high ~ ₹2,933.
3. According to a recent “trade spotlight” technical view:
Immediate support near ₹2,800 (close to 20-day EMA).
Immediate resistance near ₹2,920. A clean breakout above this with volume might signal further upside.
If price dips below support zone (₹2,800), watch for weak momentum or a pullback.
4. Technical indicators (on daily chart) suggest a bullish / “buy” bias — moving averages (short and mid-term) are bullish.
5. According to one weekly-based analysis, key support/resistance zones for the week are: Support ~ ₹2,766.40, major support ~ ₹2,721.40; Resistance ~ ₹2,841.70, next resistance ~ ₹2,872.00.
✅ What this means for 1-day / short-term trading
If Mphasis stays above ~₹2,900 and breaks clearly above ~₹2,920 with volume → could test higher intraday levels or even aim for a swing up.
On a dip, watch ₹2,800 as first buffer/support; a drop below this might open possibility of larger retracement.
Given bullish structure, intraday bounce or continuation is likely if broader market supports IT/sector strength.
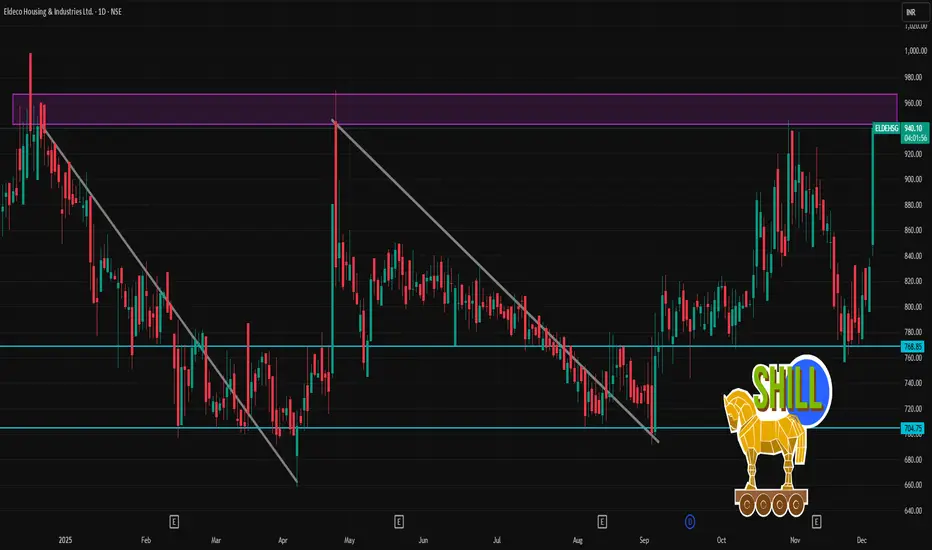
ELDEHSG 1 Day Time Frame 📈 Key Recent Price & Stats
According to a recent quote, ELDEHSG traded around ₹ 940.00 during a session where it jumped ~13% on the day.
52‑week range: ₹ 658.10 (low) — ₹ 998.90 (high).
VWAP for the day (on one snapshot) was ~₹ 924.48.
⚠️ What to Watch Out For / Consider
The stock appears volatile: large swings (e.g. from ~₹ 800s to ~₹ 940 in a day) — intraday volumes and momentum matter.
The valuation is relatively high (P/E ratio is elevated; book value vs price indicates premium).
Given volatility and wide 52‑week range, risk of sharp retracement — if market sentiment or sectoral/regulatory triggers change — remains.
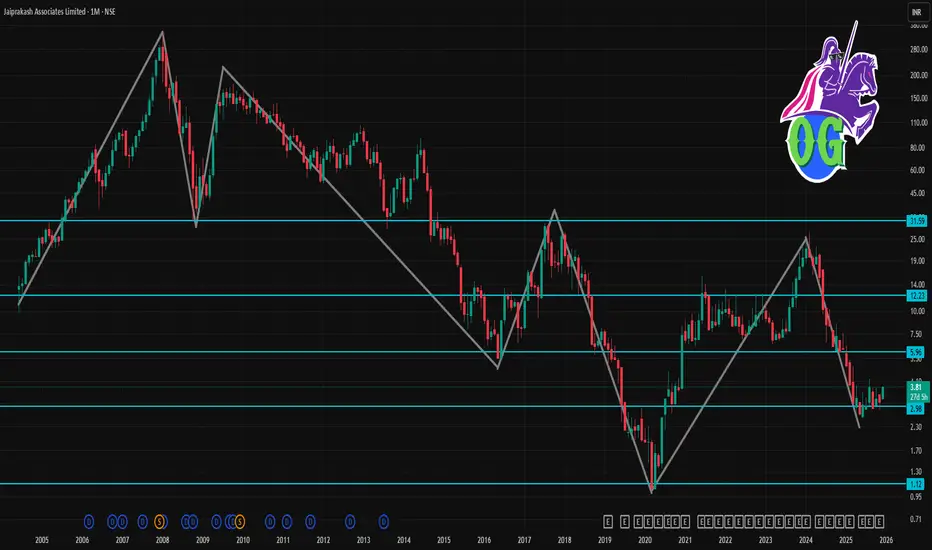
JPASSOCIAT 1 Month Time Frame 🔎 Current snapshot
Recent price (early Dec 2025): ~ ₹ 3.60–₹ 3.81.
52-week high / low: ~ ₹ 7.57 / ₹ 2.56.
Company remains under resolution/insolvency proceedings. Its balance sheet, according to data, shows negative book value and poor earnings metrics over recent years.
Because of this, the stock is highly volatile and speculative. Analysts have repeatedly flagged that such small-cap, distressed companies are “easy to enter but difficult to exit.”
🎯 My view (1-month horizon)
Given high uncertainty, best to treat this as a speculative trade rather than a “safe bet.”
Short-term upside is possible if there is news on resolution/acquisition or better-than-expected restructuring.
But downside risk remains high — if negative developments emerge, the stock may slip back.
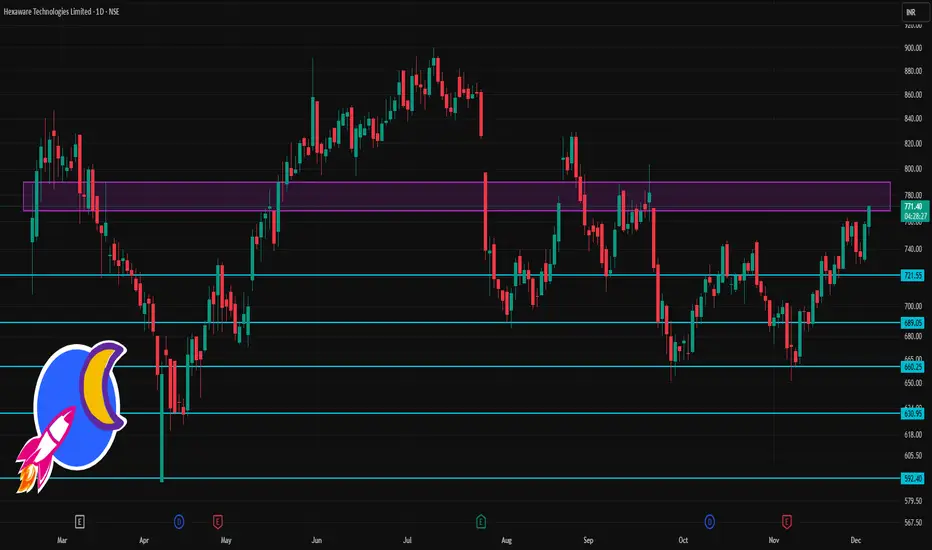
HEXT 1 Day Time Frame 🔎 Current Context & Price
Latest price: ~ ₹770–771.
Day’s trading range seen: roughly ₹750–772.
52-week range: ₹590.30 (low) – ₹900 (high).
⚠️ What to Watch / Risk Zones
If price falls below ~₹745–750 (support zone), risk of more significant slip toward ₹738–740.
Resistance around ₹775–785 could trigger profit-taking or consolidation — strength of buying volume matters.
As with all mid-cap IT stocks, macro factors (global demand, forex, sector sentiment) may override technicals.
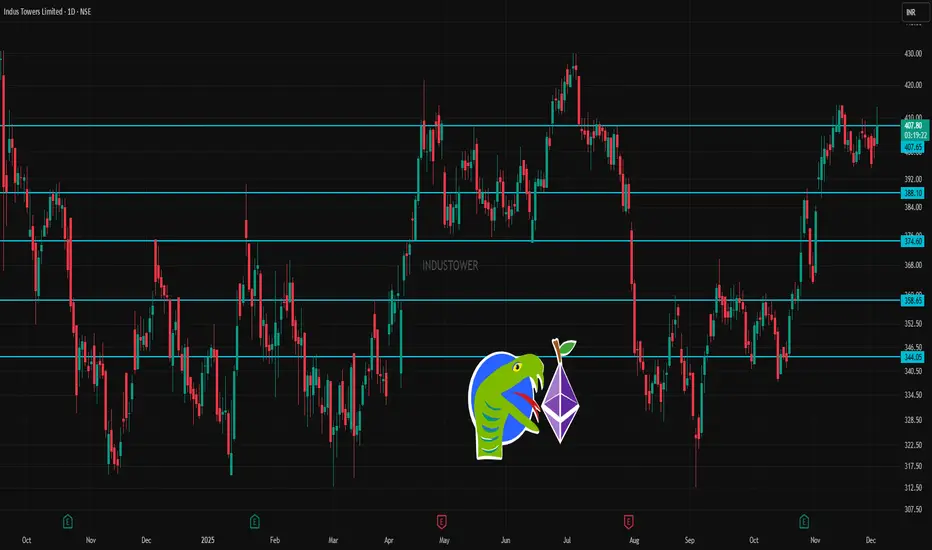
INDUSTOWER 1 Day Time Frame 📌 Key Data & Trend Context
Recent price: around ₹ 404 (or in the ~₹ 401–409 range depending on source/time).
52‑week range: Low ≈ ₹ 312.55, High ≈ ₹ 430.00.
According to moving averages (short‑, mid‑ & long‑term), trend is marked “outperform” / bullish.
✅ What This Suggests (in 1‑day / Short-Term Context)
As long as price holds above ₹ 388–392, the near‑term trend remains stable / bullish.
A close above ₹ 405–408 on decent volume may signal a bullish breakout — could push toward ₹ 424–438 range.
On a drop below ₹ 338–346, the stock could weaken significantly — suggesting caution or a bearish tilt.
Given moving averages (short + mid + long) are in bullish alignment, intermediate‑term bias remains positive.
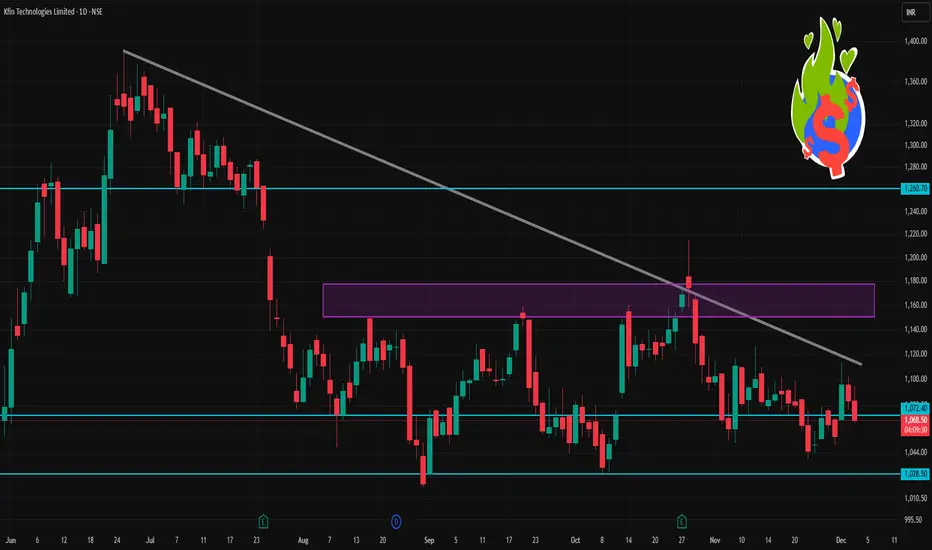
KFINTECH 1 Day Time Frame 📊 Current Snapshot (as of right now)
Reported day’s trading‑range so far: ~ ₹ 1,066.70 (low) to ~ ₹ 1,095.00 (high)
Opening price: ~ ₹ 1,083.80
Previous close: ~ ₹ 1,083.40
Market‑wide context: 52‑week high ~ ₹ 1,641.35, 52‑week low ~ ₹ 784.15
📌 Key Intraday / Short‑Term Levels (Classic Pivot‑Style)
Using the standard pivot‑point formula (Pivot = (High + Low + Close)/3) plus support/resistance calculations.
Here’s what that yields roughly for today — with High = 1,095.00, Low = 1,066.70, Close (yesterday) ≈ 1,083.40:
Level Approximate Price (₹)
Pivot (PP) ~ 1,081.70
Support 1 (S1) ~ 1,068.40
Support 2 (S2) ~ 1,050.40
Resistance 1 (R1) ~ 1,108.90
Resistance 2 (R2) ~ 1,131.00
Interpretation:
If the price stays above PP (~1,082) — bullish bias; otherwise, cautious/bearish.
S1 (~1,068) may act as “first floor”: if price drops near there and holds, watch for bounce.
A break below S2 (~1,050) might lead to deeper correction or volatility.
On upside, a strong move above R1 (~1,109) could challenge R2 (~1,131).
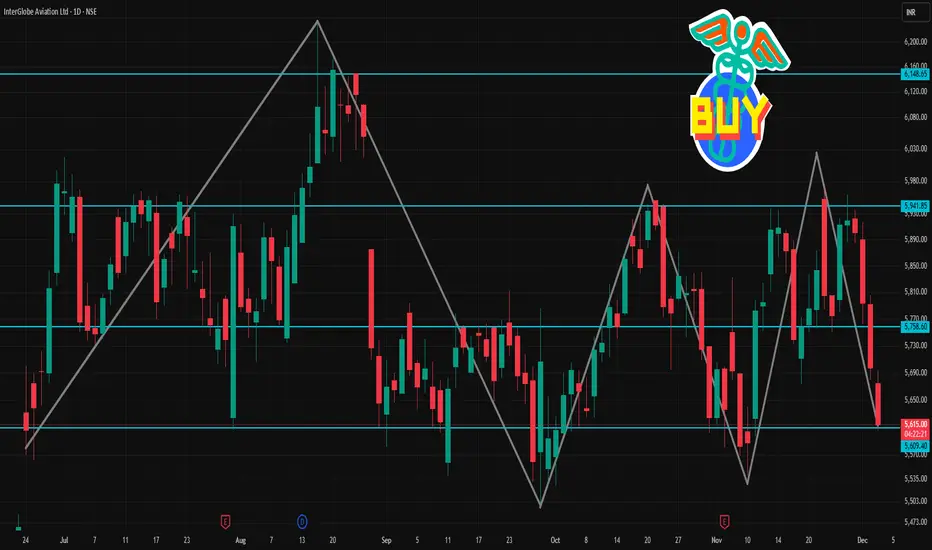
INDIGO 1 Day Time Frame 📌 Latest Price Snapshot & Context
On a recent trading day, the stock’s day’s range was ~ ₹ 5,626 – ₹ 5,694.
The 52-week range remains ₹ 3,945 – ₹ 6,232.50.
Recent closing / quoted prices have been around ₹ 5,900 – ₹ 5,913 (though there are multiple sources — price may fluctuate intraday).
🔄 Daily Pivot & Key Intraday Levels (Standard + Camarilla/Fibonacci from a common pivot-level table)
From a recent pivot-level analysis for “daily” timeframe:
Level Type / Label Price (Approx, ₹)
Pivot (standard daily) ₹ 5,672.33
Support 1 (S1) ₹ 5,634.67
Support 2 (S2) ₹ 5,599.33
Support 3 (S3) ₹ 5,561.67
Resistance 1 (R1) ₹ 5,707.67
Resistance 2 (R2) ₹ 5,745.33
Resistance 3 (R3) ₹ 5,780.67
For “Camarilla” variant on same day: pivot also ₹ 5,672.33, with S- and R- levels slightly tighter: e.g. S1 around ₹ 5,663, R1 around ₹ 5,677.
Some alternate analyses cite supports around ₹ 5,733 / ₹ 5,671 / ~₹ 5,579, and resistances ~ ₹ 5,804 / ₹ 5,832 / ~₹ 5,978 depending on timeframe/ method.