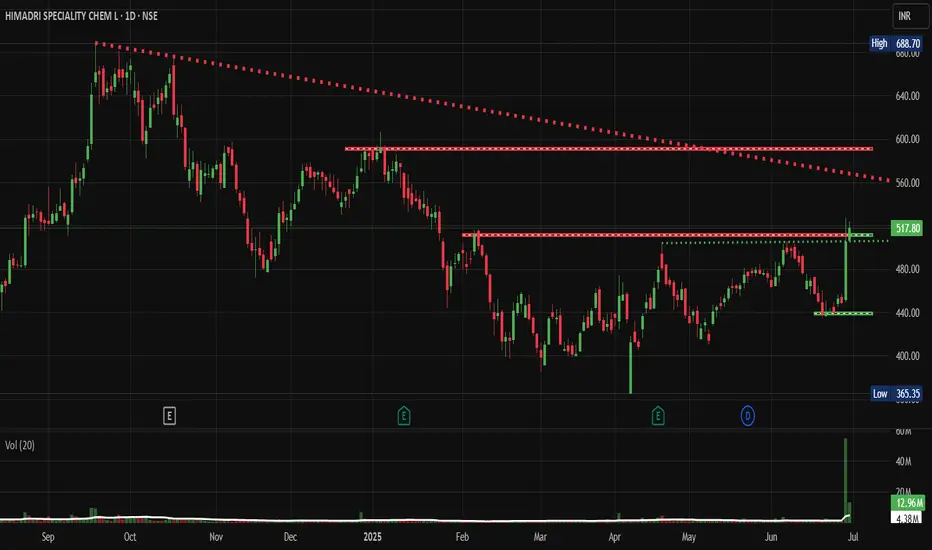
HSCL: A Classic Breakout Story in the MakingNSE:HSCL : A Classic Breakout Story in the Making
Price Action Analysis:
- Stock has formed a strong uptrend from September 2024 lows around 365 levels
- Current price of 517.80 represents a significant +41% move from the base
- Recent breakout above the 500 resistance level with strong volume confirmation
- Price action shows a classic accumulation pattern followed by a markup phase
Volume Spread Analysis:
- Significant volume spike visible in recent sessions (12.96M vs average 4.38M)
- Volume confirmation during breakout above 500 levels
- Accumulation pattern evident with higher volume on up days
- Volume trend supports the bullish price action
Base Formation & Key Levels:
- Primary Base: Formed between 400-520 levels from December 2024 to May 2025
- Secondary Base: 440-480 consolidation zone during March-April 2025
- Base Duration: Approximately 6 months of sideways consolidation
- Base Characteristics: Multiple retests of support levels with decreasing volatility
Key Support & Resistance Levels:
- Immediate Support: 480-500 zone (previous resistance turned support)
- Strong Support: 440-460 zone (multiple bounce levels)
- Major Support: 400 psychological level
- Immediate Resistance: 520-530 zone
- Next Resistance: 580-600 zone (measured move target)
- All-time High Resistance: 688.70
Technical Chart Patterns:
- Cup and Handle Pattern: Visible from October 2024 to June 2025
- Ascending Triangle: Formed during the consolidation phase
- Bullish Flag: Recent consolidation before the breakout
- Higher Highs and Higher Lows: Established uptrend structure
Trade Setup & Strategy:
Entry Strategy:
- Primary Entry: 515-520 on any pullback to the breakout zone
- Aggressive Entry: Current levels around 517-518
- Conservative Entry: Wait for retest of the 500 support level
- Scale-in Approach: 50% at 515, 30% at 505, 20% at 495
Exit Strategy:
- Target 1: 560-570 (Risk-Reward 1:2)
- Target 2: 600-620 (Risk-Reward 1:3)
- Target 3: 650-680 (Risk-Reward 1:4)
- Trailing Stop: Use 480 as a trailing stop once Target 1 is achieved
Risk Management:
- Stop Loss: 475-480 (below breakout support)
- Position Size: Maximum 2-3% of portfolio
- Risk per Trade: Not more than 1% of total capital
- Time Stop: Exit if no progress in 3-4 weeks
Position Sizing Guidelines:
- Conservative Investor: 1-1.5% portfolio allocation
- Moderate Risk: 2-2.5% portfolio allocation
- Aggressive Trader: 3-4% portfolio allocation (with tight stops)
- Swing Trading: 2% with wider stops at 460 levels
Fundamental & Sectoral Backdrop:
Company Overview:
- NSE:HSCL is a leading manufacturer of coal tar pitch and advanced carbon materials
- Key products include coal tar pitch, carbon black feedstock, and speciality carbons
- Strong presence in aluminium, graphite electrode, and speciality chemical sectors
Sectoral Dynamics:
- The speciality chemicals sector is showing strong growth momentum
- Increased demand from the aluminium and steel industries
- The government focus on Make in India and import substitution
- Rising demand for advanced materials in electric vehicles and renewable energy
Fundamental Catalysts:
- Capacity expansion plans and new product launches
- Strong demand from end-user industries
- Improved margin profile due to product mix optimization
- Debt reduction and improved financial metrics
- ESG initiatives and sustainable product development
Market Conditions:
- Overall market sentiment is positive for chemical stocks
- Sectoral rotation favours speciality chemicals
- Export opportunities in global markets
- Raw material cost stabilization supporting margins
Risk Factors:
Technical Risks:
- Failure to sustain above 500 levels could lead to a retest of the 440 support level
- High volatility is expected given the breakout nature
- Overbought conditions in the short term may cause profit booking
Fundamental Risks:
- Raw material price volatility (coal tar and petroleum products)
- Environmental regulations affecting production
- Competition from global players
- Economic slowdown affecting end-user demand
- Currency fluctuation impact on exports/imports
My Take:
My analysis suggests a positive technical setup with strong breakout potential, supported by favourable sectoral trends and improving fundamentals. However, proper risk management and position sizing remain crucial for successful execution.
Keep in the Watchlist.
NO RECO. For Buy/Sell.
📌Thank you for exploring my idea! I hope you found it valuable.
🙏FOLLOW for more
👍BOOST if you found it useful.
✍️COMMENT below with your views.
Meanwhile, check out my other stock ideas on the right side until this trade is activated. I would love your feedback.
Disclaimer: "I am not a SEBI REGISTERED RESEARCH ANALYST AND INVESTMENT ADVISER."
This analysis is intended solely for informational and educational purposes and should not be interpreted as financial advice. It is advisable to consult a qualified financial advisor or conduct thorough research before making investment decisions.
Cupandhandlepattern
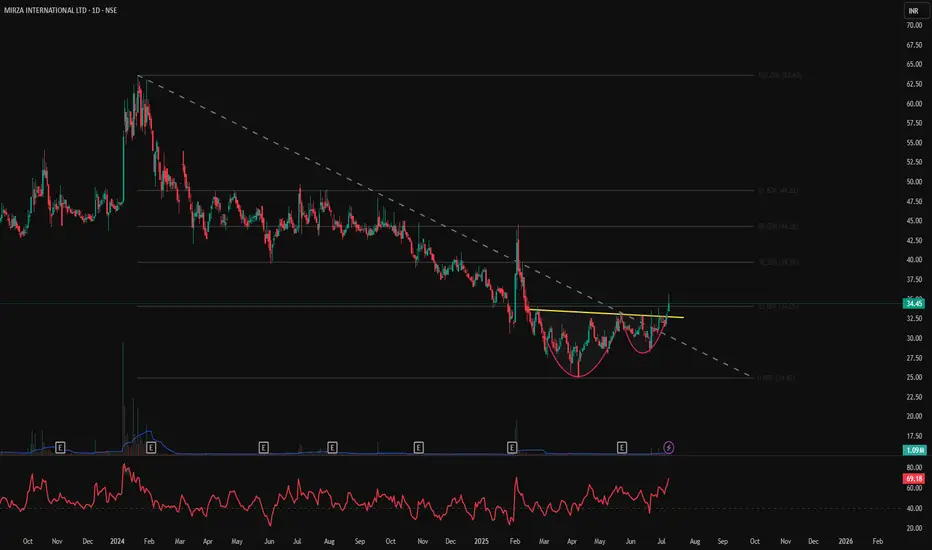
MIRZAINT – Cup & Handle Breakout | Daily Chart📊 MIRZAINT – Cup & Handle Breakout from Order Block | RVol 349% | RSI Near Overbought | Daily Chart
📅 Chart Date: July 8, 2025
📍 CMP: ₹34.45 (+4.71%)
📈 Symbol: NSE:MIRZAINT
🔍 Technical Analysis Breakdown
☕ Cup & Handle Breakout
Classic Cup & Handle pattern breakout above neckline resistance at ~₹33.
Smooth rounding bottom base followed by tight consolidation and bullish breakout.
🟥 Volumized Order Block (OB) Analysis
Previous Supply Zone: Between ₹41–₹49.5.
Demand Zone: ~₹24–₹26, previously respected.
Breakout occurred from a fresh bullish 1D OB .
📈 Relative Volume (RVol%): 349%
Significant volume spike confirms strong buying interest behind the breakout.
📐 Measured OB Data
1.542M (44%) red OB supply previously pushed price down.
Bullish OB of 795.893K (18%) supported accumulation phase pre-breakout.
📊 RSI (14, close): 69.18
Approaching overbought zone (>70), confirming strong trend but may see minor consolidation.
🏁 Key Technical Levels
Breakout Level (Neckline): ₹33.00
CMP: ₹34.45
Resistance Ahead: ₹41.00 → ₹49.50 (previous OB supply zone)
Support: ₹30.00 / ₹26.00 (OB base)
💡 Trade Setup Insight
Entry: CMP on breakout or retest near ₹33
Target 1: ₹41
Target 2: ₹49+
Stoploss: Below ₹30 or ₹26 (OB base zone)
Risk Profile: Moderate to Aggressive
⚠️ Disclaimer: This is an educational chart setup and not trading advice. Please conduct your own research and risk management.
📣 Follow @PriceAction_Pulse for more such clean breakouts and chart pattern analysis!
🔁 Drop a comment if TFCILTD is on your radar for the next breakout rally 📈
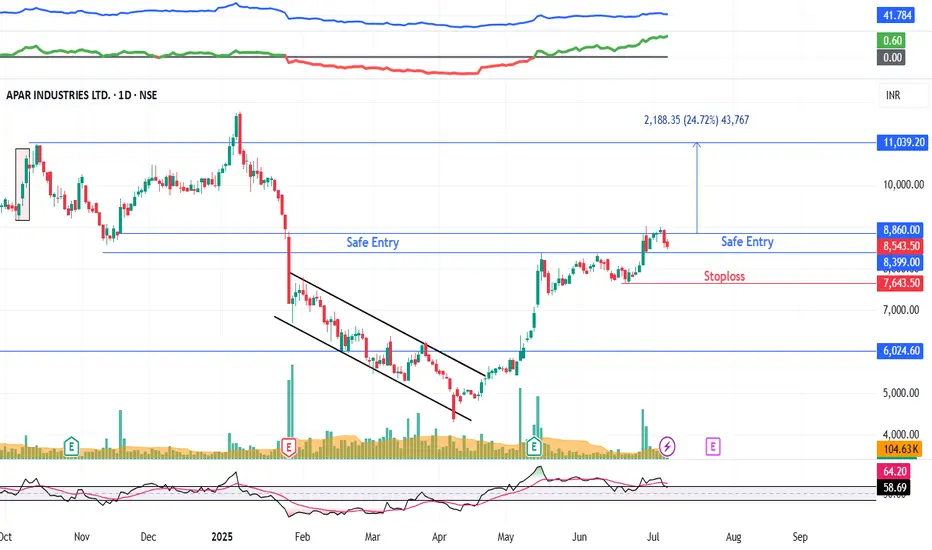
APARINDS : Stage 3 Candidate#APARINDS #stage3 #swingtrade #breakoutstock #trendingstock #patternbreakout
APARINDS : Swing trade
>> Stock in stage3
>> Breakout Candidate
>> Cup & Handle pattern
>> Good strength in Stock
>> Good Recent Buildup
>> Risk Reward Favorable
Swing Traders can lock profit at 10% and keep Trailing
Please Boost, comment and follow us for more Learnings.
Disc : Charts shared are for learning purpose only, not a Trade recommendation. Do your own research and consult your financial advisor before taking any position.
SPICEJET - CUP & Handle FormationSpiceJet
CMP: 77
SL: 45 (Monthly Closing Basis)
Target: 108 / 130 / 155
Note: Fundamentally business is not doing great this is purely on the basis of Technical view.
Previous Cup & Handle patterns
1.
2.
3.

TRANSRAILL : Breakout Stock (Swing Trading) #TRANSRAILL #breakoutstock #swingtrading #chartpattern #cupandhandlepattern #patternbreakout #patterntrading
TRANSRAILL : Swing Trading
>> Breakout Stock
>> Cup and Handle pattern
>> Breakout with Volume
>> Good Strength in Stock
>> Risk Reward Favorable
Swing Traders can lock profit at 10% and keep Trailing
Please Boost, comment and follow us for more Learnings
Disc : Charts shared are for learning purpose only, not a Trade recommendation. Do your own research and consult your financial advisor before taking any position.

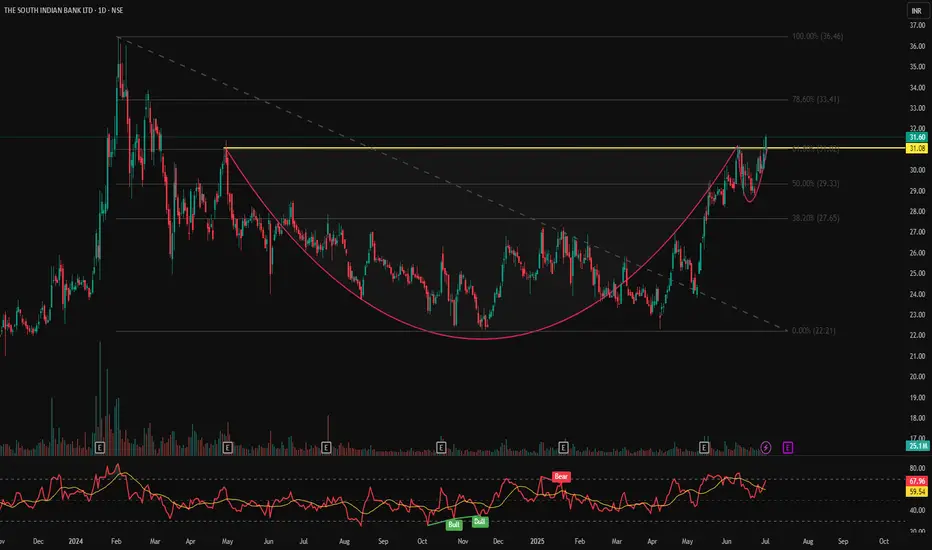
SOUTHBANK – Breakout From Cup & Handle | Daily Chart📊 SOUTHBANK – Breakout From Cup & Handle | RSI Bullish | High Volume | Fibonacci Levels | Daily Chart
📅 Chart Date: July 2, 2025
📍 CMP: ₹31.60 (+2.63%)
📈 Symbol: NSE:SOUTHBANK
🔍 Technical Breakdown
✅ Cup & Handle Breakout
A perfect cup & handle pattern breakout is visible
Price breaks out above the neckline at ₹31.08, which was a strong resistance zone
Breakout supported by rising volume (25.1M) adds conviction
📊 RSI Momentum
RSI (14) reading at 67.96 signals bullish strength, approaching overbought but not yet extreme
RSI crossover and previous bullish divergence helped initiate the move
📐 Fibonacci Retracement Levels (Swing: ₹22.21 to ₹36.46)
38.2% – ₹27.65
50.0% – ₹29.33
61.8% – ₹31.08 ✅ (Breakout zone)
78.6% – ₹33.41
100% – ₹36.46 🎯
🏁 Key Levels
Breakout Zone (Neckline): ₹31.08
CMP: ₹31.60
Resistance Levels: ₹33.41 → ₹36.46
Support Levels: ₹29.33 → ₹27.65
💡 Trade Idea
Entry: Above ₹31.10 on volume confirmation
SL: Below ₹29.30
Targets: ₹33.40 → ₹36.40+
Momentum + Breakout = High Conviction Setup
⚠️ Disclaimer
This analysis is for educational purposes only. Always do your own research and consult a registered advisor before investing.
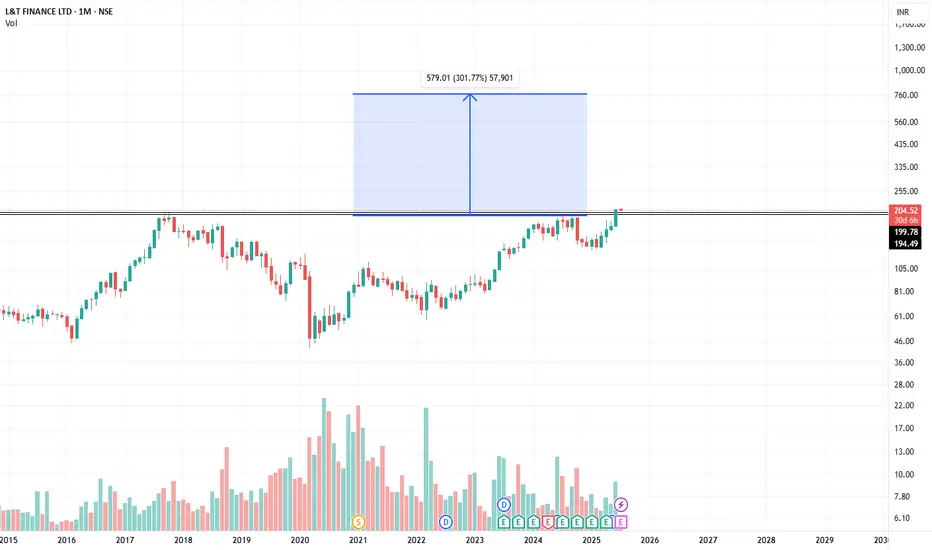
#LTF looking bullish on monthly timeframe#LTF has given a breakout at 200 on a monthly timeframe. Upside potential: 100%+. Stop loss: 184. A few things to note:
This stock will require immense patience as this could turn a multi-bagger
The volumes have been increasing over the last few months
This is not a buy/sell recommendation. Research carefully and invest at your own risk.
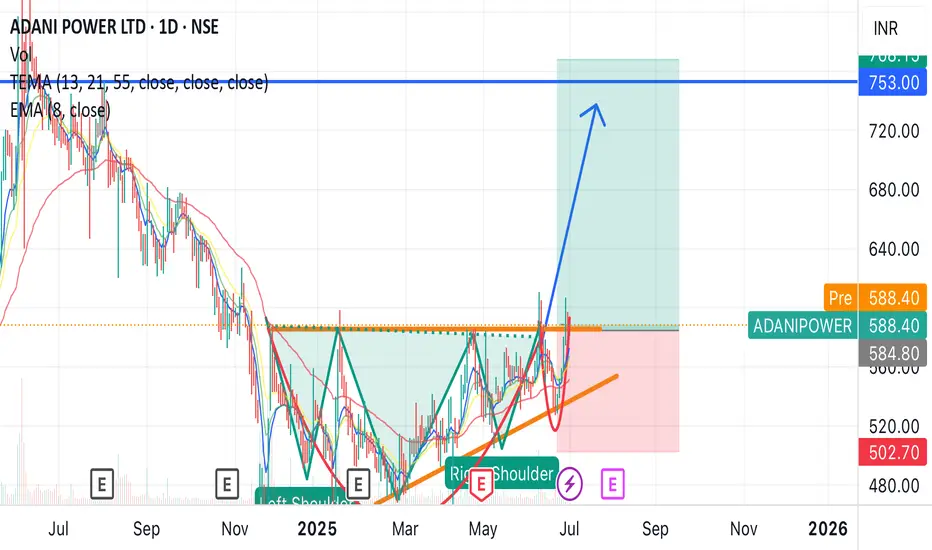
Adani power breakout anytime Adani power price hover just above resistance can give breakout anytime, earlier it was showing head and shoulder pattern and now changed into cup and handle pattern, also the support is also moving up.
Can expect a breakout anytime.
Entry around - 600
Target - 750
Duration 1-2 month
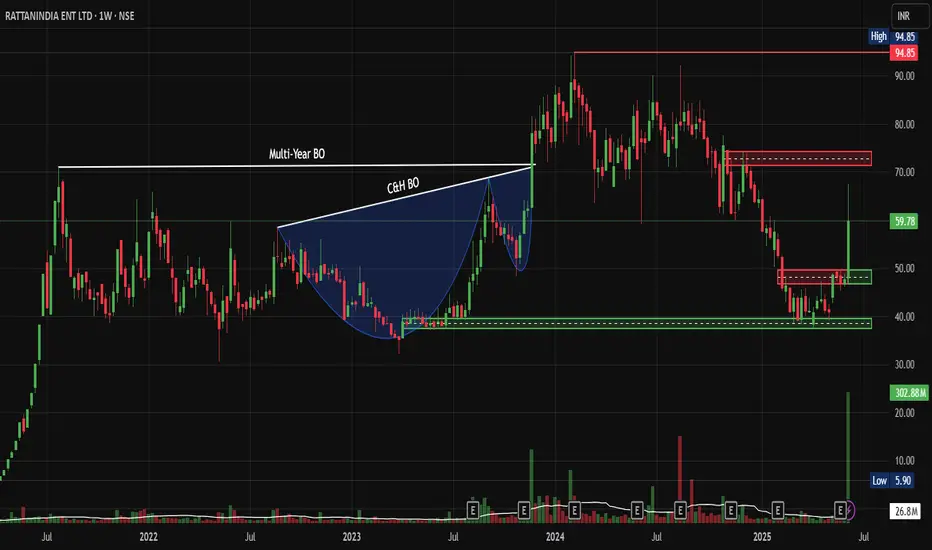
RattanIndia: Next New-Age Multi-Bagger Play ? Chart of the WeekWhy NSE:RTNINDIA Could Be Your Next Multi-Bagger Play, let's analyse my "Chart of the Week" Idea.
Price Action:
• Multiple base formations visible across the timeline from 2021-2025
• Classic cup and handle pattern formation during the 2023-2024 consolidation phase
• Rectangle consolidation pattern between ₹35-40 levels during Early 2025
• Strong breakout from multi-year resistance around the ₹75-80 zone
• Current pullback to retest breakout levels around the ₹47-50 range
Key Supports and Resistance Levels:
• Primary Support: ₹47-50 (previous resistance turned support)
• Secondary Support: ₹35-40 (rectangle pattern base)
• Major Support: ₹25-30 (long-term base level)
• Immediate Resistance: ₹65-70 (previous consolidation zone)
• Major Resistance: ₹75-80 (breakout level)
• Target Resistance: ₹94-95 (measured move projection)
Base Analysis:
• Stage 1 Base: ₹10-25 range from 2021-2022 (Accumulation phase)
• Stage 2 Base: ₹35-45 range during 2023-2024 (Re-accumulation)
• Current Base: ₹47-50 retest zone (Healthy pullback after breakout)
Volume Spread Analysis:
Volume Characteristics:
• Massive volume spike during recent breakout (300+ million shares)
• Above-average volume during consolidation phases
• Volume expansion on upward price movements
• Volume contraction during pullback phases indicates a healthy correction
• Volume profile shows strong institutional participation
Volume Patterns:
• Accumulation is visible during base formation periods
• Distribution avoided during recent highs
• Current pullback on lower volume suggests buying interest at support
Trade Setup:
Entry Strategy:
• Primary Entry: ₹48-50 (current support retest)
• Secondary Entry: ₹52-55 (breakout reconfirmation)
• Aggressive Entry: ₹45-47 (deeper pullback opportunity)
Exit Levels:
• Target 1: ₹65-70 (38% upside from ₹50)
• Target 2: ₹80-85 (65% upside from ₹50)
• Target 3: ₹95-100 (90% upside from ₹50)
Stop Loss Levels:
• Conservative: ₹42-43 (below rectangle support)
• Moderate: ₹45-46 (below recent lows)
• Tight: ₹47-48 (below immediate support)
Risk Management:
Position Sizing:
• Risk 1-2% of portfolio capital per trade
• Use a 2-3% position size for a conservative approach
• Maximum 5% allocation for aggressive traders
Risk-Reward Ratios:
• Entry at ₹50 with ₹45 stop: Risk-Reward of 1:3 to 1:9
• Entry at ₹52 with ₹47 stop: Risk-Reward of 1:2.6 to 1:8.6
Portfolio Allocation:
• Small-cap allocation: 10-15% maximum
• Individual stock limit: 2-5% of total portfolio
• Sector diversification recommended
Sectoral and Fundamental Backdrop:
Business Overview:
• NSE:RTNINDIA comprises of tech-focused new age businesses, including e-commerce, electric vehicles, and drones
• The company is completely focused on providing world-class electric mobility products that are affordable and accessible to every Indian
• Multi-business model spanning fintech, e-commerce, and drone technology
Sector Dynamics:
• The electric vehicle sector is experiencing government policy support
• The e-commerce segment is benefiting from the Digital India initiatives
• Drone technology is gaining traction in commercial applications
• Tech-focused businesses aligned with India's digital transformation
Financial Highlights:
• Market cap of RattanIndia Enterprises Ltd stood at Rs. 8,263 Cr
• RattanIndia Enterprises Ltd's net Sales rose by 22% since the same period last year to ₹ 6,866 Cr in the FY2025
• The company is in a growth investment phase with expanding business verticals.
Investment Thesis:
• Diversified exposure to high-growth sectors
• Potential beneficiary of India's transition to electric mobility
• Strong technical setup after multi-year base formation
• Early-stage company with significant scaling potential ahead
Risk Factors:
Technical Risks:
• Small-cap volatility and liquidity concerns
• Dependence on broader market sentiment
• Potential for gap-down moves in adverse conditions
Fundamental Risks:
• Current losses and cash burn in the growth phase
• Execution risk across multiple business verticals
• Competition in the electric vehicle and e-commerce segments
• Regulatory changes affecting drone and fintech operations
My Take:
This technical setup presents a compelling opportunity with the stock breaking out of a well-defined pattern, supported by decent enough fundamentals in the Growth Sectors of New Age Company and favourable sector dynamics. The risk-reward profile appears attractive for traders and investors willing to manage position size appropriately.
Keep in the Watchlist.
NO RECO. For Buy/Sell.
📌Thank you for exploring my idea! I hope you found it valuable.
🙏FOLLOW for more
👍BOOST if you found it useful.
✍️COMMENT below with your views.
Meanwhile, check out my other stock ideas on the right side until this trade is activated. I would love your feedback.
Disclaimer: "I am not a SEBI REGISTERED RESEARCH ANALYST AND INVESTMENT ADVISER."
This analysis is intended solely for informational and educational purposes and should not be interpreted as financial advice. It is advisable to consult a qualified financial advisor or conduct thorough research before making investment decisions.
Head and shoulder into cup and handle patternHudco turning head and shoulder pattern into cup and handle pattern price is near resistance and break anytime. This is a short term trade
Buy around - 230-240
Target - 340
Duration - 2-3 months

Tata steel cup Handle breakoutTata steel cup and handle breakout and the price is near resistance also with support coming close to the resistance suggesting possible breakout.
Buy around - 160
Target - 180 (13%)
Duration - 1 month
Tata steel have good fundamentals and showing breakout possibility

ISLAMIC NEW YEAR OR RATHYATRA PICKTechnical View
Stock is clearly formed Cup&Handle pattern. Privious major SR Line break. Pattern made near major SR line. complete reversal formation.
RESPONIND
CMP 219
TARGET 250/275/300+++
BUY ON DIPS NEAR 200-204
SL 190( DAILY CLOSING BASIS)
Fundamental View
ROE and ROE BOTH ARE GOOD. Quaterly and Yearly boh Revenue and PAT are Highest Ever. positive cashflow..
I Am Not SEBI Registered Research Analyst. It Is Giving Only Educational Purpose. Buying in RESPONIND After Discussing With Your Financial Advisor.

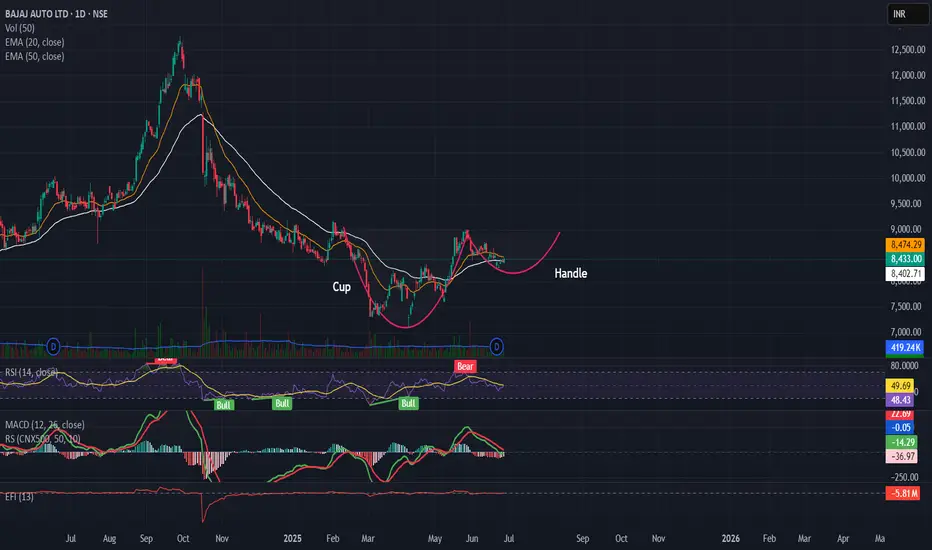
Cup and Handle Pattern in the makingAfter a 9 month long downtrend Bajaj Auto shows signs of reversal with a Cup and Handle pattern in the making with neckline breakout level at 9000
The stock trading close to the 20 and 50 EMA
RSI closing 50
MACD begins to stabalize
Target 11000
stoploss 8250
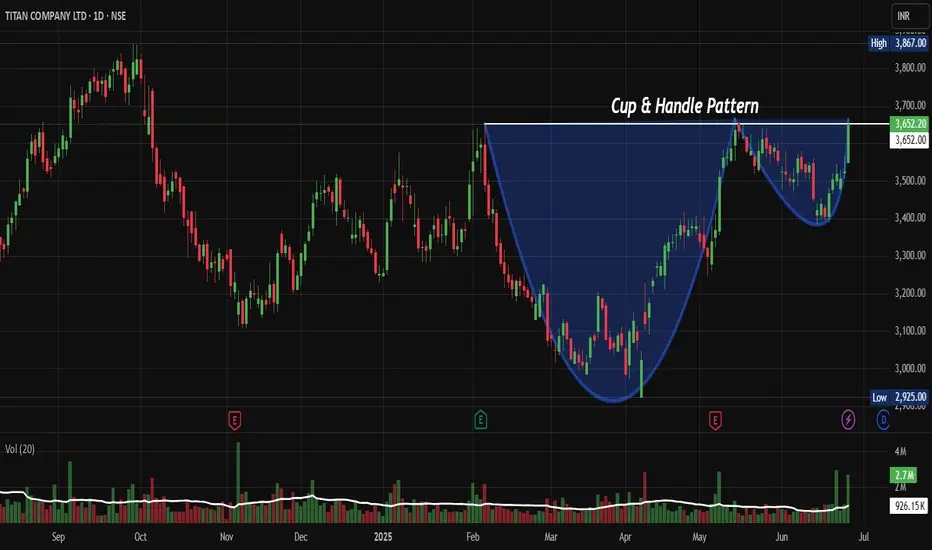
Titan - Keep On WatchCMP 3652 on 26.06.25
The chart itself is self-explanatory. The price has formed a Cup & Handle-like pattern since February 2025. This time, it is reaching the breakout levels.
MACD shows a likely reversal, too.
If it breaks out, it may go bullish to reach the levels of 3850, 4050, and potentially higher, depending on the market conditions.
In case of any correction, support levels are around 3510.
One may plan entry on different levels while considering risk management and position size.
All these illustrations are only for learning and sharing purposes; it is not buy or sell advice. Please do your research before taking any trade.
All the best.

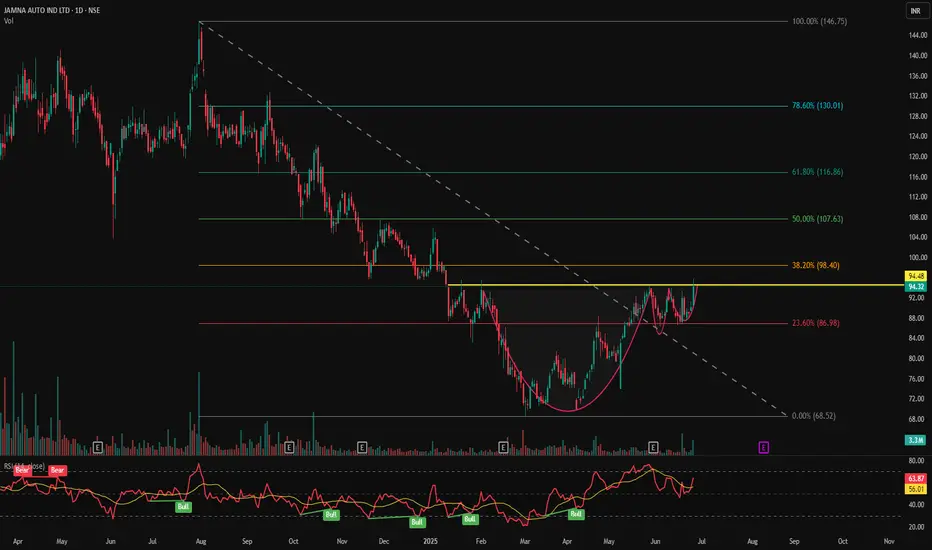
JAMNAAUTO - VCP Pattern Near Breakout📊 JAMNA AUTO (JAMNAAUTO) – VCP Pattern Near Breakout | RSI Momentum | Volume Surge | Daily Chart
📅 Chart Date: June 26, 2025
📈 CMP: ₹94.32 (+4.60%)
📍 Ticker: NSE:JAMNAAUTO
🔍 Technical Analysis Summary
☕ Cup & Handle Formation
The chart shows a well-formed Cup & Handle pattern
Neckline resistance at ₹94.48 – a break above this zone could trigger bullish continuation
Pattern suggests accumulation and breakout setup after prolonged downtrend reversal
📈 Volume
Rising volume on recent candles, supporting strength of potential breakout
Volume above 3.3M confirms strong buying interest
📊 RSI Indicator (14)
RSI currently at 63.87 and rising
Multiple historical RSI Bullish crossovers visible during base and handle formation
RSI > 60 indicates momentum is favoring bulls
📍 Key Price Levels
✅ Breakout Zone (Neckline): ₹94.48
🚀 Upside Targets (Post-breakout estimate):
₹102
₹110
₹120+
🛡️ Support Zones:
₹90 (immediate)
₹85 (handle base)
₹80 (cup base)
📌 Trade Setup Idea
Entry: On breakout above ₹94.50 with volume
SL: Below ₹89
Targets: ₹102 → ₹110 → ₹120+
Risk-Reward: Good, considering rounded base and handle plus RSI confirmation
⚠️ Disclaimer
This chart analysis is for educational purposes only. Always DYOR (Do Your Own Research) and consult a financial advisor before making investment decisions.
Titan: Cup & Handle Pattern Signals Major Uptrend ContinuationNSE:TITAN Cup & Handle Pattern Signals Major Uptrend Continuation after Macquarie sees Q1 growth on jewellery demand
Price Action Analysis:
• Stock has formed a classic Cup & Handle pattern over an 8-month period from February 2025 to June 2025
• Cup formation shows a rounded bottom with depth of approximately 800 points (3,700 to 2,900 levels)
• Handle formation displays controlled consolidation with lower volatility, indicating institutional accumulation
• Price action demonstrates strong momentum with a 3.58% daily gain and healthy volume expansion
Volume Spread Analysis:
• Volume pattern confirms the Cup & Handle formation with classic volume characteristics
• During cup formation, volume contracted during the decline and expanded during recovery
• Handle formation shows diminishing volume, indicating reduced selling pressure
• Recent breakout accompanied by significant volume spike (2.7M vs average), confirming institutional participation
• Volume-price correlation remains positive, supporting the bullish breakout thesis
Key Technical Levels:
Support Levels:
• Primary Support: 3,500
• Secondary Support: 3,400
• Major Support: 3,200
Resistance Levels:
• Immediate Resistance: 3,700 (Previous highs and psychological level)
• Major Resistance: 3,867 (52 Week high marked on chart)
• Extended Target: 4,200 (Cup & Handle measured move target)
Technical Patterns Identified:
• Cup & Handle Pattern: Primary bullish continuation pattern spanning 5 months
• Ascending Triangle: Within the handle formation, showing higher lows
• Volume Accumulation Pattern: Consistent with institutional buying during consolidation phases
Trade Setup:
Entry Strategy:
• Primary Entry: 3,650-3,680 (Current levels on any minor pullback)
• Secondary Entry: 3,580-3,620
• Aggressive Entry: Market price for momentum traders
Exit Levels:
• Target 1: 3,800 (Near-term resistance, book 30% profits)
• Target 2: 3,950 (Previous highs breach, book 40% profits)
• Target 3: 4,200 (Cup & Handle measured move, remaining 30%)
Risk Management:
• Stop Loss: 3,480 (Below handle low with 5% buffer)
• Risk-Reward Ratio: 1:3 (Risk of 170 points vs reward of 500+ points to first major target)
• Maximum Risk per Trade: 2% of portfolio capital
Position Sizing:
• Conservative Approach: 1-1.5% of portfolio given the strong setup
• Moderate Approach: 2-2.5% for traders comfortable with mid-cap volatility
• Scale-in Strategy: 50% on initial entry, 30% on any dip to secondary entry, 20% on momentum confirmation
Sectoral and Fundamental Backdrop:
Sector Analysis:
• Consumer Discretionary sector showing resilience amid economic recovery
• Jewellery and watches segment benefiting from the wedding season demand and festival purchases
• Luxury consumption trends supporting the premium positioning of Titan's brands
• Rural demand recovery provides an additional growth catalyst for the company
Fundamental Highlights:
• Strong brand portfolio including Tanishq, Titan, Fastrack, and Sonata
• Consistent market share gains in the organised jewellery retail segment
• Digital transformation initiatives are improving operational efficiency
• Expansion in tier-2 and tier-3 cities driving geographical diversification
Macroeconomic Factors:
• Favourable gold price trends supporting jewellery business margins
• Rising disposable income in Indian households is boosting luxury spending
• The government's focus on organized retail supporting compliant players like Titan
• Wedding season and festival demand provide seasonal tailwinds
Key Risks to Monitor:
• Gold price volatility is impacting raw material costs and consumer demand
• Competition from online jewellery platforms and regional players
• Economic slowdown potentially affecting discretionary spending
• Regulatory changes in gold import duties or GST rates
My Take:
This technical setup presents a compelling risk-reward opportunity with the Cup & Handle pattern completion, strong volume confirmation, and favourable sectoral backdrop supporting the bullish thesis for Titan Company.
Keep in the Watchlist.
NO RECO. For Buy/Sell.
📌Thank you for exploring my idea! I hope you found it valuable.
🙏FOLLOW for more
👍BOOST if you found it useful.
✍️COMMENT below with your views.
Meanwhile, check out my other stock ideas on the right side until this trade is activated. I would love your feedback.
Disclaimer: "I am not a SEBI REGISTERED RESEARCH ANALYST AND INVESTMENT ADVISER."
This analysis is intended solely for informational and educational purposes and should not be interpreted as financial advice. It is advisable to consult a qualified financial advisor or conduct thorough research before making investment decisions.
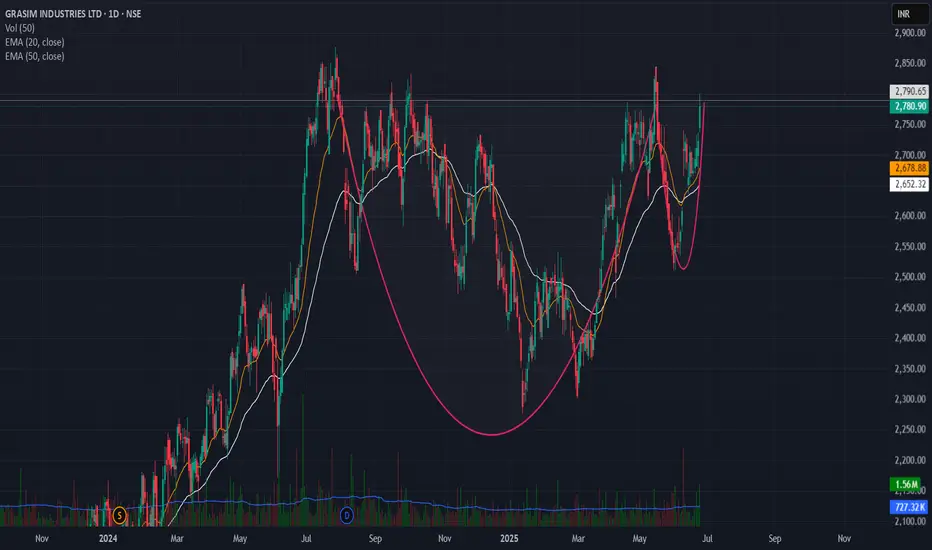
Breakout from cup and handle pattern Grasim Cup and Handle Breakout Setup
Grasim is forming a classic Cup and Handle pattern on the daily chart.
✅ Breakout Level: 2790
🛑 Stoploss: Below 2650 (handle low)
🎯 Target Zone: 3290 (based on depth projection and prior highs)
Pattern Logic:
Rounded cup base indicates accumulation
Handle pullback was shallow with declining volume
Breakout attempt with volume surge
Price above 20 EMA & 50 EMA
RSI > 55 and MACD nearing bullish crossover
Indian Metals & Ferro Alloy: Flag & Pole BONSE:IMFA Breaks out of the Flag & Pole Pattern with Huge Volumes today.
Price Action Analysis:
- Stock experienced a significant decline from highs around 998.80 to lows near 549.80, representing approximately a 45% correction
- Recent breakout above 720 levels shows strong momentum reversal
- Current price at 772.50 (+ 7.77%) indicates bullish sentiment returning
- Higher highs and higher lows pattern emerging on the right side of the chart
Volume Spread Analysis:
- Volume spike coinciding with recent breakout confirms genuine buying interest
- Volume of 202.22K appears elevated compared to previous months
- Green volume bars during the recent rally suggest an accumulation phase
- Low volume during the consolidation phase indicates smart money positioning
Key Technical Levels:
Support Levels
- Primary Support: 720-730 (recent breakout zone)
- Secondary Support: 680-690 (previous resistance turned support)
- Major Support: 600-620 (previous consolidation zone)
Resistance Levels:
- Immediate Resistance: 800-820
- Major Resistance: 880-900
- Long-term Resistance: 950-998 (previous highs)
Base Formation:
- Cup and Handle pattern visible with base formation between 550-680 levels
- Duration of base: Approximately 4-5 months (February to June 2025)
- Handle formation in the May-June period before the breakout
- Flag & Pole Pattern Broke today
Technical Patterns Identified:
Primary Pattern: Cup and Handle
- Well-defined cup formation with rounded bottom
- Handle shows controlled pullback with lower volume
- Breakout above handle resistance confirms pattern completion
- Target projection: 950+ levels based on pattern height
Secondary Patterns:
- Descending trendline resistance tested today
- Double bottom formation around 550-580 levels
- Bullish flag formation post-breakout
Trade Setup Recommendations:
Entry Strategy:
- Aggressive Entry: Current levels 770-775 on any minor dip
- Conservative Entry: 720-730 on pullback to breakout zone
- Momentum Entry: Above 800 for trend continuation
Exit Strategy:
- Target 1: 850 (10% upside from current levels)
- Target 2: 920 (19% upside potential)
- Target 3: 980 (27% upside to retest previous highs)
Stop-Loss Levels:
- For aggressive entries: 720 (7% risk)
- For conservative entries: 680 (6% risk from 720 entry)
- Trailing stop: 8-10% below recent swing lows
Risk Management Framework:
Position Sizing:
- Risk per trade: Maximum 2% of portfolio
- Position size calculation: Portfolio value × 2% ÷ stop-loss distance
- For ₹1 lakh portfolio with 7% stop: ₹2,000 ÷ 0.07 = ₹28,571 position size
Risk Controls:
- Maximum exposure to single stock: 5% of portfolio
- Sector concentration limit: 15% in the metals sector
- Use of position sizing calculator mandatory
- Weekly portfolio review and rebalancing
Sectoral Backdrop Analysis:
Metals Sector Dynamics:
- Global steel demand recovery supporting Indian metal stocks
- Infrastructure spending by the government boosts domestic demand
- Raw material cost stabilization improves margins
- Export opportunities are increasing with global supply chain shifts
Industry Tailwinds:
- The government's focus on infrastructure development
- PLI schemes supporting the manufacturing sector
- Green energy transition requiring metal inputs
- Automotive sector recovery driving steel demand
Fundamental Considerations:
Company Specific Factors:
- Debt reduction initiatives improving balance sheet strength
- Capacity expansion plans supporting long-term growth
- Technology upgrades enhancing operational efficiency
- ESG compliance improving institutional investor interest
Macroeconomic Factors:
- Rupee stability supporting import-dependent operations
- Interest rate environment favourable for the capital-intensive sector
- Government policy support for domestic manufacturing
- Global commodity cycle showing signs of recovery
Trading Psychology Notes:
Behavioural Considerations:
- Stock showing classic accumulation after major decline
- Institutional buying is likely during the base formation period
- Retail sentiment improving with breakout confirmation
- FOMO factor may drive further momentum
Market Sentiment Indicators:
- Relative strength improving against the broader market
- Sector rotation favours cyclical stocks
- Technical breakout attracting momentum traders
- Long-term investors find value after the correction
My take:
This technical setup presents a compelling risk-reward opportunity with clearly defined entry, exit, and risk management parameters. The combination of a strong technical breakout and improving sectoral fundamentals creates a favourable environment for potential gains.
Keep in the Watchlist.
NO RECO. For Buy/Sell.
📌Thank you for exploring my idea! I hope you found it valuable.
🙏FOLLOW for more
👍BOOST if you found it useful.
✍️COMMENT below with your views.
Meanwhile, check out my other stock ideas on the right side until this trade is activated. I would love your feedback.
Disclaimer: "I am not a SEBI REGISTERED RESEARCH ANALYST AND INVESTMENT ADVISER."
This analysis is intended solely for informational and educational purposes and should not be interpreted as financial advice. It is advisable to consult a qualified financial advisor or conduct thorough research before making investment decisions.

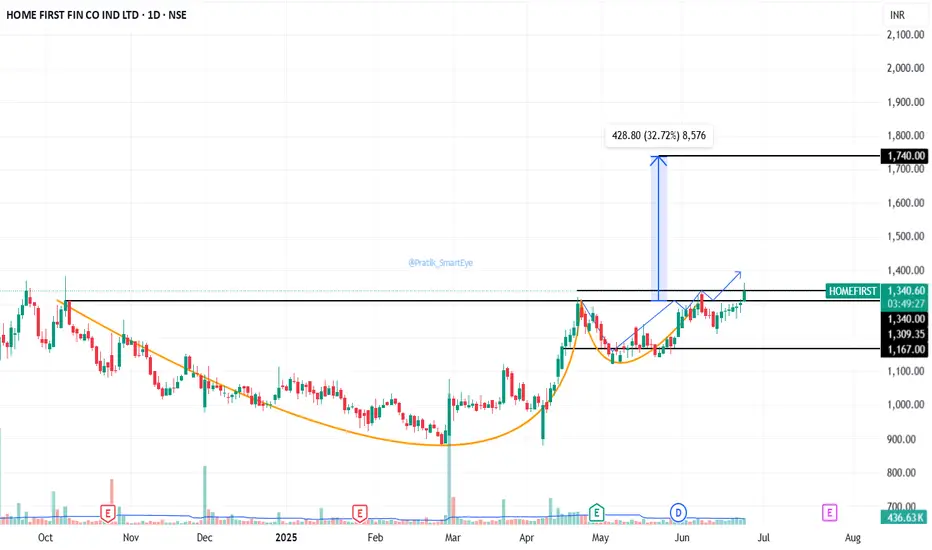
Home First Fin.: Cup & Handle Breakout.Home First Fin.: Cup & Handle Breakout. CMP 1342.
Resistance at 1740.
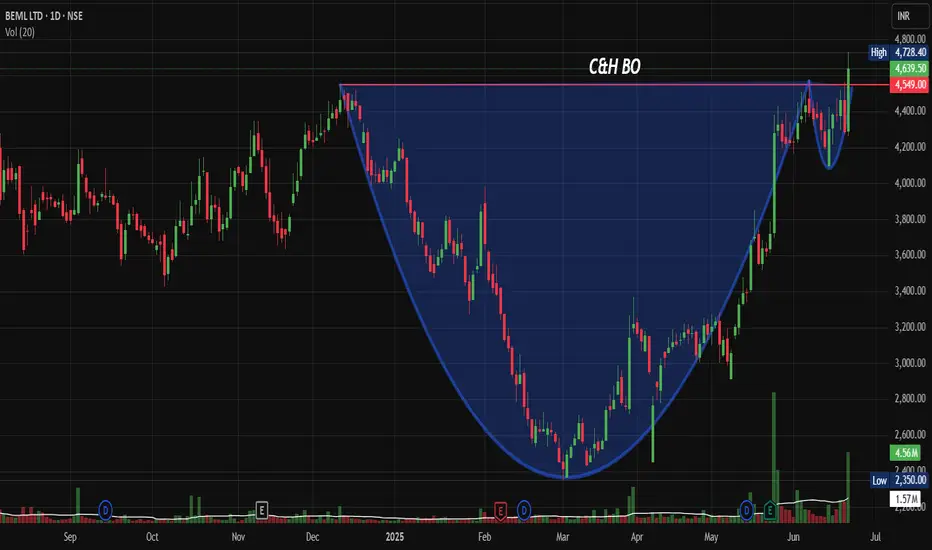
BEML: Breaks Multi-Month Resistance: Perfect Cup & Handle SetupNSE:BEML Breaks Multi-Month Resistance: Perfect Cup and Handle Setup Signals Major Upside Potential
Price Action Analysis:
Current Price Movement:
-Current Price: ₹4,291.50 (as of June 20, 2025)
-Daily Change: +₹351.70 (+8.20%) - Strong bullish momentum
-High: ₹4,728.40 | Low: ₹4,261.00
-Opening: ₹4,291.50 | Volume: 1.57M shares
Key Price Action Points:
Phase 1: Initial Decline (Sep 2024 - Dec 2024)
-Price Range: 4,400 to 3,600 levels
-Characteristics: Controlled selling with no panic dumping
-Volume: Moderate selling pressure
-Significance: Formation of the cup's left rim
Phase 2: Deep Correction (Dec 2024 - Feb 2025)
-Price Range: 3,600 to 2,350 (Cup Bottom)
-Characteristics: Capitulation phase with heavy selling
-Volume: High volume during the decline indicates washout
-Key Level: 2,350 marked the absolute low and cup base
Phase 3: Recovery Rally (Feb 2025 - Apr 2025)
-Price Range: 2,350 to 3,400 levels
-Characteristics: Strong bounce from cup bottom with increasing volume
-Price Action: Higher lows formation indicating accumulation
-Recovery Strength: 45% bounce from lows
Phase 4: Handle Formation (Apr 2025 - May 2025)
-Price Range: 3,400 to 3,000 levels (shallow pullback)
-Characteristics: Light volume decline, healthy consolidation
-Duration: Approximately 4-6 weeks of sideways action
-Volume Pattern: Drying up volume during pullback - classic handle behaviour
Phase 5: Breakout Phase (May 2025 - Current)
-Breakout Level: Above 3,400-3,500 resistance
-Price Acceleration: From 3,000 to the current 4,639 levels
-Volume Confirmation: Massive volume surge during breakout
-Momentum: 43% rally from handle lows in just 6-8 weeks
Candlestick Patterns and Price Behaviour
-Recent Action: Large green candles with minimal upper shadows indicating strong buying pressure
-Volume-Price Relationship: Price advancing on expanding volume - healthy trend
-Pullback Quality: Any pullbacks have been shallow with quick recoveries
-Support Holding: Price consistently holding above key moving averages
Price Structure Analysis:
-Higher Highs: Consistent pattern of higher peaks since February 2025
-Higher Lows: Each pullback finds support at higher levels
-Trend Strength: Steep angle of ascent indicates strong institutional buying
-Momentum Characteristics: Price moving in strong trending phases rather than choppy action
Critical Price Levels Based on Price Action:
-Breakout Confirmation: 3,500 level successfully held as support after breakout
-Momentum Continuation: 4,000 psychological level cleared with ease
-Current Resistance Test: Approaching the 4,800 level with strong momentum
-Volume at Key Levels: Each significant level break is accompanied by volume expansion
Chart Patterns:
-Cup and Handle Formation: The chart displays a classic cup and handle pattern spanning from late 2024 to mid-2025, with the cup formation completing around June 2025 at approximately 4,639 levels
-Breakout Confirmation: Stock has successfully broken above the handle resistance levels with strong volume confirmation
-Time Frame: The pattern has developed over approximately 9 months, indicating strong institutional accumulation
Support and Resistance Levels:
Major Support Levels:
-Immediate Support: 4,000-4,100 (psychological and technical level)
-Primary Support: 3,800-3,900 (previous resistance turned support)
-Secondary Support: 3,400-3,500 (breakout level)
-Long-term Support: 2,800-3,000 (cup base formation)
Resistance Levels:
-Immediate Resistance: 4,800-4,900 (current test level)
-Major Resistance: 5,200-5,400 (projected target based on cup depth)
-Extended Target: 5,800-6,000 (long-term projection)
Volume Spread Analysis:
-Breakout Volume: Significant volume spike observed during the recent breakout from handle formation
-Volume Confirmation: Above-average volume during the entire cup formation phase indicates institutional interest
-Current Volume: 1.57M shares showing continued institutional participation
-Volume Trend: Consistent volume buildup supporting price advancement
Base Formation Analysis:
Primary Base Characteristics:
-Base Type: Cup and Handle pattern with 7-month consolidation
-Base Depth: Approximately 47% correction from highs of 4,400 to lows of 2,350
-Base Duration: Extended consolidation period allowing for proper shake-out of weak hands
-Base Quality: Clean consolidation with clear support and resistance levels
Trade Setup Analysis:
Entry Strategy:
-Primary Entry: 4,100-4,200 (on pullback to support zone)
-Aggressive Entry: Current market price around 4,300 with tight stop-loss
-Conservative Entry: Wait for retest of 3,800-4,000 support levels
Exit Levels:
Target 1: 5,200 (21% upside from current levels)
Target 2: 5,600 (30% upside potential)
Target 3: 6,000 (40% upside - long-term target)
Stop-Loss Management:
Initial Stop-Loss: 3,800 (below key support)
Trailing Stop: Move to 4,000 once Target 1 is achieved
Risk-Reward Ratio: 1:2.5 (favourable risk-reward setup)
Position Sizing Recommendations:
-Conservative Approach: 2-3% of portfolio allocation
-Moderate Risk: 3-5% allocation for growth-oriented portfolios
-Risk Management: Maximum 5% position size due to single stock concentration risk
Risk Management Framework:
Key Risk Factors:
Market Risk: Overall market volatility can impact individual stock performance
Sector Risk: Defence and infrastructure sector cyclicality
Execution Risk: Pattern failure if stock breaks below 3,800 support
Risk Mitigation Strategies:
Diversification: Avoid over-concentration in a single position
Stop-Loss Discipline: Strict adherence to predetermined exit levels
Position Monitoring: Regular review of technical and fundamental developments
Sectoral and Fundamental Backdrop:
Business Verticals:
-BEML operates across Defence, Rail, Power, Mining and Infrastructure sectors, serving India's core industries BemlindiaBemlindia
-The company manufactures heavy earthmoving equipment for mining and construction, defence vehicles, and coaches for metro and Indian Railways, Bharat Earth Movers Limited
Financial Performance:
-Market Cap: ₹19,324 Crore with revenue of ₹4,022 Cr and profit of ₹293 Cr
-Promoter holding stands at 54.0%, indicating strong government backing.
-The board has recommended a final dividend of ₹1.20 per share for FY25, reflecting confidence in financial performance.
Growth Drivers:
-Company targeting ₹30bn annual opportunity in the mining sector with state-of-the-art equipment.
-Defence projects, including DATRAN prototypes, are expected to be completed by mid-2025
-The company has grown from ₹5 Cr turnover in 1965 to over ₹4,300 Cr currently.
Sector Outlook:
-Defence Modernization: Beneficiary of India's defence modernization and Make in India initiatives
-Infrastructure Push: The Government's focus on infrastructure development supports mining and construction equipment demand
-Railway Expansion: Metro and railway coach manufacturing aligned with India's transportation infrastructure growth
Investment Thesis:
-PSU Re-rating: Part of the broader PSU re-rating theme in Indian markets
-Diversified Revenue: Multi-sector exposure provides revenue stability
-Government Support: Strong backing from the Ministry of Defence ensures policy support
-Technical Breakout: Pattern completion suggests an institutional accumulation phase
My Take:
The combination of strong price action momentum with improving fundamental backdrop makes BEML an attractive investment opportunity for medium to long-term investors, with the cup and handle breakout providing clear entry and exit parameters for risk management.
Keep in the Watchlist.
NO RECO. For Buy/Sell.
📌Thank you for exploring my idea! I hope you found it valuable.
🙏FOLLOW for more
👍BOOST if you found it useful.
✍️COMMENT below with your views.
Meanwhile, check out my other stock ideas on the right side until this trade is activated. I would love your feedback.
Disclaimer: "I am not a SEBI REGISTERED RESEARCH ANALYST AND INVESTMENT ADVISER."
This analysis is intended solely for informational and educational purposes and should not be interpreted as financial advice. It is advisable to consult a qualified financial advisor or conduct thorough research before making investment decisions.
Cup & Handle Breakout + Golden Cross Confirms Bullish Megatrend Timeframe: Daily
Ticker: NSE:SIEMENS
🔥 Key Technical Setup:
Cup & Handle Pattern:
Cup Depth: ~1026 points
Breakout Level: 3414 (multi-touch resistance).
Golden Cross Confirmation: 50 EMA crossed above 200 EMA (bullish long-term momentum shift).
Volume & Price Confirmation:
- Entry Trigger: Close above 3414 with a strong green candle + above-average volume (min. 1.5x 20-day avg volume).
- False Breakout Filter: Volume must surge to validate breakout.
🎯 Trade Strategy:
Entry Zone: 3415–3430 (after confirmed breakout).
Stop Loss: 3169 (swing low of the handle, below key support).
Target 1: 3750
Target 2: 4170
Final Target: 4455 (cup depth projected from breakout: *3414 + 1026 = 4440–4455*).
The trade targets 4455, but reaching this level will take time—patience is key as price works through resistance at 3750 and 4170.
📉 Price Action Mantra:
“Price absorbs all noise! Trade the CHART, not the news.”
📊 Why This Works:
1. Golden Cross Amplifies Momentum: Post-crossover, rallies average +25% in trending stocks.
2. Cup & Handle Statistics: 85% success rate when volume confirms breakout.
3. Volume Divergence: Declining volume in handle + surge on breakout = institutional accumulation.
⚠️ Risk Management:
Position Size: Risk ≤1% capital per trade.
Trailing SL: Move SL to 3300 after Target 1 (3750) hit.
Partial Exit: Book 50% at 3750, 25% at 4170, hold 25% for 4455.
🧠 Psychology & Market Structure:
Resistance Levels to Watch:
3750: Profit-taking zone.
4170: Key options barrier (break = accelerated FOMO).
Support Floor: 3200–3169 (must hold to preserve structure).
Set alerts, follow volume, and let price lead the way!
📌 Disclaimer:
This is not financial advice. Past performance ≠ future results. Conduct your own due diligence. Technical analysis has limitations and may not account for black swan events. Manage risk aggressively.

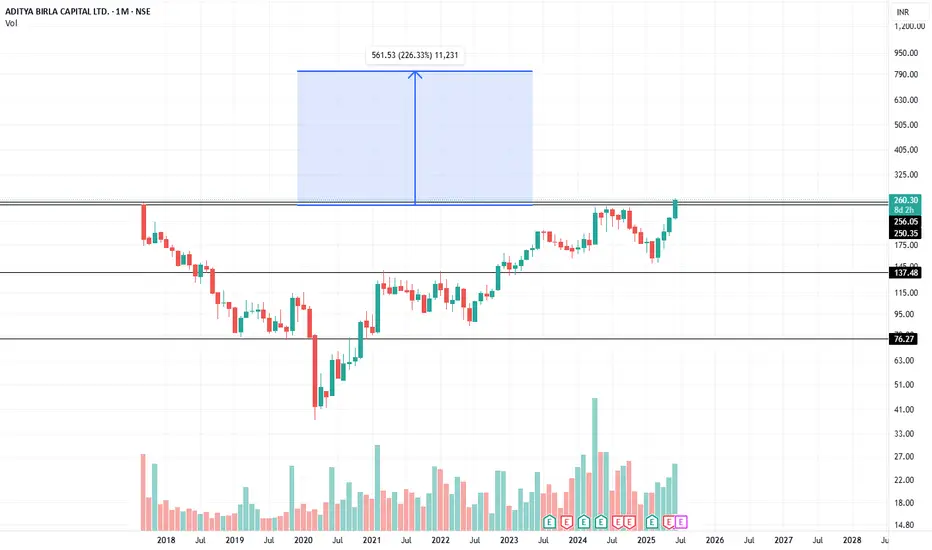
#ABCCAPITAL looking bullish on monthly & weekly timeframe#ABCCAPITAL has given a breakout at 260 on a weekly timeframe. Upside potential: 100%+. Stop loss: 238. A few things to note:
The stock has given a breakout on weekly level. Risk-averse traders can wait for June monthly close above 260
This stock will require immense patience as this could turn a multi-bagger
The volumes have been increasing over the last few months
This is not a buy/sell recommendation. Research carefully and invest at your own risk.
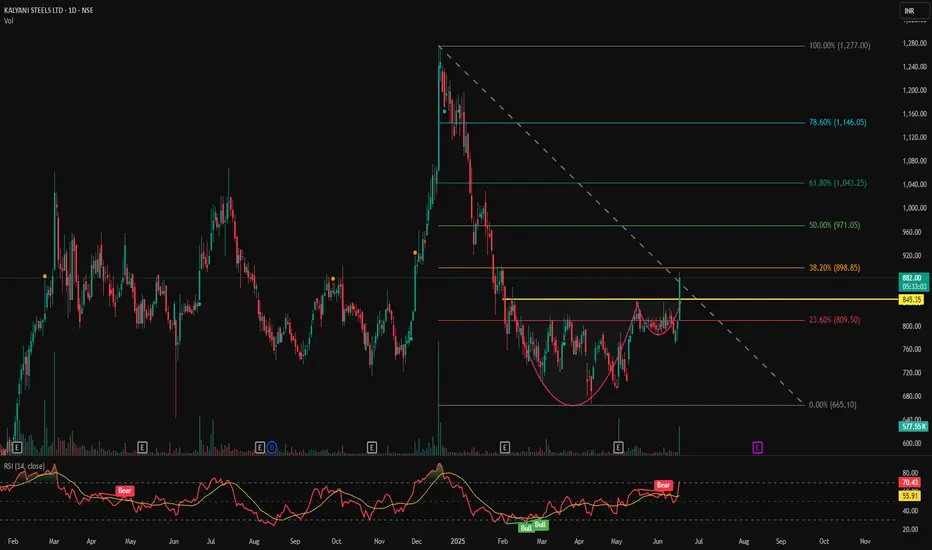
KSL - Strong Cup & Handle Breakout | Volume & RSI Confirmation📊 KALYANI STEELS LTD (KSL) – Strong Cup & Handle Breakout | Volume & RSI Confirmation | Daily Chart
📅 Chart Date: June 17, 2025
📈 CMP: ₹891.00 (+10.33%)
📍 Ticker: NSE:KSL
🔍 Technical Chart Breakdown
☕ Cup & Handle Pattern Breakout
KSL has decisively broken above the neckline resistance around ₹845 after forming a classic Cup & Handle pattern — a strong bullish continuation setup. This breakout has been accompanied by a solid volume spike (458.32K), which adds further confirmation.
💹 RSI Analysis
RSI is currently at 71.61, indicating strong bullish momentum.
RSI crossover confirms entry into the overbought zone, signaling strength but also requiring caution for late entries.
🕯️ Volume Action
Noticeable volume surge on the breakout candle suggests institutional participation.
Previous volume build-up near the handle zone indicates accumulation.
📍 Key Price Levels
✅ Breakout Zone: ₹845.35
🚀 Potential Upside Targets:
₹920 – Minor resistance
₹990–₹1,040 – Short to medium-term swing targets
₹1,150+ – Based on measured pattern height
🛡️ Support Zones:
₹845 – breakout retest level
₹800 – psychological support
₹765 – handle base and invalidation zone
🛠️ Trading Strategy Idea
Entry: Either breakout close above ₹845 or on retest of breakout zone
Stop Loss: Below ₹800
Targets: ₹920 → ₹1,000 → ₹1,150
Risk-Reward: >1:2 on first target with strong technical validation