Introduction to Derivatives Trading1. Futures Contracts
A futures contract is a standardized agreement between two parties to buy or sell an underlying asset at a predetermined price on a specified future date. These contracts are traded on regulated exchanges and are legally binding. Futures are commonly used in commodities (like gold, crude oil, or agricultural products) and financial instruments (like stock indices or government bonds).
Key Features of Futures
Standardization: Futures contracts are standardized in terms of quantity, quality, and delivery date of the underlying asset.
Leverage: Futures allow traders to take large positions with a relatively small amount of capital, known as the margin.
Obligation: Both parties are obligated to fulfill the contract at maturity unless the position is squared off before expiry.
Mark-to-Market: Daily profits and losses are settled daily, ensuring that credit risk is minimized.
Hedging and Speculation: Futures can protect against price fluctuations or be used to speculate for potential profits.
Types of Futures
Commodity Futures – Contracts based on physical commodities like metals, oil, or agricultural products.
Financial Futures – Contracts based on financial instruments like stock indices, interest rates, or currencies.
Trading Futures
Long Position: Buying a futures contract expecting the price of the underlying asset to rise.
Short Position: Selling a futures contract expecting the price to decline.
Advantages of Futures Trading
Hedging: Farmers, manufacturers, and exporters use futures to lock in prices and reduce uncertainty.
Leverage: Allows traders to control larger positions with smaller capital.
Liquidity: Futures markets are often highly liquid, enabling easy entry and exit.
Price Discovery: Futures trading helps establish market prices for commodities and financial instruments.
Risks of Futures Trading
Leverage Risk: While leverage magnifies profits, it also amplifies losses.
Market Risk: Sudden price movements can result in significant losses.
Liquidity Risk: Some futures contracts may have low trading volumes, making exit difficult.
2. Options Contracts
An option is a financial derivative that gives the buyer the right, but not the obligation, to buy or sell an underlying asset at a specified price (strike price) on or before a certain date. Unlike futures, the buyer of an option is not obligated to execute the trade, which provides limited risk.
Key Components of Options
Call Option: Gives the buyer the right to buy an asset at a predetermined price.
Put Option: Gives the buyer the right to sell an asset at a predetermined price.
Strike Price: The price at which the asset can be bought or sold.
Expiry Date: The date by which the option must be exercised or it expires worthless.
Premium: The price paid by the buyer to the seller for acquiring the option.
Types of Options
American Options – Can be exercised any time before expiry.
European Options – Can only be exercised on the expiry date.
Stock Options – Based on individual stocks.
Index Options – Based on stock market indices.
Commodity Options – Based on commodities like gold, silver, or oil.
Option Positions
Buying a Call: Profits if the underlying asset rises above the strike price plus premium.
Buying a Put: Profits if the underlying asset falls below the strike price minus premium.
Selling a Call: Obligation to sell if the buyer exercises the option. Profits limited to the premium received.
Selling a Put: Obligation to buy if the buyer exercises the option. Profits limited to the premium received.
Advantages of Options
Limited Risk for Buyers: Maximum loss is limited to the premium paid.
Leverage: Small investment can control a larger position.
Flexibility: Can be used in various strategies to profit in bullish, bearish, or neutral markets.
Hedging: Investors can protect portfolios against adverse price movements.
Risks of Options
Time Decay: Options lose value as they approach expiration (Theta risk).
Complexity: Options pricing depends on multiple factors like volatility, interest rates, and time.
Unlimited Loss for Sellers: Writing options without coverage can lead to substantial losses.
3. Differences Between Futures and Options
Feature Futures Options
Obligation Both parties obligated Buyer has right, seller has obligation
Risk Potentially unlimited Limited for buyer, unlimited for seller
Premium No upfront cost Buyer pays premium
Profit/Loss Linear, symmetric Non-linear, asymmetric
Use Hedging and speculation Hedging, speculation, income strategies
4. Popular Derivatives Trading Strategies
Futures Strategies
Hedging: Protects physical assets or portfolios against price fluctuations.
Example: A farmer sells wheat futures to lock in a selling price.
Speculation: Traders take positions to profit from price movements.
Example: Buying Nifty futures anticipating a market rally.
Spread Trading: Simultaneously buying and selling different futures contracts to profit from price differentials.
Options Strategies
Covered Call: Holding a stock while selling a call option to generate premium income.
Protective Put: Buying a put option to hedge against potential downside risk in a stock.
Straddle/Strangle: Buying calls and puts simultaneously to profit from high volatility.
Iron Condor: Selling and buying multiple options to benefit from low volatility.
Butterfly Spread: Combining options to profit from minimal movement in the underlying asset.
5. Key Concepts in Derivatives Trading
Leverage & Margin: Both futures and options allow traders to control large positions with small capital. Margin requirements vary by contract.
Volatility: A critical factor, especially in options pricing. High volatility increases premiums.
Liquidity: Essential for easy entry and exit. Highly traded contracts have narrower spreads.
Settlement: Futures are marked to market daily, while options can expire worthless if not exercised.
Regulatory Framework: Derivatives markets are regulated to ensure transparency, reduce counterparty risk, and prevent market manipulation.
6. Risk Management in Derivatives
Derivatives are inherently risky due to leverage and market fluctuations. Effective risk management strategies include:
Position Sizing: Limiting the amount of capital per trade.
Stop Losses: Predetermined exit points to contain losses.
Hedging: Using derivatives to offset potential losses in the underlying asset.
Diversification: Spreading risk across multiple instruments or markets.
Monitoring Volatility: Avoiding trades during extreme market uncertainty unless well-planned.
7. Advantages of Derivatives Trading
Hedging against Risks: Corporates, investors, and traders can protect against adverse price movements.
Speculative Gains: Traders can profit from short-term price movements without owning the underlying asset.
Leverage: Enables higher potential returns with lower capital investment.
Market Efficiency: Helps in price discovery and liquidity in financial markets.
Flexibility: Wide range of strategies for bullish, bearish, or neutral market conditions.
8. Challenges in Derivatives Trading
Complexity: Requires understanding of pricing, volatility, and Greeks (for options).
Leverage Risk: Amplifies losses, leading to potential margin calls.
Market Volatility: Rapid price movements can cause unexpected losses.
Emotional Discipline: Requires strict adherence to trading plans to avoid impulsive decisions.
Conclusion
Derivatives trading, through futures and options, offers immense opportunities for both hedging and speculation. Futures provide a straightforward mechanism for locking in prices and leveraging positions, while options add flexibility with limited risk for buyers. A thorough understanding of contract specifications, market dynamics, strategies, and risk management is essential for success. While derivatives can amplify profits, they can also magnify losses if used without proper knowledge and discipline. For modern traders and investors, mastering derivatives is a critical skill to navigate complex and dynamic financial markets effectively.
Derivatives

Policy Developments in Derivatives and Commodities MarketsIntroduction
The derivatives and commodities markets are critical components of the global financial system. They provide essential tools for risk management, price discovery, and investment diversification. Derivatives—contracts whose value derives from underlying assets like commodities, equities, or currencies—enable participants to hedge against price volatility. Commodities markets, on the other hand, facilitate trading in raw materials such as oil, metals, and agricultural products.
Over the past few decades, these markets have witnessed significant evolution in both their structure and regulatory frameworks. Policymakers and regulatory authorities across the globe have introduced reforms to enhance transparency, reduce systemic risk, and promote market efficiency. These policy developments have become increasingly important in light of financial crises, technological advancements, globalization of markets, and growing participation from retail investors.
1. Historical Context of Derivatives and Commodities Regulation
The regulation of derivatives and commodities markets has evolved in response to market crises and structural changes. Historically, commodities trading, especially in agricultural products, was lightly regulated, primarily aimed at preventing fraud and market manipulation. In contrast, modern derivative markets grew exponentially in the 1980s and 1990s with the rise of financial engineering and complex instruments like options, swaps, and futures.
Major events that shaped policy include:
The 1987 Stock Market Crash: Highlighted the need for robust oversight of derivative instruments and their impact on financial markets.
The 2008 Global Financial Crisis: Exposed systemic risks inherent in over-the-counter (OTC) derivatives markets, prompting regulators to focus on transparency, collateralization, and centralized clearing mechanisms.
Commodity Price Volatility: Sharp swings in oil, metals, and agricultural products prices led to government interventions to stabilize markets, protect consumers, and ensure fair trading practices.
These events underscored the importance of developing robust regulatory frameworks to safeguard market integrity while fostering innovation.
2. Objectives of Policy Developments
Regulatory policies in derivatives and commodities markets aim to achieve several key objectives:
Market Integrity: Preventing manipulation, insider trading, and fraudulent practices.
Transparency: Ensuring that market participants have access to accurate and timely information about prices, trading volumes, and open positions.
Financial Stability: Reducing systemic risk that arises from excessive leverage, interconnected financial institutions, and OTC derivatives exposures.
Consumer Protection: Safeguarding investors, particularly retail participants, from misleading practices or excessive risk exposure.
Promotion of Market Efficiency: Ensuring smooth price discovery and liquidity in the markets.
Alignment with International Standards: Harmonizing domestic regulations with global best practices set by organizations such as the International Organization of Securities Commissions (IOSCO) and the Financial Stability Board (FSB).
3. Key Policy Developments in Derivatives Markets
3.1 Introduction of Central Clearing
One of the most significant reforms after the 2008 financial crisis was the push for central clearing of standardized OTC derivatives. Central counterparties (CCPs) act as intermediaries between buyers and sellers, reducing counterparty risk. Regulatory frameworks such as Dodd-Frank Act (USA, 2010) and the European Market Infrastructure Regulation (EMIR, EU, 2012) mandated clearing of certain interest rate and credit derivatives through CCPs.
Impact:
Reduced systemic risk from bilateral exposures.
Standardized collateral requirements.
Improved market transparency.
3.2 Trade Reporting and Transparency
Regulators worldwide have introduced mandatory trade reporting requirements to enhance transparency in derivatives markets. Trade repositories collect and publish data on derivative transactions, including notional amounts, counterparties, and trade dates.
Examples of regulatory measures:
Dodd-Frank Act: Requires real-time reporting of swaps transactions to swap data repositories.
EMIR: Obligates EU market participants to report derivative trades to trade repositories.
Impact:
Increased market visibility.
Facilitated monitoring of systemic risk and market abuse.
3.3 Margin and Collateral Requirements
To mitigate counterparty risk, regulators have introduced margin requirements for both cleared and non-cleared derivatives. Initial margin protects against potential default losses, while variation margin ensures that daily gains and losses are settled.
Impact:
Reduced excessive leverage in derivatives trading.
Promoted financial stability and investor confidence.
3.4 Standardization of Contracts
Policy frameworks encourage the standardization of derivative contracts to facilitate central clearing and improve liquidity. Standardization covers contract size, settlement dates, underlying asset definitions, and documentation standards.
Impact:
Easier to trade on exchanges or through CCPs.
Lower operational and legal risks for participants.
3.5 Risk-Based Supervision
Regulators are increasingly adopting risk-based approaches to monitor derivative markets. This involves focusing on systemically important institutions, products, and trading strategies that could pose the greatest risk to financial stability.
Impact:
Efficient use of regulatory resources.
Early identification and mitigation of systemic threats.
4. Key Policy Developments in Commodities Markets
4.1 Position Limits and Speculation Controls
Excessive speculative trading can destabilize commodity prices. Regulators have introduced position limits to restrict the number of contracts a participant can hold in futures markets. These limits aim to prevent market manipulation and excessive concentration of risk.
Examples:
Commodity Futures Trading Commission (CFTC) in the US sets speculative position limits for energy, metals, and agricultural contracts.
Securities and Exchange Board of India (SEBI) imposes position limits in commodity futures markets to curb volatility.
4.2 Market Surveillance and Anti-Manipulation Measures
Commodity exchanges and regulators have strengthened market surveillance to detect and prevent price manipulation, spoofing, and front-running. Sophisticated monitoring systems track trading patterns in real-time to identify anomalies.
Impact:
Enhanced investor confidence.
Reduced market distortions caused by artificial price movements.
4.3 Integration with Global Markets
Globalization of commodities trading has prompted harmonization of regulations across borders. Policymakers focus on aligning rules regarding contract specifications, reporting, and settlement to facilitate international participation.
Examples:
Cross-border recognition of clearinghouses.
Adoption of international standards on warehouse receipts and quality certification for agricultural commodities.
4.4 Commodity Derivatives for Hedging and Risk Management
Governments encourage the use of commodity derivatives for legitimate hedging purposes by producers, consumers, and traders. Policy initiatives include reducing regulatory burdens for hedgers while monitoring speculative activities.
Impact:
Enhanced price discovery and risk management.
Support for farmers, manufacturers, and energy companies in managing input costs.
4.5 Technological Innovations and Policy Adaptation
Digital trading platforms, algorithmic trading, and blockchain-based commodity exchanges have transformed the market landscape. Regulators are adapting policies to address new risks, including cyber threats, algorithmic market manipulation, and transparency challenges in decentralized trading.
Impact:
Improved market efficiency and accessibility.
Necessitated development of technology-driven monitoring tools.
5. Emerging Trends in Policy Development
Sustainability and ESG Integration: Policies increasingly emphasize environmental, social, and governance (ESG) compliance. Commodity trading in carbon credits, renewable energy certificates, and ESG-linked derivatives is growing.
Retail Participation Regulation: With growing retail interest in commodities and derivatives, regulators are introducing education initiatives, leverage limits, and product suitability requirements.
Cross-Market Risk Management: Integrated policies are addressing interconnected risks between derivatives, commodities, and other financial markets.
Global Coordination: Bodies like the IOSCO and FSB coordinate policy frameworks to prevent regulatory arbitrage and systemic instability.
6. Challenges in Policy Implementation
Despite significant reforms, regulators face several challenges:
Complexity of Derivative Products: Highly customized contracts are difficult to monitor and standardize.
Global Market Fragmentation: Different jurisdictions have varied regulatory standards, creating arbitrage opportunities.
Technological Disruptions: High-frequency trading, AI-based strategies, and decentralized exchanges introduce new risks.
Balancing Innovation and Risk: Policymakers must ensure that innovation is not stifled while protecting market participants.
7. Conclusion
Policy developments in derivatives and commodities markets have transformed these markets into safer, more transparent, and efficient mechanisms for risk management and investment. Central clearing, trade reporting, margin requirements, and position limits have enhanced market integrity and financial stability. Regulatory emphasis on transparency, standardization, and risk-based supervision has reduced systemic threats while fostering investor confidence.
As these markets continue to evolve with globalization, technological innovation, and ESG integration, policymakers must remain agile. Future regulatory frameworks are likely to focus on harmonizing global standards, enhancing surveillance capabilities, promoting sustainability, and safeguarding retail participants. Effective policy development in derivatives and commodities markets not only mitigates risks but also ensures that these markets continue to serve as vital tools for price discovery, hedging, and economic growth.
Quarterly Trading Performance1. Importance of Quarterly Trading Performance
Strategic Assessment
Evaluating performance quarterly helps traders and fund managers assess the effectiveness of their trading strategies. Unlike monthly reviews, which may be skewed by short-term market anomalies, or annual reviews, which may mask mid-year changes, quarterly reviews strike a balance between short-term monitoring and long-term evaluation.
Risk Management
Tracking quarterly performance allows traders to assess their risk exposure systematically. Metrics such as maximum drawdown, Sharpe ratio, and volatility can be analyzed over the quarter to determine if risk levels are acceptable. Poor quarterly performance often signals the need to adjust position sizing, hedge exposure, or reallocate capital.
Investor Reporting
Institutional traders and fund managers are required to provide quarterly reports to stakeholders. These reports include trading performance, market commentary, and strategy updates. A transparent quarterly evaluation builds investor confidence and provides justification for strategic decisions.
Market Cycle Analysis
Financial markets often move in cycles influenced by economic activity, corporate earnings, and seasonal trends. Quarterly performance metrics help traders identify these cyclical patterns, such as increased volatility in earnings seasons or liquidity shifts in fiscal year-end periods.
Benchmarking and Comparative Analysis
Comparing quarterly performance against indices, peers, or historical data helps traders evaluate relative success. For example, a portfolio returning 5% in Q2 may seem positive, but if the benchmark index returned 10%, the strategy underperformed. Quarterly benchmarking highlights these gaps.
2. Key Metrics for Quarterly Trading Performance
To evaluate quarterly trading performance, traders typically rely on several financial and statistical metrics. These metrics are essential for both quantitative and qualitative assessments.
2.1 Profitability Metrics
Gross Profit and Loss (P&L)
The gross profit is the total gains from all trades before accounting for expenses, while gross loss represents the total losses. The net P&L for the quarter is calculated as gross profit minus gross loss.
Example: A trader gains $50,000 from winning trades and loses $20,000 from losing trades. The quarterly net P&L = $30,000.
2.2 Risk Metrics
Volatility
Volatility measures the degree of variation in portfolio returns over the quarter. High volatility indicates larger price swings, which could amplify gains but also increase risk.
Maximum Drawdown
This metric captures the largest peak-to-trough decline during the quarter. It helps assess the potential downside risk and the capital preservation efficiency of the trading strategy.
2.3 Operational Metrics
Win/Loss Ratio
The ratio of profitable trades to losing trades. A higher ratio indicates consistent strategy execution.
Average Trade Duration
Helps analyze whether strategies are performing better in short-term versus long-term trades. Some quarters may favor intraday or swing strategies depending on market volatility.
Trade Frequency
Number of executed trades in a quarter. High-frequency trading strategies may have numerous small gains, while long-term positions may yield fewer but larger profits.
Execution Efficiency
Measures slippage, transaction costs, and trade execution quality. Poor execution can erode profits, especially in volatile markets.
3. Factors Influencing Quarterly Trading Performance
Quarterly performance is influenced by a combination of market, economic, and internal factors:
3.1 Market Factors
Volatility: Sudden spikes or dips in volatility can significantly impact short-term trading strategies.
Liquidity: Thinly traded assets may lead to higher slippage and wider spreads, affecting profitability.
Market Cycles: Different quarters may favor specific sectors or instruments, such as retail stocks performing better during holiday seasons.
3.2 Economic Factors
Macroeconomic Data Releases: Quarterly GDP, inflation reports, and employment data can trigger market movements.
Interest Rates and Monetary Policy: Central bank policies affect equity, bond, and currency markets differently across quarters.
Corporate Earnings: Earnings season often leads to heightened volatility and trading opportunities.
3.3 Internal Factors
Strategy Changes: Modifications to trading algorithms or portfolio allocations can improve or hurt quarterly performance.
Trader Psychology: Emotional factors, such as overconfidence after a strong quarter, can influence decision-making.
Operational Constraints: Systems outages, liquidity issues, or margin limitations may impact quarterly results.
4. Analyzing Quarterly Trading Performance
Analyzing performance involves both quantitative assessment and qualitative insights.
4.1 Quantitative Analysis
Trend Analysis:
Examining profit and loss trends over the quarter to identify consistent gains or losses.
Correlation Studies:
Assessing how portfolio performance correlates with market indices or sectors. High correlation may indicate lack of diversification.
Performance Attribution:
Breaking down returns by asset class, sector, or strategy to understand what drove profits or losses.
4.2 Qualitative Analysis
Market Conditions:
Were the market conditions favorable for the strategy? For instance, a momentum-based strategy might underperform in a sideways market.
Execution Review:
Evaluating if trades were executed as planned or if human or system errors affected results.
Strategy Suitability:
Assessing if the strategy continues to align with market conditions and risk appetite.
5. Reporting Quarterly Performance
For professional traders and fund managers, quarterly performance reports are crucial. These reports typically include:
Executive Summary:
Key highlights, major gains/losses, and overall net performance.
Performance Metrics:
Detailed tables and charts showing returns, volatility, Sharpe ratio, drawdowns, and win/loss ratios.
Market Commentary:
Insights on market conditions, major events, and their impact on the portfolio.
Strategy Review:
Analysis of which strategies or positions contributed most to performance.
Action Plan:
Proposed adjustments for the next quarter, including risk management improvements or strategy tweaks.
6. Improving Quarterly Trading Performance
Diversification:
Spread investments across asset classes, sectors, and geographies to reduce risk.
Risk Management:
Implement stop-loss limits, position sizing rules, and hedging strategies.
Strategy Optimization:
Continuously backtest and refine strategies to adapt to changing market conditions.
Technology and Analytics:
Use advanced trading platforms, algorithms, and analytics tools to improve execution and decision-making.
Trader Education and Discipline:
Maintain emotional discipline, follow trading plans strictly, and avoid overtrading during volatile periods.
7. Case Studies of Quarterly Performance
Case Study 1: Equity Trading Fund
An equity-focused hedge fund recorded the following quarterly returns over a year:
Q1: +3%
Q2: -1.5%
Q3: +5%
Q4: +2%
Analysis revealed that Q2 underperformance was due to unexpected central bank announcements causing market-wide sell-offs. Adjustments included tighter stop-losses and hedging, resulting in improved Q3 and Q4 results.
Case Study 2: Forex Trader
A currency trader focusing on EUR/USD experienced a high quarterly volatility environment in Q2 due to geopolitical tensions. By adjusting position sizing and using forward contracts for risk mitigation, the trader achieved a net positive P&L despite turbulent market conditions.
8. Challenges in Assessing Quarterly Performance
Short-Term Volatility:
Quarters with extreme market events may distort performance evaluation.
Overemphasis on Returns:
Focusing solely on profits can neglect risk metrics, leading to unsafe trading practices.
Data Quality Issues:
Inaccurate trade records or reporting errors can skew quarterly performance assessment.
Market Regime Changes:
Strategies that worked in one quarter may fail in another due to shifting macroeconomic or technical conditions.
9. Conclusion
Quarterly trading performance is more than just a measure of profit—it is a comprehensive assessment of strategy effectiveness, risk management, and operational efficiency. By analyzing key metrics, understanding market influences, and implementing continuous improvements, traders can maximize returns and reduce risk exposure. Moreover, transparent quarterly reporting builds credibility with investors and provides a structured framework for decision-making.
A disciplined approach to quarterly evaluation allows traders to navigate market cycles successfully, adapt to changing conditions, and ensure sustainable performance over the long term. Ultimately, quarterly trading performance is both a mirror reflecting past decisions and a compass guiding future trading strategies.
if Nifty Realty reverse from 735.10 then what about DLF?Hello!!
If Nifty Realty reverse from 735.10 for let say 3 points...
What we can expect in the DLF?
can it be a good move?
Keep Learning with NG!!
:)

Short-Term Trading Opportunity Alert: Reliance in FocusHello Traders!
I’ve got my sights set on Reliance for a short-term trading opportunity. Before you dive in, here’s what you need to know:
Analysis: On the daily and four-hour time frames, we’ve got an intriguing pullback opportunity that could lead to some upward movement.
Caution: Keep in mind, the overall direction of this stock is bearish, so tread carefully.
Trading Opportunity: If you’re keen to seize this chance, consider a long position from the indicated levels.
Derivative Traders: For those in the derivatives market, keep an eye on 2200 or 2300 CE options for November expiry.
Risk Management: Always set stop-loss orders and be prepared for fluctuations in the market.
Takeaway: This isn’t an investment opportunity but a short-term trading play. If you’re comfortable with short-term moves, this might be your playground.
Your Strategy: What’s your take on Reliance? Planning to hop on this ride or staying on the sidelines? Share your thoughts below!
Stay Informed: Follow for updates on this trade opportunity and more.
Happy trading!

Sensex Expiry Day Special Analysis||Hero Zero TradeHello Traders Good morning. i hope you all will be doing good in Trading and in your life as well.
I have brought analysis on Sensex first time since i have started posting my ideas here, As we all know today's Sensex Expiry day. So will try to find a best trade from our analysis. Well i have marked all best possible levels for buying and selling. But still i will write here for more clarity, Levels are below.
Today's Important Levels for watchout in sensex:-
Buy above 65827 if levels sustains.
Targets will be 66072 (New all time high)
Stop loss will be 65570
Sale below 65570 if levels sustains,
Targets will be 65254/64988
Stop loss will be 65827
For Hero Zero Setup, you have to wait for perfect levels, i will update you if i will get any best trade setup related.
Note:- Hero Zero Trades are very highly risk and rewards trades, so trade carefully and always go in less quantities.
Disclaimer:- I Might be wrong in this analysis, so please always do your own analysis or consult with your financial advisor before taking any kind of trades.
Please like, follow and comment your thoughts on my idea.
Thankyou.
Regards
Rahul Pal

Unveiling Insights from MCX Crude Oil Mini May Contract ExpiryAs a derivatives trader and the developer behind MRISKA DTS5, I'm thrilled to share some fascinating insights from the recent expiry of the MCX Crude Oil Mini May futures contract. Let's delve into the observations and what they mean for the world of derivatives trading.
Death Level Signals Potential Breakdown:
During the expiry analysis, MRISKA DTS5 calculated the "Death Level" for June's contract at ₹5742 per barrel. Breaking this level in any upcoming session would indicate a high probability of a breakdown, signaling a continuation of the bearish trend. It's essential to monitor the price action closely for potential trading opportunities.
Safe Level Hints at Potential Breakout:
MRISKA DTS5 also revealed the "Safe Level" for June's contract at ₹5974 per barrel. If the price surpasses this level in any upcoming session, it signifies a high probability of an up-move and breakout. This could potentially mark the end of the existing bearish trend and open doors to substantial demand for Crude Oil.
Market Dynamics: The Closing Price:
On 19th May 2023, the Crude Oil Mini June contract closed at ₹5932 per barrel. This closing price, just below the Safe Level, indicates a delicate balance in the market. Traders should remain vigilant as it may set the tone for the upcoming sessions.
Navigating the Uncertainty:
In this highly volatile market, it's crucial to stay informed and adapt to changing market dynamics. Keeping a close eye on the Death Level and Safe Level can help traders identify potential breakout opportunities and manage risk effectively.
Remember, the world of derivatives trading is ever-evolving, and these observations are valuable tools to navigate the volatility. Stay tuned for more insights and updates as we continue to decode the intricacies of the market.
Disclaimer: The observations provided here are based on historical data and market analysis. It's important to conduct thorough research, consult professionals, and formulate your own trading strategies before making any investment decisions.

META OptionTrading Analysis for JAN2023Expecting Meta to go downside till 122-120
Buy PE 20 JAN 2023 @ 3.75
SL above recent high of 129

Tesla Option Trading Analysis for JAN 2023Expecting Tesla upside 120-125-128
in coming days.
If market recovers are selloff last month, then targets can be achieved
before the expiry of JAN 2023.
Currently, TSLA (20-01-23)* CE is trading @ 4.70
Delta is 0.44
SL will be below the recent low of 104.
*Call (TSLA 230120C00120000)

Nifty: December monthly Expiry view Nifty
- Nifty has had a nice pullback from the lows of 17780 odd levels this week
- today it respected 50 day EMA at 18164 odd levels
- Will the pullback continue or will it stop???
Let's look at Futures and Options data
____________________________________________________________________________________
F&O Data analysis
____________________________________________________________________________________
Futures Data
- Retail participants booked profits / exited 4.4 K Long Contracts & added 7.67 K Short contracts
- FIIs added merely 580 Long Contracts and exited from 2.80 K Short Contracts
- Pro traders added 5.32 K Long contracts and exited from 1.09 K Short contracts
Call Option
- Retail participants added 5.93 Lakhs Call Long Contracts & added 4.82 Lakh Call Short contracts
- FIIs added 2 K Call Long Contracts and added only 778 Call Short Contracts
- Pro traders added 92.56 K Call Long contracts and added 2.04 Lakh Call Short contracts
Put Option
- Retail participants added 3.85 Lakh Put Long Contracts & added 3.80 Lakh Put Short contracts
- FIIs added 5.43 K Put Long Contracts and added 11.85 K Short Contracts
- Pro traders added 70.15 K Put Long contracts and added 88.14 K Put Short contracts
Put Call ratio is at 1.13 (Neutral zone)
____________________________________________________________________________________
What we make from the data reading...
Retail traders have been exiting from Long position since last 3 days.
FIIs are in holiday mood ( not trading actively in F&O)
Pro traders have been exiting from short positions in Futures in last 3 days and have added Long position in Futures today. They have used Options to hedge their position.
____________________________________________________________________________________
Conclusion and important levels for the day
As I am writing, our Dow baba (Dow Jones) is down 300 points, but based on Nifty Chart set up and F&O data, prima facie I'm not expecting a big down fall.
The battle is our space in between Pro traders and retail traders.
My closing figure for Nifty expiry day
On the lower side 18048 / 18033 / 18011
On the upper side 18155 / 18181 / 18233
With tomorrow being expiry day, pls understand Markets are dynamic and data changes every moment. This view can change during market hours and I may or may not be able to update the same. Trading Options on expiry day require more skills, more study and then there is luck that may favor you :-).
Pls do your research and follow risk management. Read the disclaimer carefully.
____________________________________________________________________________________
Do let me know if you find the analysis and insights helpful.
Like and Follow for more ideas like these...!!!
Take care & safe trading...!!!
Disclaimer
- The view expressed here is my personal view
- Past performance is not a guarantee for future predictions
- I have been wrong in the past and can be wrong again in future too
- Use this for educational purpose
- Any decision you take, you need to take responsibility for the same
- It's your hard earned money. Treat it wisely
- Trade / Invest keeping in mind your trading style, goals and objectives, time horizon & risk tolerance
- if trading in F&O, understand that F&O trading involves risk
- Do take proper risk management measures
- Do your own analysis and consult your financial adviser if need be

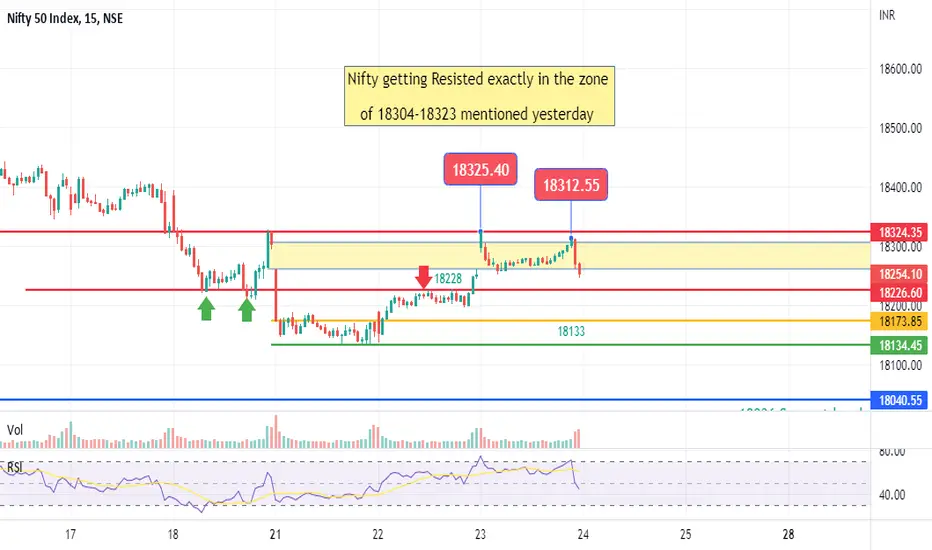
Nifty: Moving on expected linesNifty
Yesterday I had given important levels for Nifty
18228 - It respected the level for the whole day and gave a breakout in last 1/2 hour of trade
Above 18228 the next level given was 18304-18323 zone
Today Nifty opened at 18325 and immediately retraced and traded the whole day in the yellow zone ( again the yellow zone has been marked in yesterday's analysis.
Trust the analysis has been helpful in not being a blind bull in Nifty.
Still sticking to the view of expected expiry range between 18036-18323 with Nifty level of 18180 being very crucial.
Take care & safe trading...!!!
Types of participants in the derivatives marketHey everyone!
Last week we talked about the basics of derivatives and what all different derivative instruments are available in the markets. In this post, we will talk about the types of people who use derivatives and why they exist.
There are broadly three types of participants in the derivatives market:
→ Hedgers
→ Traders (also called speculators)
→ Arbitrageurs.
An individual may play different roles at different times.
Hedgers
→ They employ derivatives to mitigate the risk they suffer from fluctuations in the pricing of the underlying assets.
→ Institutions such as investment banks, central banks, hedge funds, etc. all use derivatives to hedge or reduce their exposures to market variables such as currency exchange rates, interest rates, equity values, bond prices, and commodity prices.
Speculators/Traders
→ The speculators are primary participants in the futures market.
→ They try to predict the future movements in prices of underlying assets and position themselves accordingly.
→ Speculators can be individual traders, proprietary trading firms, hedge funds, or market makers.
Arbitrageurs
→ Arbitrage is a deal that produces profit by exploiting a price difference in a product in two different markets.
→ Arbitrage occurs when a trader executes a simultaneous purchase and sale of the same asset in different markets in order to gain from tiny price differences between them.
→ The arbitrage trade is often short lives because the arbitrageurs would rush in executing these transactions, thereby closing the price gap at different locations.
Thanks for reading! Hope this was helpful.
See you all next week. 🙂
– Team TradingView
Feel free to check us out on Twitter , Instagram , and YouTube for more awesome content! 💘

Basics of DerivativesEver wonder what derivatives are? Check out this handy guide! 😉
A derivative is a contract or a product whose value is derived from the value of some other asset known as underlying. A variety of underlying assets serve as the foundation for derivatives.
These include:
→ Financial assets such as Shares, Bonds, and Foreign Exchange.
→ Metals such as Copper, Zinc, Gold, Silver, etc.
→ Energy resources such as Crude oil, Natural Gas, etc.
→ Agricultural products such as Wheat, Cotton, Sugar, Coffee, etc.
Cotton Futures
Gold Futures
Derivative Instruments
Forwards
It is a contractual agreement between two parties to buy/sell an underlying asset at a certain future date for a particular price that is pre-decided on the date of the contract.
Both the contracting parties are committed and are obliged to honor the transaction irrespective of the price of the underlying asset at the time of delivery. The terms and conditions of the contract are customized to cater to the needs of both parties. These are Over-the-counter (OTC) contracts, meaning they are a deal you make directly with a bank or a dealer. As a result, there is always counterparty risk involved.
Futures
Futures are standardized contracts similar to a forward contract, except that the deal is made through an organized and regulated exchange rather than being negotiated directly between two parties. The arrangements come with a fixed maturity date along with uniform terms for all the parties involved.
In simple language, futures are exchange traded forward contracts. The futures contract has little to no counterparty risk since the exchange is acting as a mediatory.
Options
An Option is a contract that gives the right, but not an obligation, to buy or sell the underlying on or before a fixed date and at a stated price. While the buyer of the option pays the premium and buys the right, the writer/seller of the option receives the premium with the obligation to sell/ buy the underlying asset if the buyer exercises his right.
There are two types of options:
→ American
→ European
American options can be exercised at any time prior to their expiration while the European options can only be exercised on the expiration date. In India, European options are used.
Swaps
A swap is an agreement made between two parties to exchange cash flows in the future according to a prearranged formula. A random variable (such as an interest rate, foreign exchange rate, commodity price, etc.) is used to determine at least one of these series of cash flows at the moment the contract is initiated.
Swaps are, broadly speaking, a series of forward contracts. They help the participants manage risk associated with volatile interest rates, currency exchange rates, and commodity prices.
Thanks for reading! Next week we’ll talk about the types of people who use derivatives and why they exist. Stay tuned!
See you all next week. 🙂
– Team TradingView
Feel free to check us out on Instagram , YouTube , and Telegram for more awesome content! 💘

NIFTY INTRADAY SUPPORT & RESISTANCE LEVELS FOR [17-05-2022]NSE:NIFTY1!
Nifty consolidated in today's session and formed a symmetrical triangle, breakout is expected in tomorrow's session.
Nifty analysis important levels are marked on the chart.
please always trade with stop loss to avoid big drawdown.
Happy trading & keep learning

Reliance: Chart set up & trading strategy for July F&O expiryReliance
The stock recently made a high of 2261
On the lower side, 2067 / 2000 are important support levels
Given the set up
One may consider the following Short strangle strategy for July series
Sell 29 July expiry 2260 Call option around 35
Sell 29 July expiry 2000 Put option around 25
Max profit potential of Rs 15000 per strategy lot till expiry (approximately 14% ROI)
Loss in strategy only if Closing on 29 July is either above 2320 or below 1940
Take care & safe trading...!!!
Disclaimer
- The view expressed here is my personal view
- Past performance is not a guarantee for future predictions
- Use this for educational purpose
- Any decision you take, you need to take responsibility for the same
- It's your hard earned money. Treat it wisely
- Trade / Invest keeping in mind your trading style, goals and objectives, time horizon & risk tolerance
- if trading in F&O, understand that F&O trading involves risk
- Do take proper risk management measures
- Do your own analysis and consult your financial adviser if need be

Titan LongGave a massive breakout. It is not wise to jump into the trade right away since SL will be huge.
Traders with FOMO can add 30% of their usual allocation at this level and add more if there is retest of the previous resistance zone.
Tgram: Stocks 101

Nifty: Writing was on the wall...!!!Nifty
The current drop might have surprised you but have a look at this data below and see for yourself how each participants had positioned themselves on Friday and decide for yourself if you had access to this valuable information before trade could you have done better...?
This data analysis will tell you how various participants Retail, FIIs and Proprietary traders positioned themselves on Friday and answer your questions as to What happened today?
Call Option data
- Retail participants added 2.17 lakhs Call option and added 1.85 lakh Call short position
- FIIs added 34.84 K Call Long and added 25.83 K Call Short position
- Proprietary traders added 62.4 K Call Long and added 1.03 Lakh Call Short position
Put Option data
- Retail participants added 1.18 Put Long option and added 1.44 Lakh Call short position
- FIIs added 27.63 K Put long & added 12.89 K Put short
- Proprietary traders added 35.96 K Put Long & added 24.8K Put Short position
If you see Retail participants were Call Buyers and Put sellers (which means they were super bullish)
where as FIIs and & Proprietary traders were more inclined towards buying Puts and selling Call Options (meaning they were bearish on the market)
- Who do you think so trades with more knowledge?
- who do you think so has more financial muscle?💪
We had 2 powerful sources the FIIs and Proprietary traders inclined towards Shorts and the Herd mentality of Retail Participants inclined towards Buy side...
What do you prefer?
- trade against the powerful and lose
- or trade with winners and increase your chances of winning
This data can help you avoid Hope based trading and making mistakes. It's not too late. Start trading with knowledge. To get access to our detailed F&O data analysis on a daily End of Day basis Message in private
Only those who are serious may message
Others who don't want to change may kindly ignore 🙏
Best wishes
Follow and Hit the Like button...!!!

BHARTI AIRTEL Consolidation!Bharti Airtel is consolidating in a zone. The no trade zone and targets for either side breakout is mentioned.

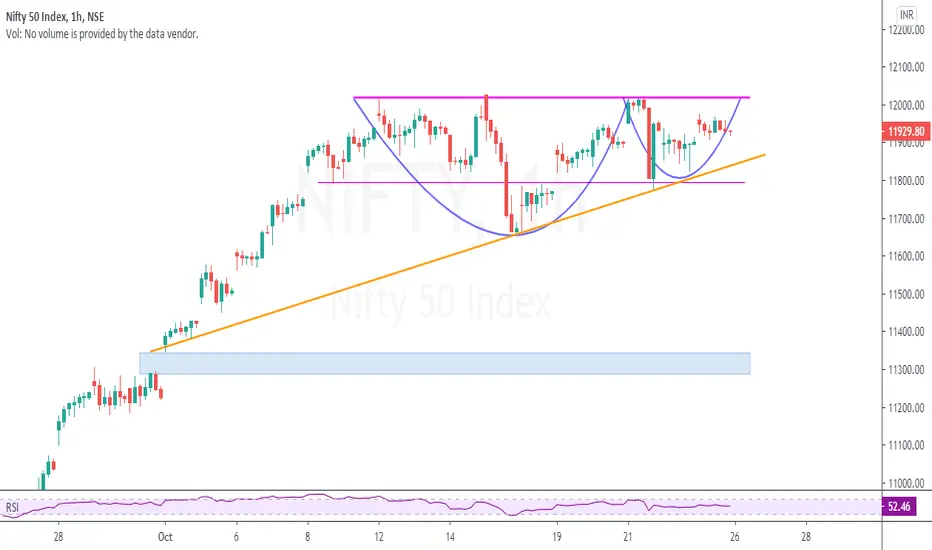
NIFTY | Cup & Handle in hourly chartNIFTY | Cup & Handle in hourly chart. Consider taking with spread instead of buying naked options for positional.
CMP : 11930
UBL Positional Long Trade SetupTrend Line Support Zone ~ 960 Derivatives Data Suggest Strong Support ~ 960. Entry Levels ~ 960, 965, Stop ~ 945, Target ~ 1020, 1040

F&O data analysis & Nifty strategy for 16th April weekly expiryIn our previous post we had highlighted the importance of 8986-9027 level. That level is still being respected. Nifty has closed in the said range at 8993.
Let’s see what data has to say for the expiry week 16th April 2020.
FIIs sold 8.46K contracts worth 474.69 Cr.
FIIs booked profits and squared off 7489 Long Contracts and they added just 979 Short contracts.
Retail Clients added 5507 Long contracts and exited 11312 contracts from Short position.
Pro traders squared off 2226 Long contracts and added 4181 Short contracts.
------------------------------------------------------------------------------------------------------------------------------------------------
Option Data Analysis
On the Call option front FIIs bought 7318 Long Contracts and added 6010 Call Short Position.
Retail traders were again active in Call Options adding 1.06 Lakhs Long contracts and adding 89.3K Short contracts.
Pro traders bought 21.6K Call Long and also created fresh 40.50K Short Contracts.
------------------------------------------------------------------------------------------------------------------------------------------------
On the Put Option front, FIIs bought 8565 Put Long contracts and also added 5466 Put Short contracts.
Retail traders added 93.7K Put Long and created 85.2K Put Short contracts.
Pro traders have bought 23.9K Put Contracts and added 35.5K Put Short Contracts.
Prima facie, it looks like Retail traders are expecting a big move, although, are not sure in which direction. FIIs are still playing it light and Pro traders are playing for a range bound movement.
The broader range is 8500-9500. However, considering Tuesday is a holiday and looking at the activity there is a strong probability of expiry between 8788 on the lower side & 9185-9233 levels on the upper side.
So that's our view.
Aggressive traders may consider the following strategy
Sell Nifty 8800 Put option 16 April expiry
Price range: 100-120
& simultaneously
Sell Nifty 9200 Put option 16 April
Price range : 90-100
The strategy will have maximum profit potential of Rs 14250 – Rs 16500/-
In built loss protection for a fall up to 8610-8580 or for a rise up to 9390-9420 in Nifty levels on 16th April 2020.
Tomorrow being a holiday Will update further in this thread on Wednesday morning.
Keep watching... Do hit the Like button and comment below
Take care & safe trading…!!!

Nifty strategy in this volatile marketNifty
CMP 7765
Nifty has been very volatile and it has been swinging 500 points just like that....
What use to take months now is happening in a couple of hours...
So what can one do in such situation
Option 1 is stay away from market
Option 2
Trade with more focus on risk management.
For the current market conditions
One may consider the following strategy
Sell Nifty Put Option
Lot Size:75
Expiry: 30 April 2020
Strike Price: 6100
CMP 250
Any price above 6100 in Nifty on 30 April 2020 can yield a
Maximum profit potential of Rs 18750/- (Profit potential of approximately 30% on margin ) per lot
Loss in strategy only if Nifty closes below 5870 on 30 April 2020
That is a good 1800 points protection ( in simple words in built Protection against loss of Rs 135000/ -)
Take care & safe trading...!!!
Do hit the like button and follow us

