MANAPPURAM AT DIP Vanakkam Makkale. Manappuram finance at dip,long term focus panravanga ippo enter aga try pannalam and just first 30% only.
Thank you for following!!!
Dowtheory

AMRUTANJAN AT SUPPORTVanakkam Makkale. Amrutanjan bounced back from support of the trendline so expecting good upside from the scrip. But as i always say whatever we do must follow risk rewrad and money management. I personally lokoking to enter at lower levels according to market condition because dont forget that market is in bear territory. Have a profitable trade.
Comments your thoughts below and have any questions means kindly type below.
Thank you for following.

KEI FOR SWINGMakkale focus KEI for swing. And kindly don't forget that the market is still on sell on rise, so take trades cautiously with proper risk reward and money management.

ANGEL ONE FOCUS FOR SWINGMakkale we got an oppurtunity for swing in Angel One. Kindly try to buy at lower levels for margin of safety. As i always say whatever we do must follow risk rewrad and money management and also keep in mind that market is in bearish mode. So adapt accordingly. CHEERS!!
If you get something useful from my posts, Do LIKE,FOLLOW and SHARE to your friends and families.
Thank you for following!!!

LUX INDUSTRIES ACCUMULATIONMakkale we got another scrip from textilte sector and it's in hosiery business. Yes, we've to choose different sectors for long term purpose which is ''Diversifiy" our portfolio. I beleive that when the population increases and the hosiery business tend to emerge.
The scrip is none other than '' LUX INDUSTRIES'' wait for the marked levels and start accumulating first 30% here after the confirmation.
Do your own research also. CHEERS!!
If you get something useful from my post, kindly LIKE,FOLLOW and SHARE to your friends and families.
Thank you for following.

IEX ACCUMULATIONIEX is in good accumualtion level makkale. If anybody waiting to buy IEX, kindly can buy first 30% here makkale.
And for swing and short term kindly have a proper risk reward setup then enter.
Do your own analysis too.

Dow Bottom Broken - What to do nextDow Bottom Broken - What to do next. No one know the next market move but Dow theory tells us when to react.

[Positional] Dhanuka Agritech buy IdeaDhanuka Agritech seems to be moving in a parallel channel .
After the downtrend, it has reached it's demand zone as per parallel channel where it is currently consolidating indicating accumulation.
For high probability setup a trader should always wait for price to give confirmatory signal then act.
Buy trade can be taken when uptrend is confirmed by dow theory. So, when price will go above it's previous high 791 we can initiate a buy trade with stoploss as previous swing low 704.
Target at top of the channel comes near 1070 making a very attractive R:R of 1:3

WATERBASE | Trend reversal - Trying to capture 10% WATERBASE | Trend reversal - Trying to capture 10%
CMP : 108
SL : 102
Target : 122
Almost 1:3 risk reward setup

Higher High Higher Low Formation. Swing trade ideaStock was moving down but now in 1hr timeframe the stock has formed a Higher High Higher Low structure and can be added for a swing trade as per Dow Theory

Higher High Higher Low Formation. Strong CandleStock was in correction mode. But in lower timeframe, the stock has formed HH HL structure and given a good close. Can be a good entry trigger

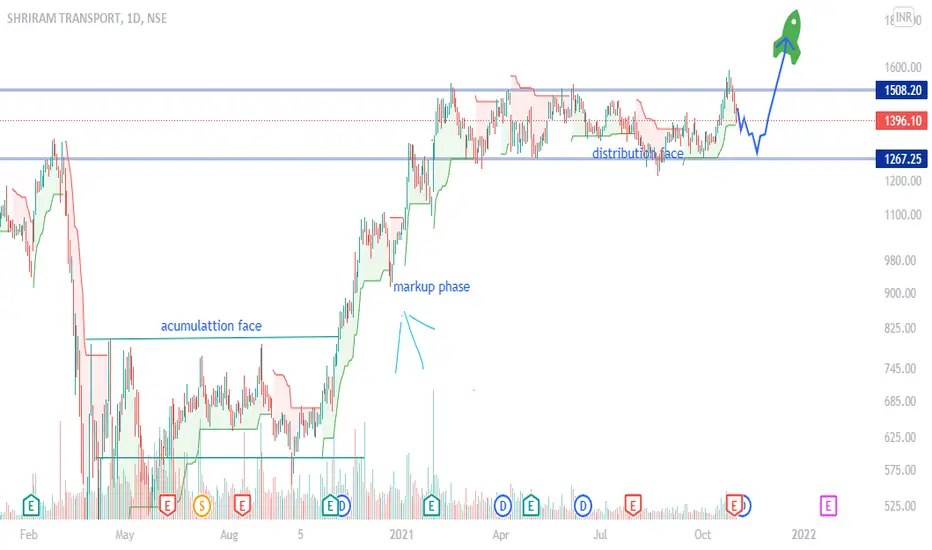
Accumulation & Distribution Levels - DOW THEORY Dow Theory - Accumulation and Distribution
Accumulation is marked by resource-rich participants accumulating the stock at lower levels when other participants are fearful
Distribution is marked by resource-rich participants de-liquidating the stock at higher levels when other participants are greedy

dow theory according dow theory it can come near 1200 and can bounce back and it will break the resisitance of 1508
Route Mobile - Low Risk SetupThe stock was in uptrend since its IPO. Recently after some strong candles the stock was moving sideways. Today the stock has come out of that sideways movement and formed HH HL structure. Can be a low risk entry here.

Uflex - Trendline BreakoutStock was in consolidation. today it has given breakout above trendline and also formed a HH HL structure

NIFTY Trading Cycle - Accumulation/Markup/Distribution/Markdown Educational:
According to Dow Theory, the bull markets are trade with three distinct phases, which are self-repeating. These are called the Accumulation phase, the Markup phase, and the Distribution phase. Initial 2 phases we seen 2 time repeating on the nifty's bull rally. Now we need to focus on 3rd phase which can be distribution phase after this 2 cycles.
Disclaimer: Consider this post for educational purpose only. Which helps you to understand different phases of market. Not recommended to buy/sell any position by considering this post. Before taking any decision firstly take advice from your financial advisor. Thank You!

Sequent Scientific Weekly View1) Weekly Trendline Support Broken.
2) Entered into Stage III - Consolidation/Minor correction.
3) Taking Support at 225.
4) If we apply Dow Theory:
(i) A close below previous swing low (HL/214) may result in change of Trend. Which is Stage IV - Downtrend. OR
(ii) Stage III may continue for a while before it enters next Stage II - Uptrend.

EID parry ready for a intraday spike.Looking at the history of its price action, EID parry might give a one day spike tomorrow.

Giant move expected in bank nifty by the end of the month.Bank nifty has been consolidating in a narrow range of 34093 to 36230 that is 6%, and if we look carefully there is a trendline from may 2020 which bank nifty respects and takes supports from, and in the past 10 days it has hit the upper poart of the channel that is 36230 on 7 occasions so we can expect a good move in bank nifty when it comes near to the trendline.

Why I am bullish on Airtel - Macro trend analysisThis is a long-term analysis for the telecommunications giant - Bharti Airtel .
There are two primary market trends in the broad perspective :
1. Uptrend/downtrend
2. Accumulation/ Distribution.
The accumulation phase is the boring phase , when smart investors accumulate positions and get in early. the uptrend/mark-up phase is the euphoria phase when the retail market participation increases, indicated by surge in volume, and smart investors slowly start unloading their positions, until the uptrend momentum has subsided, followed by a new accumulation phase and another possible mark-up, or a distribution phase followed by a downtrend, which is also known as a bear market. Till the time price has moved away from the range it has been trading in, we do not know whether the range is accumulative or distributive in nature.
As you can see in the chart, Bharti Airtel has been in an accumulation range for more than 10 years, and it seems as though we have finally successfully managed to break away from the range to the upside. The longer a stock has been in accumulation, the stronger the momentum once price breaks away from the range.
Let us see a stock that has done something similar. It is none other than, Reliance Industries .
You can clearly see how quickly the trend progressed after leaving the accumulation range.
Key takeaway points from the analysis and comparison
1. Airtel has been range bound for a longer period of time as compared to Reliance. This implies that Airtel has spent more time in the accumulation phase.
2. Airtel broke out of the range in early 2020, but threatened to fall back into the range, only to deviate back above and hold the range-high as support for several months. Deviation and reclaim as support is considered a strong bullish sign, indicating that buyers are stepping in to defend the range high as support.
3. Reliance never back-tested its range high as support before its second mark-up phase. Airtel back-testing range high as support is giving buyers more confidence that the stock is ready for price-discovery mode.
4. Volume analysis - Airtel has a better volume profile, with depleting low volume during accumulation phase and a surge in volume upon breakout attempt, and is showing continued volume strength. This setup was not seen in Reliance.
Conclusion
With this we can conclude that Airtel is giving us a nice bullish setup for a long term trend change shift and tackling new all time highs. The Indian stock market has been in a bull run ever since the year 2000, with corrections along the way (two major corrections in 2008 and 2020). As long as this macro bullish structure of the Indian market continues, we can expect Bharti Airtel to perform strongly in the coming years and have a similar run up as compared to Reliance Industries.
Thank you. Do leave a like/comment if you enjoyed the analysis.
Note: This is not financial advise. It is for educational/entertainment purposes only

CAMS for swing tradeCAMS is giving good returns from some time now and presently it is in a good range, anything below 3200 would be good buy.

IOC | Nice retracement after swing high breakout (Dow theory)IOC | Nice retracement after Swing High breakout (Dow theory)
CMP : 106
SL : 98
Target : 150, 160
P.S : I'm taking it for long time, allocated a small capital. Unless SL is hit i'm planning to hold for 1-2 years

#Gayatri Project #Gayatri Project
Looks good for short to medium term from current levels of 39
SL 26
Target 48
Looks as a money bagger to me
