MAZAGON DOCK ROUNDING BOTTOM BREAKOUTMazagon dock breaking rounding bottom
with huge volume, bullish RSI
defence sector in focus
#target 3250 after breaking 3150
NO BUY/SELL RECOMENDATION
Community ideas

Cup and Handle - ManappuramManappuram
Manappuram Finance is a Non-Banking Finance Company (NBFC), which provides a wide range of fund based and fee based services including gold loans, money exchange facilities, etc. The Company is a Systemically Important Non-Deposit taking NBFC(NBFC-ND).
Recent Important NEWS
Bain Capital will acquire an 18.6% stake in Manappuram Finance, a leading Indian gold loan company, through a primary infusion and secondary sale. The investment includes a mandatory open offer, potentially increasing Bain's stake to 41.7%. The deal, subject to regulatory approvals, aims to propel the company's growth.
Cup & Handle Pattern
Stock Weekly chart formed Cup and Handle pattern , retest confirmation also done 220 level. Expected target 350 and sustain above 500+++ possibility high. Duration 1 to 2 year. Stop loss continue 2 week closing based below 220.

Buy Data Patterns India Limited Short Term Trading Advice by Goodluck Capital
Buy Data Patterns India Limited
Buy Range- 2075 - 2222
Target- 2475 - 2550
StopLoss- below 1944
Upside Potential- 15% -20%
Approx trade duration 20 - 25 days

GRSE: New Trade opportunity for 40% upside potential!⚡️Price Analysis:
1️⃣ Price showing strength.
2️⃣ Price structure is bullish.
3️⃣ Price trading above EMAs
4️⃣ Strong candle formation.
✨ Key Observations:
➡️ RRR favourable at CMP.
➡️ Price should break above the marked resistance level
➡️ This will be my 2nd trade in this particular stock.
⚠️ Disclaimer: This is NOT a buy/sell recommendation. This post is meant for learning purposes only. Views are personal. Please, do your due diligence before investing.⚠️
💬 Share your thoughts in the comments below! ✌️
🔥Trade Safe!✅🚀

CASTROL technical analysisStock Overview: Castrol India Ltd, NSE, current price: INR 202.98. Castrol India Ltd is a prominent player in the manufacturing and marketing of automotive and industrial lubricants, greases, and related products, with a strong presence in the automotive sector.
Key Levels:
Support levels: INR 191.34, INR 169.85, INR 138.71.
Upside swing zone: INR 209.13.
Possible upside levels: INR 277.15, INR 308.30, INR 347.95.
Technical Indicators:
RSI (Relative Strength Index): The RSI is currently at 54.44, indicating a neutral stance. This suggests that the stock is neither overbought nor oversold, reflecting balanced momentum. Typically, RSI above 70 suggests overbought conditions, while below 30 indicates oversold zones.
Volume: The trading volume stands at 84.45M, showcasing active investor participation. Higher peaks in trading volume highlight periods of heightened investor interest, which may signal forthcoming price volatility or pivotal movements.
Sector and Market Context: Operating in the lubricants industry, Castrol India Ltd’s performance is closely tied to automotive production and industrial activity. The automotive sector, being sensitive to consumer demand, technological shifts, and regulatory influences, is currently witnessing a mix of recovery and innovation trends. The overall market reflects a cautious optimism, with moderate growth visible in some segments despite macroeconomic headwinds. Castrol's position as a lubricant leader aligns it well with the sector's evolving demands, though the sector remains subject to fluctuations tied to global oil prices and economic cycles.
Risk Considerations:
Market Volatility: Rapid shifts in market sentiment could lead to unpredictable price fluctuations.
Economic Dependency: Any downturn in industrial or automotive production could directly impact demand for lubricants.
Regulatory Policies: New environmental or industry regulations could pose challenges to operations.
Commodity Price Risks: Variability in crude oil prices could influence input costs, affecting margins.
Analysis Summary: Castrol India Ltd reflects a steady technical stance with firm support levels offering resilience. Its potential upside levels and a positive swing zone indicate opportunities for momentum-based movements. The RSI’s neutral position suggests balanced momentum, while trading volumes emphasize active investor engagement. Factoring in sector dynamics and broader market conditions, the stock holds a balanced outlook. However, potential investors should remain mindful of broader market trends, sector-specific developments, and potential risks before making any decisions. This analysis provides a comprehensive perspective without any direct buy or sell recommendations.

From Bullish to Bearish: Coal India's Next MoveCurrently, Coal India has shifted its overall structure from a bullish trend to a bearish one. This transition indicates a significant change in market sentiment, suggesting that the strength which previously propelled the stock upwards has weakened. Now, the stock is exhibiting consolidation — moving within a range — as it prepares for the next major move.
Immediate Outlook:
From the current consolidation phase, I expect Coal India to experience a short-term upward movement. The stock could rally towards the 430–495 range. This area is crucial because it represents a discounted zone — a point where many investors might perceive value due to the previous downtrend. Essentially, this zone could act as a supply area where sellers may become active again, limiting further upside.
Medium to Long-Term Outlook:
Once Coal India reaches the 430–495 level, I anticipate selling pressure to increase significantly. As a result, the stock could reverse its short-term gains and continue its broader bearish trend. Based on my analysis, it is likely to break key support levels and potentially fall below 350 over time.
It’s important to continuously monitor price action, volume, and key resistance/support areas to validate this view as market dynamics can shift quickly.

Falling Wedge Breakout with Bullish Structure | 15-Min Chart🏦 HDFC BANK LTD – Falling Wedge Breakout with Bullish Structure | 15-Min Chart
📅 Date: April 25, 2025
📈 Timeframe: 15-Minute
🔍 Stock: HDFC Bank Ltd (NSE)
📌 Technical Overview:
HDFC Bank is showing signs of a potential bullish reversal on the 15-minute chart, forming a falling wedge pattern, which is typically known for reversal setups. Price action suggests a breakout from the wedge structure, with strong volume support.
🧩 Chart Pattern:
A clear Falling Wedge is identified using two converging trendlines (red).
Within the wedge, price completed a potential AB=CD harmonic structure, bottoming out near ₹1,891.
The breakout candle has closed above the upper trendline, signaling early strength.
🔍 Key Price Levels:
Support Zone: ₹1,891.80 (marked in red)
Immediate Resistance: ₹1,933.00 (green horizontal line)
CMP: ₹1,917.70
A sustained move above ₹1,933 may open room for further upside, potentially towards the ₹1,960–₹1,980 range as per the chart projection.
📊 Volume Analysis:
Noticeable pickup in green volume bars on the breakout candle.
This confirms growing interest and participation from the bulls.
🧠 Observational Bias:
As long as the price holds above ₹1,891 and sustains the breakout, the short-term trend appears to be tilting in favor of buyers. A retracement or retest of the wedge breakout zone may offer additional confirmation.

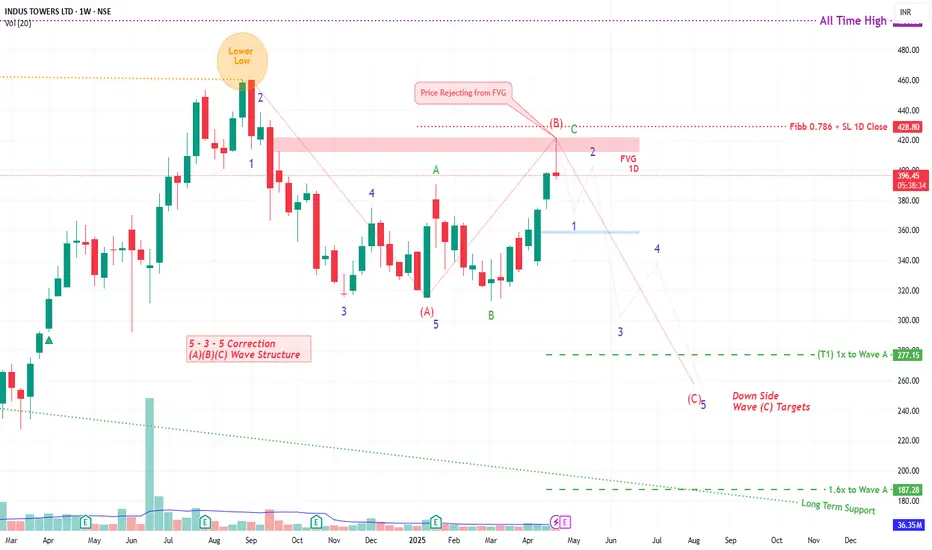
INDUS TOWER By KRS Charts25th April 2025 / 9:40 AM
Why INDUSTOWER??
1. Stock was reached its near ATH level but not able to hold the levels in Sep 2024 . From this point to today it seems like bullishness is getting weaker.
2. Wave Theory is saying Correction Wave ABC is ongoing and C is likely Started .
3. In support of more Correction from here FVG is visible in 1D TF and price are rejected from that level too.
4. Expecting correction from here in 5 Wave Structure towards downside.
Expected Targets and SL are mentioned in Chart
Note: This is Medium to Long Term View
L&T Finance - Getting ready for a blast L&T Finance is just short of a Breakout with Volume at the neckline. The short term and long term price action charts are also indicating the trend.
Due to following L&T Finance can head for first taget of INR 960 on a long term basis should the breakout occur.
1) 50 DMA will turn > 200 DMA
2) Price greater than supertrend and supertrend in Buy zone.
3) The rate of rise in Price 2025 is higher than last few years
4) Consistent rise in Price since last 3 sessions
5) MACD and RSI indicator are BUY zone
The analysis is for academic purpose and not a recommendation to invest.

Channel breakout for buy in APLAPOLLOThis is a channel breakout strategy for APLAPOLLO TUBES. RSI has been giving bullish signals, which means a breakout and retest of 1624 will activate a buying entry for the targets mentioned above. The ultimate target as per the pattern is 2024 in the longer term.
Targets in between are the recent lower highs like 1728, 1800+
Stop is when the price after breakout enters the channel again.

JUBLFOOD - DTFJUBLFOOD has returned from an old demand zone, making VCP pattern, need more contraction near supply zone, moving above 20ema.
Above 720 it looks good.
If you like my analysis, please follow me as a token of appreciation :)
in.tradingview.com/u/SatpalS/
For learning and educational purposes only, not trading advice. Please consult your financial advisor before investing.

Hindware - Keep On WatchCMP 200 on 22.04.25
The stock price has dropped more than 60% since August 2023. This time, it has been consolidating in a narrow range for the last two months.
If it gives a move upside after this consolidation, we may see the price of 245,345 or even more.
One should buy wisely in the range of 200-180, keeping the stop loss levels in mind. If it sustains below 175, the setup will show weakness.
Keep the position size according to the risk management.
All these illustrations are only for learning and sharing purposes, not a buy or sell recommendation in any way. It is only for paper trading.
All the best.

FORCEMOT Price action **Force Motors (FORCEMOT) Price Analysis – April 21, 2025**
**Current Price:** ₹9,229
**Trend:** Strong uptrend, up 40% in the past three months.
**Support:** ₹8,700–₹8,900
**Resistance:** ₹9,270 (previously ₹10,272, the 52-week high).
**Outlook:** Bullish above ₹9,000. A breakout above ₹9,270 could potentially retest the 52-week high.
**Summary:** The momentum is strong, and the trend remains positive unless the price falls below ₹8,700.

Unimech Aerospace cmp 1075 by Daily Chart view since listedKeep an eye on this stock counter for probable Resistance Zone Breakout
Unimech Aerospace cmp 1075 by Daily Chart view since listed
- Support Zone 960 to 1000 Price Band
- Bullish "W" or Double Bottom as one sees at 850 to 865 Price Band
- Gap Down Opening acting as Resistance Zone 1075 to 1135 Price Band
- Falling Resistance Trendline has been broken and price sustaining above it
- Gap Down Opening of 17-February-2025 acting as Resistance Zone Neckline

RCF is in bullish mode.RCF is forming evening star candle stick pattern on monthly chart.
As per chart it may test 240 soon as it is previous high level.
Returns around 78%.
As per report upcoming monsoon session will be better than expectation.
It is in Demand zone can long it for next 2-4 months.

BITCOIN back in action to new all time high!!!As per my analysis shows in the charts.
Btc is already breaking the levels and accumulating for days to shoot up higher.
My target is 103.5k and new all time high.
Just my view, the action should be taken by next week or else regret will sink you.
Price action already shows lots of valid points to go higher.
I think next week some big news will come. But price will show you before it comes.
Like and comment genuinely if you feel this will happen. If not just chill with summer.

The Nifty 50: A buy opportunityHello,
The Nifty 50 is an Indian stock market index that represents the float-weighted average of 50 of the largest Indian companies listed on the National Stock Exchange.
From the technical chart currently the Nifty 50 is undergoing a bigger correction. This presents a perfect opportunity for buyers to begin looking for opportunities to the upside. Additionally, the index has retraced by over 61.8% on the Fibs making it even a better confirmation for buys. Looking into the index constituents is also another great way of looking for opportunities.
We see an opportunity for buy entries at the current on lower levels. Another confirmation is the moving average & the MACD. both of them are confirming that the nifty index is at a great entry area since they are aligned by being below the price & also on the zero crossover.
As for macroeconomic concerns, particularly the fear surrounding Trump-era tariffs, we believe India remains relatively insulated. The country’s economy is largely driven by domestic consumption, which buffers it from global trade shocks
The Nifty 50 offers a compelling buying opportunity at current levels — a solid index to consider for upside exposure.

Pidilite Industries Ltd: Building Momentum Towards New Highs📊 Technical Analysis
Pidilite Industries, a dominant player in the adhesives and sealants market, has exhibited a consistent bullish trend over the past two decades, characterized by a pattern of higher highs and higher lows.
All-Time High Resistance: In September 2024, the stock created an all-time high of ₹3,415. Since then, it has faced resistance at this level.
Recent Correction and Support: Amidst a broader market correction starting in September 2024, Pidilite's stock retraced, forming a higher low around ₹2,650.
Positive Momentum: Following robust Q3 FY24 results, the stock has shown appreciation, forming a new higher low, indicating renewed bullish momentum.
Target Levels:
🎯 ₹3,200
🎯 ₹3,300
🎯 ₹3,415 (previous all-time high)
Stop-Loss: A prudent stop-loss can be placed at the recent higher low of ₹2,615.
🔍 Fundamental Analysis:
Pidilite Industries has delivered steady performance in Q3 FY24, reflecting its strong market positioning and resilient business model.
📌 Q3 FY24 Key Financial Highlights:
Total Income: ₹3,369 Cr (vs ₹3,235 Cr in Q2 FY24 and ₹3,130 Cr in Q3 FY23)
Total Expenses: ₹2,571 Cr (vs ₹2,467 Cr in Q2 FY24 and ₹2,388 Cr in Q3 FY23)
Total Operating Profits: ₹798 Cr (vs ₹768 Cr in Q2 FY24 and ₹742 Cr in Q3 FY23)
Profit Before Tax: ₹752 Cr (vs ₹725 Cr in Q2 FY24 and ₹687 Cr in Q3 FY23)
Profit After Tax: ₹557 Cr (vs ₹540 Cr in Q2 FY24 and ₹511 Cr in Q3 FY23)
Diluted Normalized EPS: ₹10.86 (vs ₹10.51 in Q2 FY24 and ₹10.04 in Q3 FY23)
Pidilite has consistently improved its earnings, driven by better volume growth and stable input costs. The Q3 performance reaffirms investor confidence and underlines the company's operational strength and profitability.
📈 Recent Performance Drivers
Volume Growth: The company reported a 9.7% underlying volume growth across categories and geographies, with the B2B segment showing strong momentum.
Margin Improvement: Gross margins improved by 100 basis points year-on-year, primarily due to benign input prices.
Operational Efficiency: The company commissioned additional manufacturing facilities, enhancing its production capabilities and distribution network.
📌 Conclusion
Pidilite Industries continues to demonstrate strong technical and fundamental performance. The formation of higher lows and the recent uptrend suggest potential for the stock to retest and possibly surpass its previous all-time high. Investors may consider monitoring the stock for a breakout above ₹3,415, with appropriate risk management strategies in place.
📜 Disclaimer
This report is for educational and informational purposes only. It does not constitute investment advice or a recommendation to buy or sell any stock. Please consult your financial advisor before making any investment decisions. Trading and investing in the stock market involve risk.

ADANI PORTS & SEZ LTD – Rectangle PatternADANI PORTS & SEZ LTD – Technical Chart Analysis
(As of April 16, 2025)
1. Pattern Structure and Breakout Observation
Adani Ports has formed a Rectangle Pattern over the last 4 months, consolidating between the ₹1200 resistance zone and the ₹1050 support zone. This pattern reflects a period of indecision and accumulation, typically resolved by a directional breakout.
- The stock has successfully broken out above the key horizontal resistance near ₹1200 on increased volume.
- This breakout indicates that the supply zone has been absorbed, and fresh demand is stepping in.
- The width of the rectangle (~₹150) gives us a projected target for the breakout, which places the next major upside zone around ₹1350.
This is a valid and tradable breakout, given the timeframe and price behavior.
2. Volume Analysis
Volume is confirming the strength of this breakout:
- On the breakout day, volume spiked sharply, which indicates strong institutional or smart money participation.
- Throughout the consolidation phase, volume remained controlled, suggesting accumulation rather than distribution.
- The volume thrust on breakout is a classical sign of pattern validation and buying strength.
Such volume behavior improves the reliability of the breakout and indicates potential for follow-through.
3. Candlestick Analysis
Candlesticks provide additional confirmation:
- The breakout candle is a bullish marubozu with little to no upper or lower wick, showing strong conviction and sustained demand throughout the trading day.
- Prior to breakout, we also saw a series of higher lows forming, which hinted at increasing buying pressure.
- No major rejection candles are visible at the breakout level, further strengthening the bullish case.
This candlestick structure reflects strong control by buyers at key resistance levels.
4. Key Trading Levels
- Breakout Level (Resistance Turned Support): ₹1200
- Support Zone: ₹1050 – This has held firm multiple times during the rectangle formation.
- Target 1: ₹1320 (Conservative target based on mid-pattern projection)
- Target 2: ₹1350–₹1360 (Full range breakout projection)
- Stop Loss: Below ₹1165 – recent swing low inside the pattern
These levels offer key zones for trade management and re-entry upon pullbacks.
5. Trade Setup and Strategy
The breakout is suited for swing and positional traders looking to capture medium-term moves.
- Entry Point: Above ₹1200–₹1210 zone. (Early breakout entries may already be filled, but pullbacks to ₹1210–₹1220 are still valid.)
- Stop Loss: Below ₹1165 to protect against false breakout and whipsaw.
- Target Zones: ₹1320 and ₹1350 as discussed.
- Risk-Reward Ratio: Currently stands close to 1:2.5, offering a well-aligned trade setup.
Traders can consider adding on dips toward the breakout zone with a tight stop.
6. Final Summary
Adani Ports has broken out of a 4-month Rectangle Pattern at ₹1200 with strong volume and momentum. This breakout marks the end of a consolidation phase and the beginning of a potential trend continuation or fresh upside leg.
The structure, supported by volume and bullish candlestick behavior, makes this a technically valid breakout. As long as the price holds above ₹1200, the sentiment remains bullish with scope toward ₹1320–₹1350.

Breakout Alert on Ntpc Green LTD🔹 Counter Trendline Breakout (CT BO)
Price action has broken a well-respected counter trendline, indicating a potential shift in momentum from bearish to bullish. This breakout isn’t just symbolic — it's backed by conviction.
🔹 Volume-Based Confirmation
Today's bullish candle comes with significantly high volume, suggesting institutional activity and strong buyer interest. Volume is one of the most critical confirmation tools in breakout trading — and it's speaking loud and clear here.
🔹 Low → Higher Low → Breakout
A major Low was established earlier.
Price then formed a Higher Low Zone, indicating accumulation and a potential trend reversal.
The breakout candle confirms the Higher High – Higher Low (HH-HL) market structure — a classic signal of trend reversal and early uptrend formation.
🔔 Add to your watchlist.
📍 Mark the breakout zone.
📈 Let price action guide your decision.

ETERNAL(ZOMATO)-Short term/positional long tradeStock has rejected trendline multiple times. From past 2 days it's holding near trendline and gone side ways.
If we see a breakout in 15th Apr'25 trading session it is good opportunity to go long.
Please avoid if goes below 218 or Opens gap down.
Please don't forget click on follow button so you won't miss any upcoming ideas.
Any confusion, feel free to drop msg. Happy to help :)
This is only for educational purpose, please manage your risk accordingly.

ACI - Double Bottom (Bullish)Archean chemical industries is a leading specialty marine chemical manufacturer in India focused on producing and exporting bromine, industrial salt, and sulphate of potash across the world. Archean is the largest exporter of bromine and industrial salt in India and has amongst the lowest cost of production globally in both bromine and industrial salt.
Fundamentally sound company with PEG 0.79, ROE, ROCE, ROIC > 15%.
Technicals: Price is above 200MA. Double bottom formation after bearish Head & Shoulder. Trendline is about to breakout. Volumes have been steady in daily chart over the last 5D. Both DII, FII institutions have been increasing the stakes steadily in every quarter. 161.8% fib level would be long term target of 1069 which is also pivot R3 in weekly timeframe. Pivot targets are shown on chart.
Disclaimer: Educational purpose.

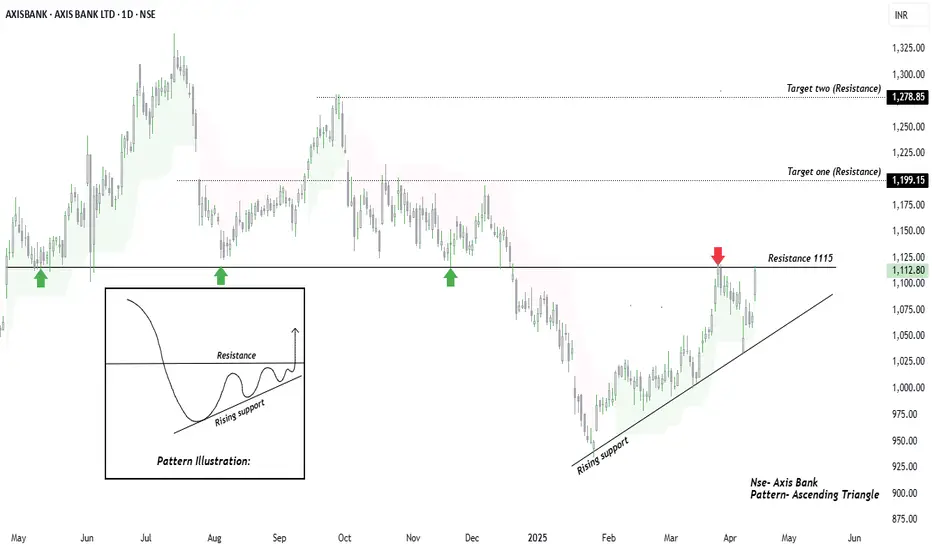
Triangle Tension: Axis at the EdgeHi friends! Sharing daily chart of Axis bank as we can see price is forming a classic Ascending triangle pattern on provided time farme a bullish setup that often signals accumulation before breakout and the price is pressing against a well established horizontal resistance which has historically acted as a strong support as marked by green arrows.
A decisive breakout above 1115 resistance backed by strong volume, could lead to a significant upward move toward marked targets. However if the price fails to break out we may see a retest of the rising trendline support.
This setup offers a clean structure for traders watching for a potential breakout or pullback entry. The pattern sketch in the chart serves as a visual reference for educational purposes.
Targets mentioned on provided chart and a good support can be consider a close below rising support line after breakout.
This idea is meant for only learning purpose.
Hope you like the publication, Thanks in advance.