GBPCAD - FALSE BREAKDOWN SIGNALS MORE UPSIDESymbol - GBPCAD
CMP - 1.8150
The GBPCAD pair is currently exhibiting a false breakdown of its trend support. In the context of a weakening US dollar, the British pound has entered a rally phase, which is advantageous for the currency pair.
Fundamentally, the outlook is favorable for both the GBP & CAD, given the ongoing depreciation of the dollar. During the current corrective phase, the pair is testing support levels without the potential for further downward movement. This correction is likely to conclude with a false breakdown and subsequent consolidation above the support level, within the established channel. If the bulls manage to maintain defense above the 1.8144 - 1.8230 range, the uptrend is expected to resume.
Key support levels: 1.8150, 1.7978
Key resistance levels: 1.8233, 1.8379
Given the prevailing uptrend, the relative strength of the currency pair amidst a weak dollar, and the occurrence of a false breakdown at support, it is reasonable to conclude that downward price movement is unlikely. Therefore, it is prudent to consider potential continuation of the uptrend.
Community ideas

Gold at 3244: Next Resistance 3255-3278-3298Tariff war at the centerstage, safe haven demand keeps bulls in absolute domination digging heels at psychological zone 3200 now and eyeing for extension towards next resistance zone 3255-3278-3298
Meanwhile, any drop below 3200 will indicate retracement towards support zone 3185-3165 which may act as local demand base until selling pressure gains momentum breaking this zone for a deeper correction 3125-3100-3060
Important: RSI on monthly time frame reads 84 urging caution ⚠️ on heights.

LAL PATH LAB technical analysisStock Overview: Dr. Lal Path Labs Ltd., NSE, current price: INR 2,667.75. Dr. Lal Path Labs Ltd. is a leading diagnostic and healthcare service provider in India, offering a wide range of tests and services.
Key Levels:
Support levels: INR 2,068.65, INR 1,476.85.
Upside swing zone: INR 2,710.75, INR 2,348.15.
Possible upside levels: INR 3,938.90, INR 4,530.70, INR 5,284.50, INR 7,461.35.
Technical Indicators:
RSI (Relative Strength Index) is at 50.20, indicating a neutral momentum.
Volume is at 2.6M, showing moderate trading activity.
MA (Moving Average) lines indicate the stock is currently above the long-term moving average, suggesting a potential upward trend.
Sector and Market Context: Dr. Lal Path Labs Ltd. operates in the healthcare sector, which has shown resilience and growth potential, especially in the post-pandemic era. The overall market trends indicate a cautious optimism with healthcare stocks generally performing well due to increased demand for diagnostic services.
Risk Considerations: Potential risks include regulatory changes, market volatility, and competition within the healthcare sector. Economic downturns or adverse events could also impact stock performance.
Analysis Summary: Dr. Lal Path Labs Ltd. shows a balanced technical outlook with key support levels providing a safety net and potential upside levels indicating room for growth. The stock's performance is aligned with sector trends, but investors should remain cautious of market conditions and sector-specific risks.

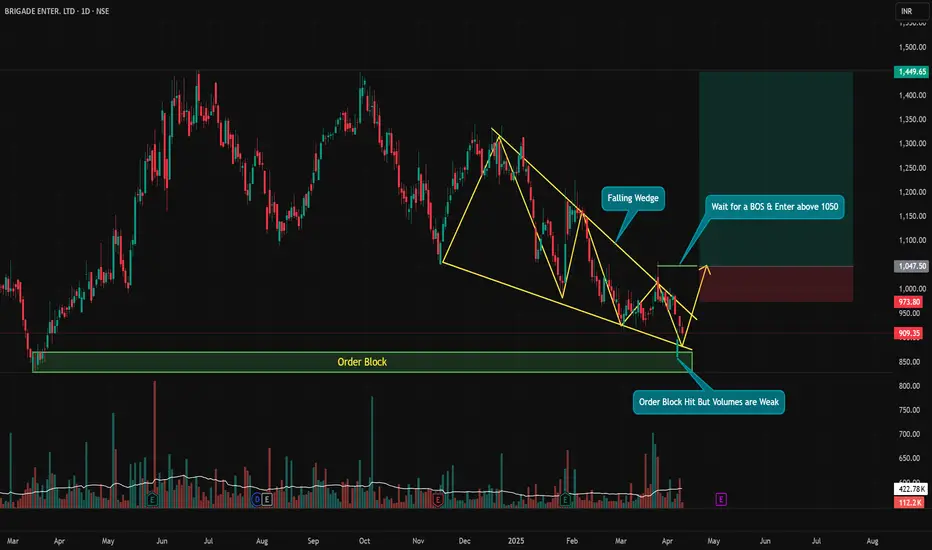
BRIGADE – Falling Wedge at Demand Zone, Waiting for BOSSetup Type: Reversal + Breakout Play | Conviction: Medium-High (Needs Confirmation)
Chart Framework: Smart Money + Classic TA
BRIGADE is showing signs of a potential trend reversal, but we’re not jumping in yet. Here's what the chart tells us:
🟡 Falling Wedge Formation – A bullish reversal pattern that typically resolves to the upside.
🟢 Tapped into a Strong Order Block – Smart money territory where previous accumulation took place.
🧲 Liquidity Grab Below Prior Lows, but... Volume on Bounce is Weak – Sign of caution.
📢 Analyst Rating: STRONG BUY – Adds institutional bias to the bullish setup.
🔐 No Confirmed Break of Structure Yet – Enter only after a clean breakout above ₹1050.
📈 Trade Plan:
Wait for a strong BOS (Break of Structure) and price closing above ₹1050 with volume.
Target zone near ₹1440+ aligns with measured move of wedge and previous supply.
⚠️ This is a setup with potential, but it’s not “ready” yet. Don't front-run smart money — let price confirm before jumping in. Risk management is a must.
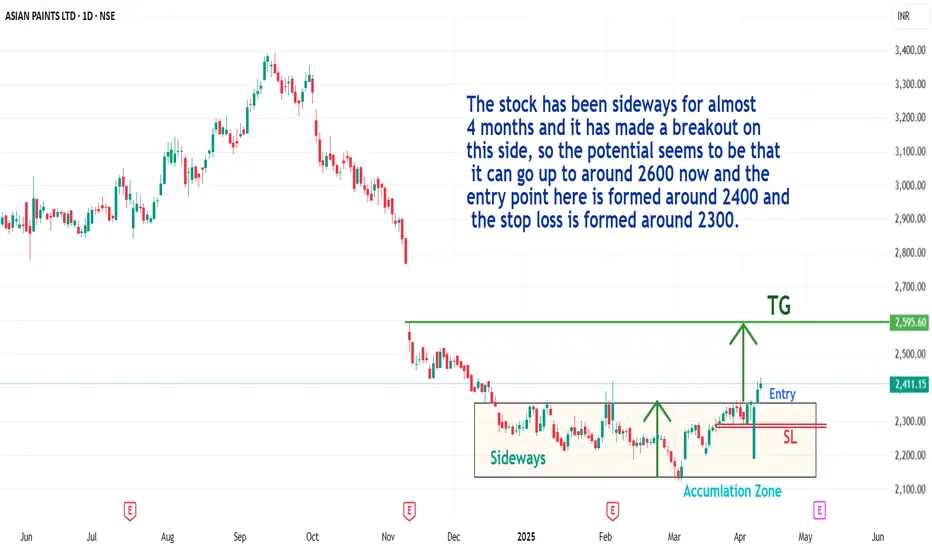
Asian paint stock 4 months sideways zone breakoutThe stock has been sideways for almost 4 months and it has made a breakout on this side, so the potential seems to be that it can go up to around 2600 now and the entry point here is formed around 2400 and the stop loss is formed around 2300.
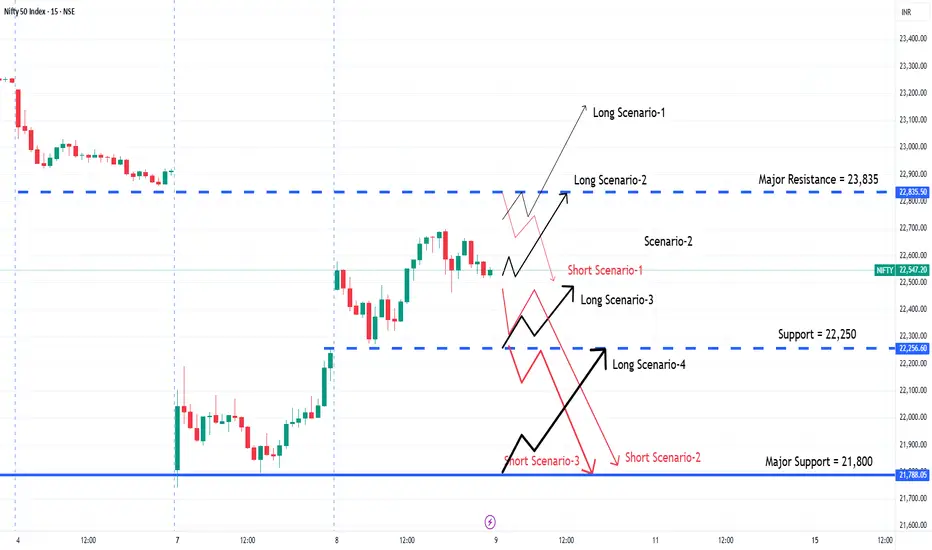
Nifty 50 - Intraday 09/04/2025 - Trading scenariosNifty 50
Different Trading scenarios for 09/04/2025
Meaning "Long Trade" = Market expected to move up
Meaning "Short Trade" = Market expected to move down
Meaning "PDH" = Previous day High
Meaning "PDL" = Previous day Low
The blow mentioned scenarios are valid only if the scenario is played out in longer time frame such as 15mins and above and is considered too risky to trade on shorter time frame such as 5mins.
The recommended trade decision time after the markets open for Novice traders is atleast 45mins to 125mins.
Scenario-1 (For long trade):
Market opens with gap up
sustains above PDH
Sustains above previous resistance 23,835
Stop loss = PDH
Scenario-2 (For long trade):
Market opens flat
sustains above previous session closing price = 22,550
Target = Major resistance 23,835 (The level from which huge gap down occurred)
Stop loss = 22,500
Scenario-3 (For long trade):
Market opens gap down
sustains above PDL closing price = 22,250
1st Target = 22,250 (needs to be crossed by a strong candle for further upward movement)
2nd target = 22,835 (Major resistance)
Stop loss = PDL (22,250)
Scenario-4 (For long trade):
Market opens with big gap down
sustains above "The Low of 07/04/2025 = 21,780
Target = 22,250 (This level is the breaking point between previous 2 sessions)
Stop loss = 21,780
Scenario-1 (For Short trade):
Market opens with gap up @ 23,835 (The level from which huge gap down occurred)
sustains below 23,835
Breaks PDH = 22,700
1st Target = 22,550 (closing of the previous session)
2nd Target = 22,550 (The breaking point between the previous 2 sessions)
Stop loss = 23,835
Scenario-2 (For Short trade):
Market opens flat @ 22,550
sustains below = 22,500 (closing of the previous session)
1st Target = 22,250 (PDL)
2nd Target = 21,800 (If The breaking point between the previous 2 sessions 22,250 is broken)
Stop loss = 21,600
Scenario-3 (For Short trade):
Market opens with gap down
sustains below = 22,300
Breaks PDL = 22,250 (The breaking point between the previous 2 sessions)
Target = 21,800 (Strong support area)
Stop loss = 22,300
Secario-4 (For short trade)
If the market opens around 21,800 and if this price broken down, then the market can have a free fall and will be a perfect short trade
Regards,
Uday
Disclaimer: I am not a SEBI registered analyst. The above information is only for educational purpose based on my years of experience. Please consult a financial advisor before investing.
Nifty Bottom Forming? “Be Greedy When Others Are Fearful”Hello Everyone, i hope you all will be doing good in your life and your trading as well. Let's discuss about nifty and analysis some next move.
Guy's after a sharp correction in Nifty, signs of a potential bottom are finally emerging. Yesterday’s price action, supported by strong volume and the appearance of an Abandoned Baby candlestick pattern , indicates that we might have witnessed a key reversal day. The price held firm near a crucial support zone, and with most stocks near 52-week lows, we could be staring at a solid bounce opportunity.
This is exactly when smart money starts accumulating — when fear is high and hope is low. A price rally towards the upper channel resistance looks probable, provided Nifty sustains above the breakout zone.
echnical Highlights:
Reversal Signal: Formation of Abandoned Baby pattern near support
Volume Spike: Indicates possible institutional buying near bottom
Support Zone: Price reversed from key area, aligning with earlier channel lows
Resistance Target: 23,200-23,300 – upper boundary of the falling channel
Market Outlook:
With the broader market showing deep corrections across sectors (some 30–35% down from highs), this zone could be a powerful accumulation range. From Banking, Pharma, Chemicals, to IT and FMCG , many sectors are offering long-term value. As global sentiment improves and short-term panic fades, we may see Nifty lead a recovery move supported by sector rotation.
Rahul’s Tip
Bottoms aren’t confirmed by green candles alone, but by conviction + price behavior near support. Stay calm, follow structure, and let the chart do the talking.
Disclaimer: This analysis is for educational purposes only. Please consult a financial advisor before making investment decisions.
If you Found this helpful? Don’t forget to like, share. And Do you think this was the bottom for Nifty? Drop your thoughts and let’s discuss below!

Gold Breaks Below 3000: Weekly Support at 2950-60 Now CriticalGold is showing weakness and breaking down supports on daily closing basis, as expected and explained in my previous posts and weekly analysis video. Gold has now trading below two major support levels - the first at 3050-60 and the second at 3000-20. Yesterday price closed under 3000 on a daily basis, which clearly signals weakness in the market.
As discussed in my weekly analysis video, price is now testing the first weekly support at the 2950-60 area. I've made some changes to my mapping based on recent price action. Previously, I expected price to hold at 3000 on daily charts, but since it has already closed below 3000, we now need to watch the 2950-60 zone for possible retracement/pullback signs.
I expect this pullback to begin soon (within the next 2-4 trading days), and during this period, I anticipate gold will maintain its weakness/correction trend.

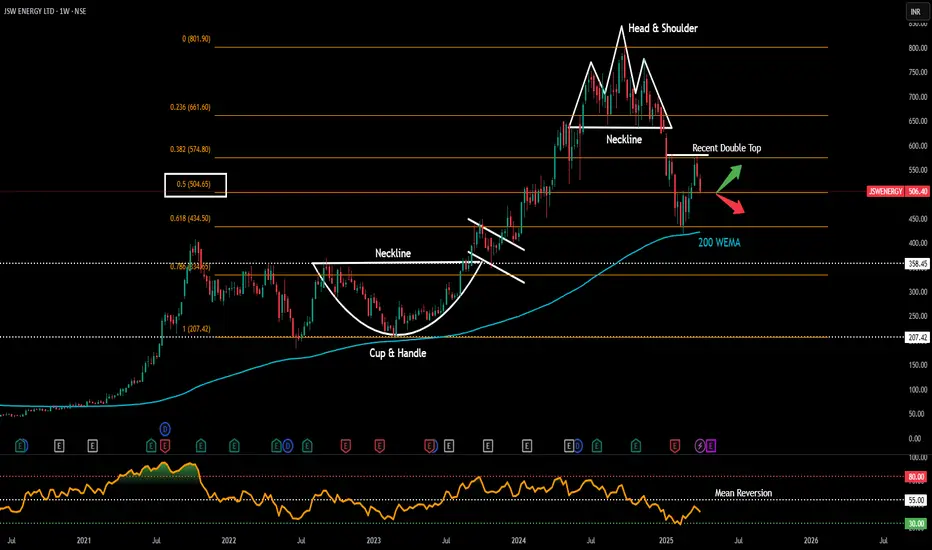
JSW Energy LtdDate 06.04.2025
Jsw Energy
Timeframe : Weekly
Business Segments
1 Thermal Energy Projects - 63% - Capacity of 3,508 MW
2 Renewable Energy Projects -36% - Renewable energy capacity of 4,232 MW
3 Other Assets - 1%
Operational Metrics
1 Net Generation-Thermal (MUs): 9,485 in H1 FY25 vs 18,526 in FY24
2 Thermal Plant Load Factor (PLF): 75% in H1 FY25 vs 76% in FY24
3 Net Generation-Renewable (MUs): 8,236 in H1 FY25 vs 9,336 in FY24
Expansion Projects Q2 FY25
Capacity Under-Construction:
1 Wind: 2,536 MW
2 Solar: 2,779 MW
3 Hybrid: 2,026 MW
4 Thermal: 350 MW
5 Hydro: 240 MW
Capacity in Pipeline:
1 Solar: 560 MW
2 Wind: 250 MW
3 Hybrid/FDRE: 2,730 MW
Debt Position
The company's net debt has increased from Rs. 6,963 Cr
Stock PE - 47.1
ROCE - 8.59 %
ROE - 8.40 %
1 Company has delivered good profit growth of 19.8% CAGR over last 5 years
2 Debtor days have improved from 37.0 to 26.8 days
3 Stock is trading at 3.16 times its book value
4 Company has a low return on equity of 8.66% over last 3 years
Technical Remarks :
1 Stock has respected 200 weekly exponential moving average
2 Recent double top at 580 on weekly chart
3 At present 50% of fibonacci is support/resistance
5 Below 50% is short & above 50% is long
6 Bearish crossover between 20 wema & 60 wema on weekly chart.
Regards,
Ankur
U.S. Dollar Index (DXY) –Key Resistance& Bearish Target Analysis📊 Key Observations:
🔵 Resistance Zone (📍~103.5 Level)
A strong resistance area (🔵 blue box) is marked, indicating potential selling pressure if the price reaches this level.
The price is moving upwards (📈) towards this resistance, so watch for rejection or breakout.
🔵 Support/Target Zone (📍~101.5 Level)
A lower support zone (🔵 blue box) is marked as the bearish target 🎯.
If the price fails at resistance, it may head downwards (📉) to this level.
📉 Recent Price Action:
🚀 Sharp drop followed by a rebound (📈).
The price is currently moving back up (🔼), possibly forming a lower high before another drop.
📌 Exponential Moving Average (DEMA 9 - 102.488)
The price is hovering above the 9-period DEMA (📏), showing short-term bullish momentum.
If the price rejects resistance and falls below the DEMA, a bearish continuation (📉) is likely.
🚀 Potential Scenarios:
✅ Bullish Breakout: If price breaks above 🔵 resistance, it may continue rising (📈) to higher levels.
❌ Bearish Rejection: If price fails at resistance, expect a drop (📉) towards 101.5 🎯.

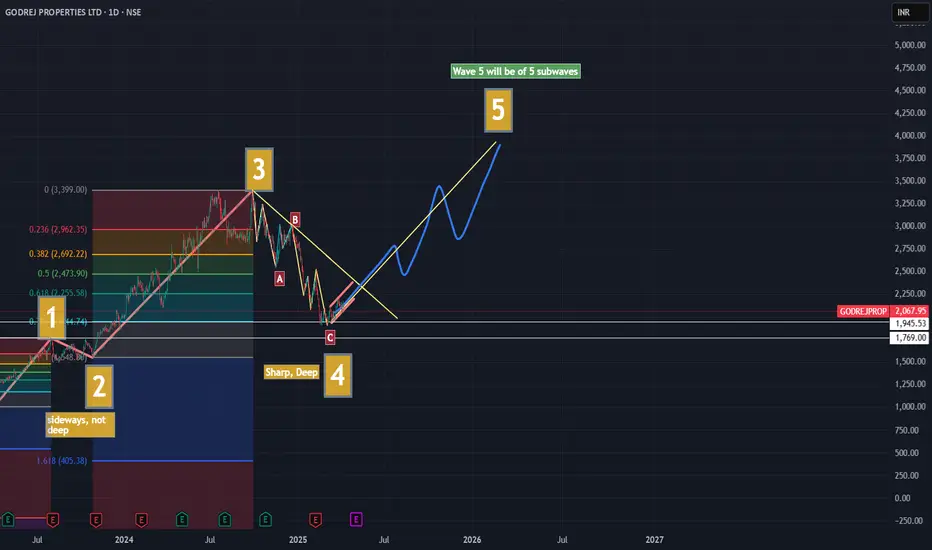
Godrej Properties is About to Start UptrendElliot Wave analysis of the stock shows following important things:
1. We are currently at the end of Wave 4 (Correction Wave)
2. Wave 2 was sideways and not deep. Thus as per the rule of alternation, the wave 4 was going to be sharp (zigzag) and deep. It has turned out to be so. It retraced as much as 78% of the Fibonacci levels.
3. Wave 4 - ABC had following waves -
- A - 3 Waves
- B - 3 Waves
- C - 5 Waves
Thus, the 3-3-5 Waves pattern has been established and verified.
What is current situation?
Currently, if analysis is correct, it is in the beginning of 5th Wave. It is ahead of Nifty 50 which is yet to start the 5th wave.
If it is not in beginning of 5th Wave, it still doesn't have much room anyway left to fall before it begins to reach into 1st Wave territory at 1769 Levels.
That is extremely unlikely event. If it happens so, then the wave count will change and entire 1st and 3rd wave will become 1st Wave.
This is my understanding. Open for the community views.
note: Personal Views only. No buy/sell recommendation.
Indian Hotels Resilient but Trend Turns CautiousTopic Statement:
Indian Hotels Company has shown resilience during the broad market correction, though a breach of the long-term trendline indicates a shift in trend.
Key Points:
- Long-term up-trendline has been breached, signaling a trend change.
- Candlesticks are moving in a down-trending channel.
- Stock often finds support and bounces back up near the 180-day EMA.

Indus Tower - Flag Breakout Overall most of the bad news for Indus Tower have been behind it post the Idea news where govt has converted the AGR dues.
Strong Business and business growth.
Buy @360-365 levels
SL 310
Target : 460-570-680
Long Term Trade (Above 18 months)
#Indus Tower

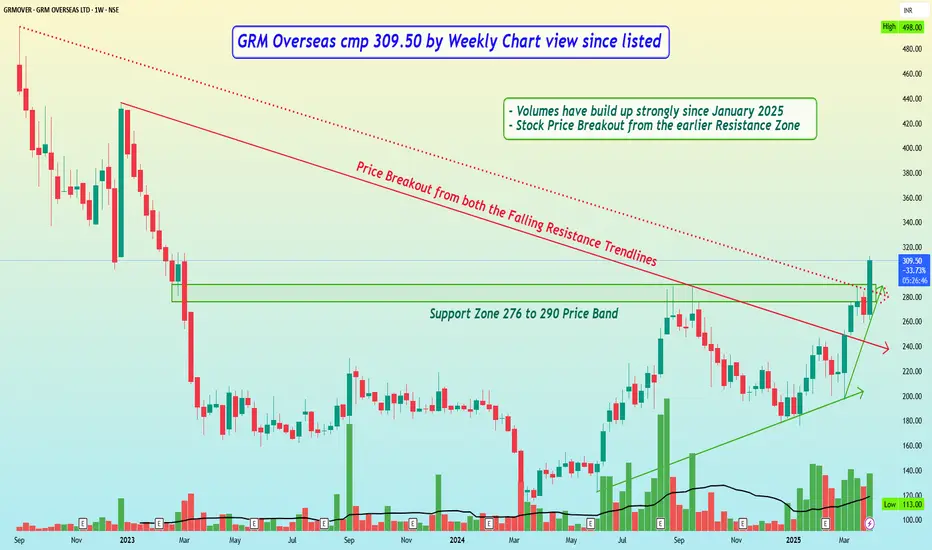
GRM Overseas cmp 309.50 by Weekly Chart view since listedGRM Overseas cmp 309.50 by Weekly Chart view since listed
- Volumes have build up strongly since January 2025
- Stock Price Breakout from the earlier Resistance Zone
- Support Zone 276 to 290 Price Band earlier Resistance Zone
- Price Breakout from both of the Falling Resistance Trendlines
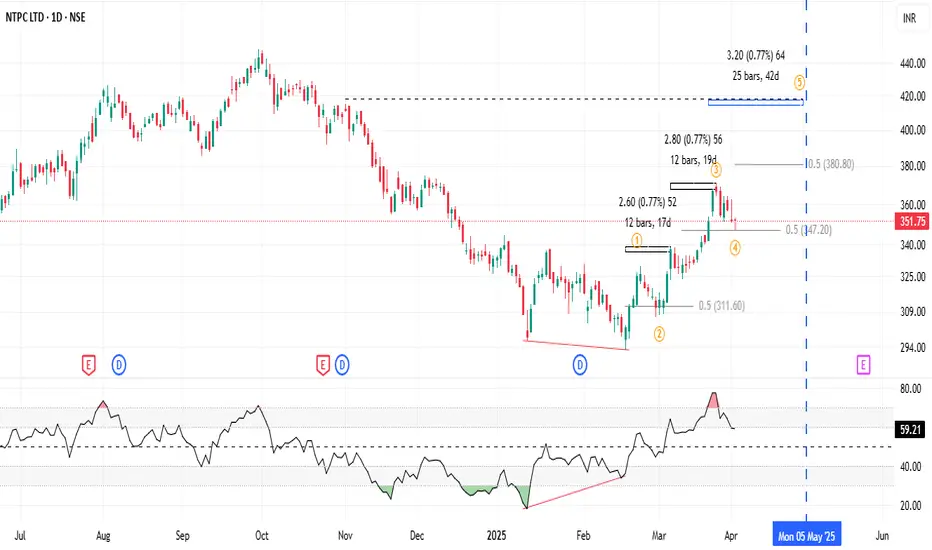
NTPC (Overarching Goal and Leadership)Based on the historical Data, NTPC has a comprehensive renewable energy expansion strategy with the ambitious goal of achieving **60 GW of renewable capacity by 2032 . This strategy involves several key components and focuses heavily on its subsidiary, NTPC Green Energy Limited (NGEL). Here is an outline of NTPC's renewable energy expansion strategy:
1. Overarching Goal and Leadership:
To be a leader in India's renewable energy sector and accelerate the nation's energy transition.
Achieve 60 GW of renewable capacity by 2032.
Consolidating its renewable energy portfolio under its wholly-owned subsidiary, NTPC Green Energy Limited (NGEL). NGEL is positioned as a key player in this expansion.
2. Key Entities and Subsidiaries:
NTPC Green Energy Limited (NGEL):The primary vehicle for NTPC's renewable energy expansion. Most future capacity additions are expected to come from NGEL.
NTPC Renewable Energy Limited (NTPC REL): A subsidiary of NGEL actively involved in securing and developing renewable energy projects, including solar and wind.
THDC India Limited and NEEPCO: Subsidiaries also contributing to the group's renewable energy capacity.
3. Capacity Addition Targets:
Significant ramp-up of renewable capacity: NGEL expects to reach around 3,088 MW in FY25, approximately 5 GW in FY26, and tentatively 8 GW in FY27.
Under-construction capacity:As of December 2024, the NTPC Group had 10.3 GW of renewable energy capacity under construction.
Ultra Mega Renewable Energy Power Parks (UMREPPs): Developing large-scale renewable energy parks in collaboration with state governments and other companies. Examples include parks in Gujarat (4.8 GW), DVC (0.7 GW), and Madhya Pradesh (0.6 GW) in advanced stages, with MOUs signed for over 50 GW capacity.
Focus on various renewable sources : A diverse portfolio including large-scale solar, floating solar, wind projects, and small hydro.
4. Methods and Approaches:
Organic Growth:Developing projects independently and through its subsidiaries.
Joint Ventures: Forming strategic partnerships with state power generation companies like Rajasthan Rajya Vidyut Utpadan Nigam Limited (RVUNL) for the development of renewable energy parks and green hydrogen projects (up to 25 GW capacity in Rajasthan) and with UPRVUNL in Uttar Pradesh.
Memorandums of Understanding (MOUs): Collaborating with state governments for investments in renewable energy projects, including solar, battery storage, and green hydrogen. Examples include MOUs with the Governments of Andhra Pradesh, Bihar, and Chhattisgarh.
Participating in Auctions and Tenders: Actively securing projects through competitive bidding, such as the solar power auctions by Uttar Pradesh Power Corporation Limited (UPPCL) and SECI won by NTPC REL. NTPC is also a Renewable Energy Implementing Agency (REIA) and issues tenders for renewable power projects.
Outsourcing: Utilizing outsourcing models for parallel capacity addition, with over 5 GW of solar capacity established and more under execution and tendering.
5. Focus Areas and Technologies:
Solar Energy: Significant focus on solar power, including ground-mounted and floating solar projects. NTPC already has the largest portfolio of floating solar projects.
Wind Energy: Developing wind power projects, including the first wind farm commissioned by NTPC REL. Actively participating in tenders for offshore wind projects and pursuing collaborations with global partners.
Energy Storage: Actively pursuing various forms of energy storage solutions, including Battery Energy Storage Systems (BESS) and Pumped Hydro Projects, to ensure optimal utilization of variable renewable energy. NGEL has issued tenders for significant energy storage capacity.
Green Hydrogen: Exploring and investing in green hydrogen production and related applications like green mobility and green chemicals. Development of Green Hydrogen Hubs is underway.
Renewable Energy Round-The-Clock (RE-RTC) Power: Entering into agreements with Commercial and Industrial (C&I) customers for the supply of RE-RTC power.
6. Supporting Initiatives:
Land Banking: NTPC REL has established a land bank with ISTS connectivity for future renewable energy projects.
Technological Advancements: Investing in and adopting new technologies to enhance efficiency and reduce costs in renewable energy generation.
Sustainability Focus: The renewable energy expansion is a key part of NTPC's broader sustainability strategy, "The Brighter Plan 2032".
Through these multifaceted strategies, NTPC aims to significantly increase its renewable energy footprint and contribute substantially to India's clean energy goals by 2032.
GBP/USD Technical Outlook: Elliott Wave Mapping the Next MoveThis GBP/USD 4H chart presents an Elliott Wave analysis.
Wave (1) and (2): The market had an impulsive bullish movement in Wave 1, followed by a corrective Wave 2.
Wave (3): A strong bullish move with momentum.
Wave (4): A corrective phase, forming a triangle pattern (a-b-c-d-e), which suggests the market is preparing for another impulsive leg.
Entry Confirmation: A breakout above the triangle pattern.
First Target: 1.31457 (Fibonacci 0.382)
Second Target: 1.32105 (Fibonacci 0.5)

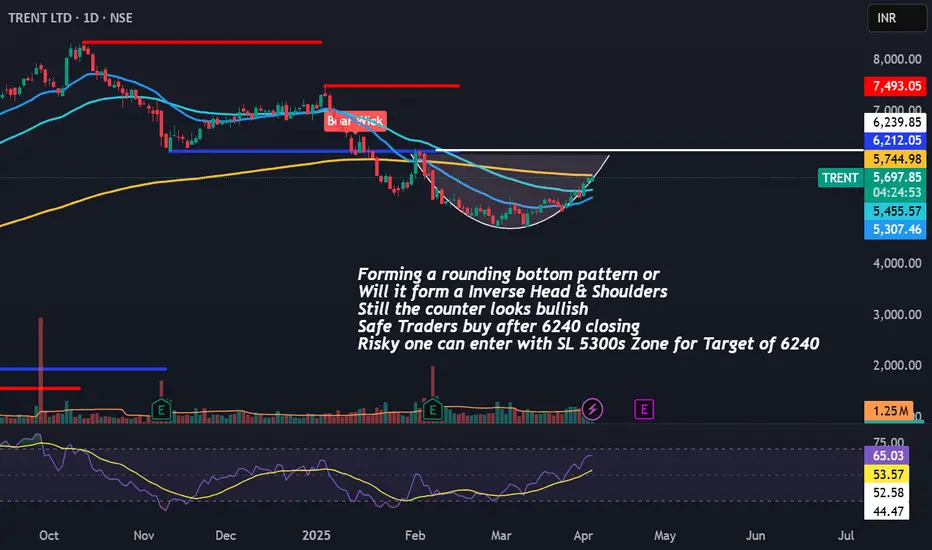
Trent Bullish Bias Target of 6240/-Forming a rounding bottom pattern or
Will it form a Inverse Head & Shoulders
Still the counter looks bullish
Safe Traders buy after 6240 closing
Risky one can enter with SL 5300s Zone for Target of 6240
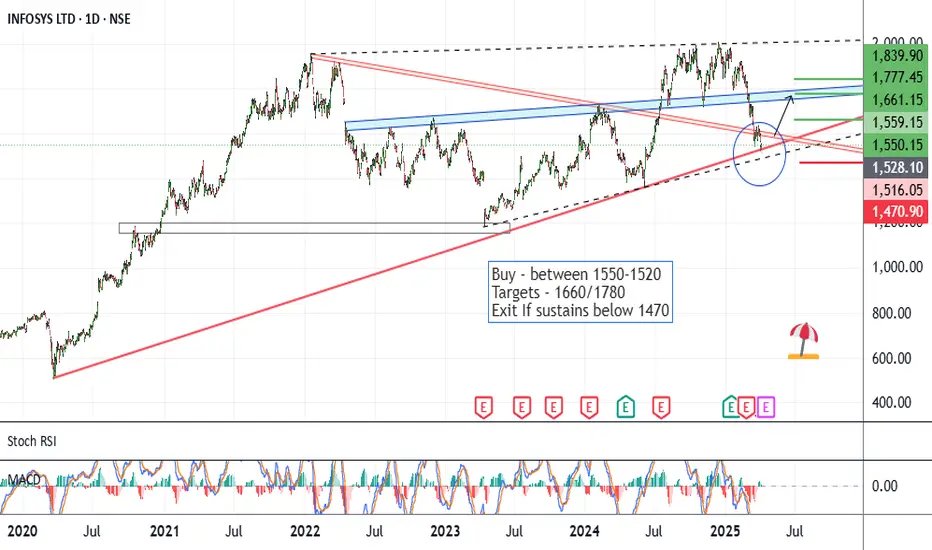
Infy - Long SetupCMP 1550 on 03.04.25
The chart marks all the important levels. The stock price has corrected by around 25% in recent weeks. According to the above setup, it seems to be on the supports.
If it reverses from these levels, it may go into a bullish phase ahead. Possible targets may be 1660/1780/1840.
The setup will lose significance if the price sustains below 1470.
One should keep the position size according to risk management.
All these illustrations are only for learning and sharing purposes, not a trading recommendation.
All the best.
Godfrey Phillips India Limited - 1D - Breakout
Pattern: A cup and handle formation is visible, suggesting a potential breakout.
• Trendlines: Two white downward trendlines indicate previous resistance levels, with the price recently breaking above them.
• Breakout: The latest price action shows a breakout above resistance around ₹7,107, which could indicate a bullish move.
• Volume: The volume bars at the bottom show increasing volume, confirming the breakout.
Indicators:
• RSI (Relative Strength Index) Indicator (Bottom Panel):
• The red line (72.00) represents the RSI value.
• The yellow-green line (60.61) likely represents a moving average or signal line.
• The RSI above 70 suggests the stock is gaining relative strength and could be in an overbought zone.
Resistance Levels:
1. ₹7,100 - ₹7,150 (Breakout Zone) → The stock has recently broken above this resistance. A successful retest and hold above this level could confirm further upside.
2. ₹7,600 - ₹7,700 → Next key resistance from previous highs (potential target if the breakout sustains).
3. ₹8,000+ (All-Time High Zone) → If momentum continues, this could be a longer-term target.
Support Levels:
1. ₹6,800 - ₹6,850 (Breakout Retest Level) → If the price pulls back, this level should act as strong support.
2. ₹6,400 - ₹6,500 (Psychological & Trendline Support) → Below this is the next strong support from past price action and trendline.
3. ₹6,000 (Major Support Zone) → A breakdown below this could invalidate the bullish trend.

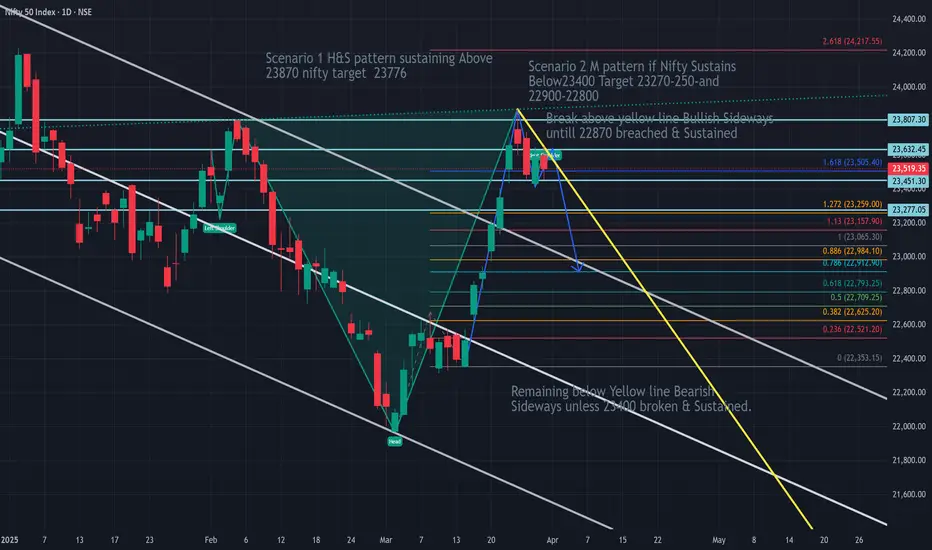
Nifty Weekly ViewNifty is Forming either H&S or M pattern. If Nifty breaks & sustains 23870 and H&S pattern is confirmed then target will be 25750.
If Nifty breaks and Sustains below 23400 then M pattern is confirmed and in that case nifty may test 22800 level.
On chart please read H&S target as 25750.
Sumitomo Chemical - Chart of the MonthNSE:SUMICHEM showed good price action this month, showcasing strength in this market and looking to continue that further, hence qualifying for my Chart of the Month.
About:
NSE:SUMICHEM is one of the leading players in the industry, which has a balanced portfolio of technical and formulation products along with backward integration for some products.
The Company is known for domestic marketing of proprietary products of its Japanese parent, TSE:4005 in agrochemicals, animal nutrition, and environmental health business segments. With the integration of Excel Crop Care Limited, the Company now has a strong portfolio of generics in addition to specialty products and a strong combined marketing network.
Trade Setup:
It crossed major Swing High Levels this Month and is now looking to cross ATH, RSI & MACD Trending Upwards. Buy on DIPS can be done if it consolidates. The Base Formed Will be an Ideal Stop Loss.
Target:
Around 672 Levels can book a partial at the ATH Zones.
Stop Loss:
Entry Candle Low For Swing Traders and Base Marked for Positional Traders.

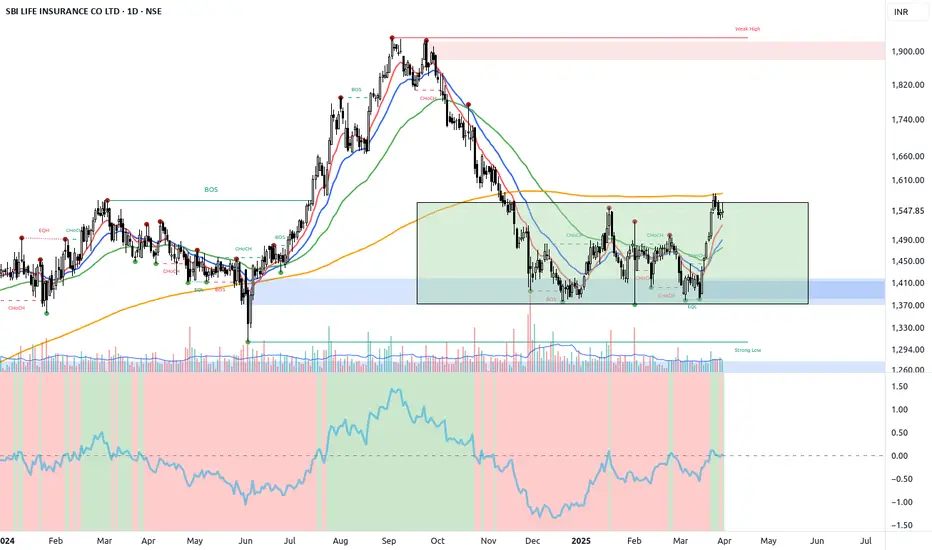
SBILIFE🔎 Key Observations:
Base Breakout on Decent Volume – Price successfully broke out of a long accumulation phase.
200-Day MA Rejection – Faced resistance at the critical moving average, leading to a pullback.
Retesting the Base – The stock is currently stabilizing after the rejection.
🚨 Trading Plan:
⚠️ Wait for a Strong Close Above the 200-Day MA 📈
📊 Volume Confirmation Needed: A breakout should be accompanied by higher-than-average volume to confirm strength.
📌 Final Thoughts:
The structure remains bullish, but a clear 200 MA breakout is the key trigger. Patience is key! 🔥
What’s your take? Will it break through or retrace further? Comment below! 👇📊🔥
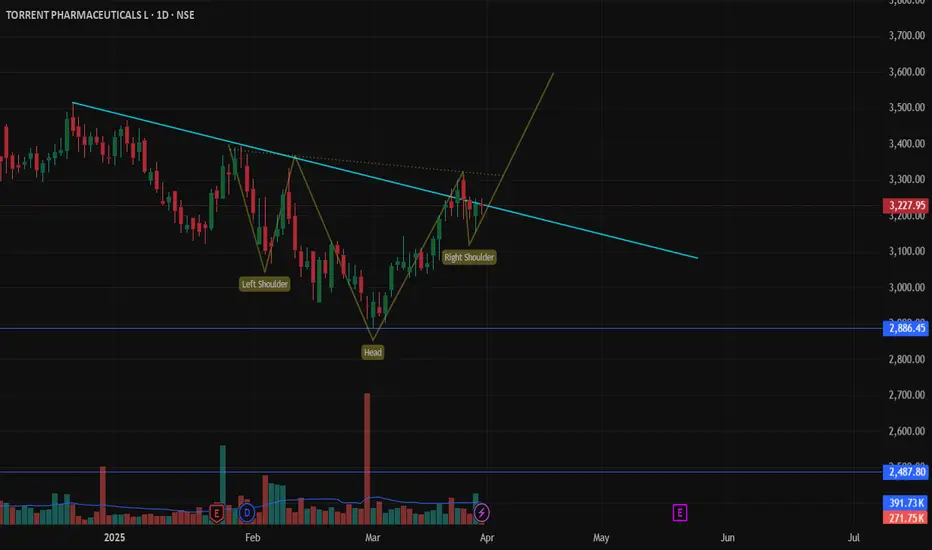
Inverse H&S Forming on Daily TF – on #TorrentPharmaInverse H&S Forming on Daily TF – Price Testing Resistance Trendline. What’s Next?
An Inverse Head & Shoulders (H&S) pattern is taking shape on the daily chart, suggesting a potential bullish reversal. Price is now testing a key resistance trendline—will it break through?
🔹 Bullish Confirmation: A breakout above resistance could confirm the pattern, targeting higher levels.
🔹 Bearish Rejection: If price gets rejected, the setup may fail, leading to a retest of nearest support.
Key Levels: Neckline (resistance) & trendline breakout zone. Thoughts? #PriceAction #TradingSetup