Bullish Flag Brewing in Bandhan BankBandhan Bank is consolidating after a sharp decline, forming what appears to be a potential bullish flag on the chart. The ongoing pullback is overlapping and corrective , suggesting digestion rather than a fresh impulsive sell-off.
As long as price holds above the 141 support zone , the bullish flag structure remains valid. A decisive breakout above the upper channel boundary would confirm continuation and open the door for higher levels.
Until then, this remains a wait-for-confirmation setup , with clearly defined risk and invalidation.
Disclaimer: This analysis is for educational purposes only and does not constitute investment advice. Please do your own research (DYOR) before making any trading decisions.
Elliott Wave

MCX Silver: Healthy Dip Before Next RallyMCX Silver is in a strong long-term uptrend on the daily chart. The market has already completed wave 1, 2, and a strong wave 3 upward. After this big rise, price is now expected to make a normal correction (wave 4). This pullback can come toward the 236,000 area, which is an important support zone. As long as price stays above this support, the overall trend remains bullish. After wave 4 is completed, Silver is expected to start wave 5, which can push prices to new highs. In short, the trend is up, and any dip is a healthy correction, not weakness.
Stay Tuned :)
@Money_Dictators

Dr Reddy’s Labs:Oversold Bounce Likely, But Structure Still WeakPrice has now reached a key demand / support zone , while RSI has slipped into oversold territory , a setup that often precedes a technical bounce . From a pure momentum perspective, a short-term relief rally looks likely .
However, the broader structure remains corrective . The stock continues to trade below two declining trendline resistances , and the 50-DMA is hovering near a bearish crossover with the 200-DMA , keeping the higher-timeframe bias under pressure.
The recent price action shows overlapping, choppy swings , best interpreted as multiple minor and higher-degree double corrections . Any bounce from current levels is therefore expected to be counter-trend and corrective in nature , not the start of a new uptrend.
Unless price can reclaim the falling resistance and sustain above key moving averages , the risk of a larger Wave Y decline toward the ~1,020 zone remains open. Rallies, if any, are likely to face supply and should be treated with caution.
In summary:
Oversold bounce likely from support
Bounce expected to be corrective
Trend still weak below resistances
Wave Y risk remains toward ~1,020
Disclaimer: This analysis is for educational purposes only and does not constitute investment advice. Please do your own research (DYOR) before making any trading decisions.

L&T: Wave 5 Exhaustion Signals a Corrective PhaseA clear 5-wave impulse has played out, with Wave 3 showing classic overbought RSI behavior while still respecting Elliott Wave rules.
Wave 5 ended with RSI divergence , signaling exhaustion near the highs.
Price has now slipped below the 100-DMA , reinforcing the view that the advance has likely stalled and a corrective phase is underway. The decline should unfold in at least a 3-wave structure . Importantly, Wave (a) may not be complete yet . Despite RSI reaching oversold levels, there is no decisive reversal signal so far. Any near-term bounce could turn out to be a dead-cat bounce , potentially forming Wave (b) rather than a trend reversal.
The previous accumulation zone , which also aligns with the 50% Fibonacci retracement , remains a key area to monitor. Until the corrective structure is fully resolved, bounces are best treated as counter-trend moves , not fresh longs.
Disclaimer: This analysis is for educational purposes only and does not constitute investment advice. Please do your own research (DYOR) before making any trading decisions

ICICI Bank: Stable Results, Critical Technical TestICICI Bank Limited announced its Q3 FY26 results after market hours, delivering a quarter marked by stable core performance but profits below market expectations . While the balance sheet remains healthy, the earnings profile does not materially alter the broader technical structure visible on the chart.
This makes it important to assess earnings and price action independently , and then align them within a broader market structure.
Earnings Snapshot — Key Metrics Explained
Profit After Tax (PAT)
PAT: ₹11,318 crore
YoY comparison: Lower than ₹11,792 crore
Outcome: Below analyst expectations
What PAT means:
PAT represents the company’s net profit after all expenses and taxes . A miss here does not imply business weakness, but it does indicate that profits fell short of what the market had already priced in .
Net Interest Income (NII)
NII: ₹21,932 crore
Growth: +7.7% YoY
What NII means:
NII is the difference between interest earned on loans and interest paid on deposits . It reflects the core earning power of a bank . ICICI Bank’s NII growth confirms steady loan growth and healthy lending activity .
Net Interest Margin (NIM)
NIM: 4.30% (stable)
What NIM means:
NIM measures how efficiently a bank converts lending into profit . Stability here suggests no margin pressure and continued pricing discipline.
Provisions — The Key Drag
Total provisions: ₹2,556 crore
Includes ₹1,283 crore additional standard asset provision following an RBI supervisory review
What provisions mean:
Provisions are buffers set aside to absorb potential future losses . In this quarter, the increase was regulatory in nature , not driven by deterioration in credit quality.
However, higher provisions directly reduce reported profits , which is why markets tend to react cautiously.
Asset Quality
Gross NPA: 1.53%
Net NPA: 0.37%
Provision Coverage Ratio: 75.4%
What NPAs mean:
Gross NPA shows total stressed loans
Net NPA reflects stress after provisioning
These numbers confirm that asset quality remains strong , with no visible stress on the balance sheet.
Technical Structure — Where Price Stands
From a technical perspective, price continues to trade within a larger corrective structure after forming an all-time high near 1500.
The recent rally appears counter-trend , pushing price into a well-defined supply zone
The 1445 region is acting as resistance
Momentum has improved, but RSI remains below bullish expansion territory , indicating the absence of impulsive strength
What RSI tells us:
The Relative Strength Index measures momentum. Sustained bullish trends usually hold RSI above 60–65 . Readings below this zone often accompany corrective or relief rallies .
Wave Context (High-Level View)
The broader price action still fits a corrective W–X–Y structure
The current advance aligns with a counter-trend X-wave
Unless price accepts decisively above 1500 , the structure continues to allow for a Y-leg decline toward lower support zones
This keeps the risk-reward skewed toward patience rather than aggressive positioning at current levels.
Key Levels to Watch
Major resistance / bearish invalidation: 1500
Immediate supply zone: 1445
Target support – 1: 1325
Target support – 2: 1265
Final View
Fundamentally, ICICI Bank remains a high-quality franchise with improving asset quality, stable margins, and healthy loan growth. However, the profit miss driven by higher regulatory provisions does not provide a strong catalyst for a fresh impulsive breakout.
Technically, price is reacting exactly where it should — into resistance within a corrective structure . Until there is clear acceptance above 1445/1500 , the broader setup remains range-to-corrective , not trend-expansive.
Disclaimer: This analysis is for educational purposes only and does not constitute investment advice. Please do your own research (DYOR) before making any trading decisions.

Completion of 5 wavesPower India has completed 5 waves where wave 1 is the longest . It is in the form of a diagonal. The correction is still unfolding and should end i the vicinity of wave 2 , preferably near it low around 10000-11000. It is still making red candles . Correction will be over then we get a good green candle who top should be traded by another green candle or appearance of 3 white soldier in the vicinity of wave 2.

Angel One: Power Bounce or Wave 4 Noise?Since its inception low near ₹222 , Angel One Limited has delivered a strong multi-year advance. The initial rally into ₹1,689 is best viewed as Wave 1 , followed by a deep yet corrective decline toward ₹990.50, forming Wave 2 . This laid the foundation for an extended Wave 3 , which accelerated sharply and culminated near ₹3,896 .
Following the Wave 3 peak, price action transitioned into a sideways and overlapping phase , characteristic of a complex Wave 4 correction rather than the start of a fresh impulsive advance. The correction so far appears to be unfolding as a W–X–Y-type structure , with scope for further extension if price continues to face resistance. Crucially, Wave 1 remains intact , preserving the broader impulsive framework — though it remains unconfirmed at this stage.
The latest +17.94% weekly candle highlights strong reactionary demand . However, price continues to trade below the descending trendline resistance , and a clear impulsive breakout has yet to emerge. With the Union Budget (Feb 1) approaching, event-driven volatility remains a key near-term risk.
Bottom line:
Wave 3 stands extended.
Wave 4 is likely still in progress.
Wave 5 will only be considered on a clean impulsive breakout and a sustained close above descending trendline resistance.
Disclaimer: This analysis is for educational purposes only and does not constitute investment advice. Please do your own research (DYOR) before making any trading decisions.

The next multibagger in the making - WAAREE RENEWABLE TECHConsider only for long term investment , given the current financial and technical position of this company right now , its about to gain traction in the coming months. Let's see how it performs in the years to come! , looks good for long term investors.

Short term Analysis of GoldWrap up:-
Gold has almost completed a impulse of major wave 3 and also making a wxy pattern in wave 5 of wave 3. Buying Gold at these levels may lead to regret over time. Now, correction in Gold is about to start in coming 1-2 months.
What I’m Watching for 🔍
Short Gold once it breaks 38.2% level of wave y (i.e. from $3998 to a current high or if a new high is made then upto that level) for a target of $3702-$3577-$3446.
Disclaimer: Sharing my personal view — only for educational purpose not financial advice.
"Don't predict the market. Decode them."

Copper : Bullish we are in the either 4th wave or 5th wave has already started which will lead the prices for higher side
key level 5.4000

Nifty Analysis for Jan 13, 2026Wrap up:-
Nifty is heading towards wave c of y of 5. In wave C, Wave 1, 2 and 3 of major wave 1 of c were completed today and wave 4 is expected to be completed by tomorrow morning near 25800. Thereafter, Nifty will head towards wave 5 of major wave 1 of c.
What I’m Watching for Jan 09, 2026 🔍
Buy Nifty near 25800 sl 25700 (15 min. candle closing basis) for a target of 25898-25960-26061.
Disclaimer: Sharing my personal market view — only for educational purpose not financial advice.
"Don't predict the market. Decode them."

#Nifty Directions and Levels for Jan 13thThe structure suggests that the market could consolidate between today’s high and the immediate support level. However, if it breaks either above today’s high or below today’s low, we can expect gradual ups and downs toward the next targets

#Banknifty Directions and Levels for Jan 13thThe structure suggests that the market could consolidate between today’s high and the immediate support level. However, if it breaks either above today’s high or below today’s low, we can expect gradual ups and downs toward the next targets.

Nifty Analysis for Jan 12-13, 2026Wrap up:-
As mentioned earlier, due to break of 25693, whole of the counts of wave y of 5 have been changed and wave a of y has been completed at 26325 and wave b of y is expected to be completed in the range of 25638-25595. Thereafter, Nifty will head towards wave c of y.
What I’m Watching for 12th to 16th Jan, 2026 🔍
Buy Nifty if it sustains above @25909 sl 25595 (15 min. candle closing basis) for a target of 26086-26148-26263.
Disclaimer: Sharing my personal market view — only for educational purpose not financial advice.
"Don't predict the market. Decode them."

BHEL – Approaching a Key Reversal Zone on the Weekly ChartBHEL has been in a broader W–X–Y corrective structure since topping out near ₹335 on the weekly timeframe. The first leg down (Wave W) completed around ₹176, followed by a steady recovery that is now pushing into a major resistance zone.
The current bounce looks like the tail end of Wave X , with price entering the 100% extension area of (a) near ₹301. This is a natural place where counter-trend rallies often slow down or fully exhaust.
Momentum remains strong — weekly RSI is pushing into the overbought zone — but there is still no confirmed bearish divergence. In simple terms:
strength is there, but it’s reaching the “watch carefully” zone.
If a bearish candlestick forms inside this highlighted region (shooting star, rejection wick, bearish engulfing, anything with real intent), it could mark the start of Wave Y , potentially dragging the stock much lower over the coming months.
Volume is supportive on the way up, but still not showing the kind of impulsive conviction that usually accompanies a fresh bullish trend.
For now, the plan is straightforward:
Let the weekly candle speak. If sellers step in here, Wave Y may begin. If price breaks above the zone decisively, this count gets challenged.
Disclaimer: This analysis is for educational purposes only and does not constitute investment advice. Please do your own research (DYOR) before making any trading decisions.

SPY - Hope it tops this time :)US markets have been super resilient, sucking capital from across the world.
We have a good pattern in place, as the triggers for pushing the market up have been reducing with time, with everything running quite thin.
The rally has been quite low on breadth and is supported on weak pillars - but still has been resilient and all selling have been bought into.
Let's see if it breaks and sustains this time.
We need a 10-15% (ideally + 20%) fall in US for money to flow into emerging markets :)
It is a good time to try some positional shorts with SL as 7k.
View void if we sustain above 7k.

#Nifty Directions and Levels for Jan 12thGood morning, friends! 🌞
Market Directions and Levels for Jan 12th
Global remains positive, though Indian markets show a bearish bias. Today, the market may open neutral to slightly gap down, as GIFT Nifty trades about 20 points lower.
Current View
> If the market declines initially, the immediate support zone is expected to act as a strong support.
> If price gets rejected from this zone, structurally this could be a 5th sub-wave. In that case, the 5th sub-wave correction may complete here, followed by a bounce of around 38%–61% of the minor swing.
> This is the base structure. However, if price does not reject around the pullback zone, the 5th sub-wave could extend toward 25,550–25,580 for Nifty.
Alternate View
> The alternate scenario suggests a range-bound market with a bearish bias.
> If the market opens positive, we can expect a bounce of around 23%–38%. However, even if a bounce occurs, the broader outlook remains bearish, and the market may return to its opening level by the end of the day.

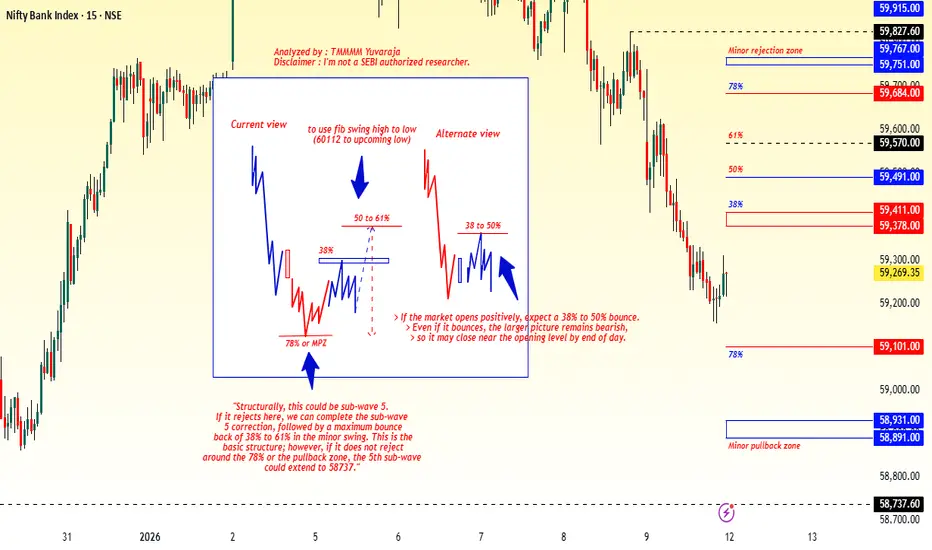
#Banknifty Directions and Levels for Jan 12thCurrent View
> If the market declines initially, the immediate support zone is expected to act as a strong support.
> If price gets rejected from this zone, structurally this could be a 5th sub-wave. In that case, the 5th sub-wave correction may complete here, followed by a bounce of around 38%–61% of the minor swing.
> This is the base structure. However, if price does not reject around the pullback zone, the 5th sub-wave could extend toward 58,737.
Alternate View
> The alternate scenario suggests a range-bound market with a bearish bias.
> If the market opens positive, we can expect a bounce of around 23%–38%. However, even if a bounce occurs, the broader outlook remains bearish, and the market may return to its opening level by the end of the day.
Short term Analysis of HDFC BankWrap up:-
HDFC Bank is making a wxy pattern in wave c and has completed its wave w at 1018 and wave x is completed at 933. Thereafter, HDFC Bank will head towards wave y.
What I’m Watching for 🔍
Buy HDFC Bank @933 sl 927 for a target of 1027-1078.
Disclaimer: Sharing my personal view — only for educational purpose not financial advice.
"Don't predict the market. Decode them."

Major Crash Ahead?The Diametric Pattern completed.
2-stage confirmation achieved.
The Major impulsive downtrend has begun - Unless there is a sharp reversal upside by next week.

Updated Nifty Analysis for Jan 09, 2026Wrap up:-
As updated earlier, wave 1 was completed at 26057 but wave 2 counts have now been changed due to a sudden fall and is expected to be completed in the range of 25800-25850. Thereafter, nifty will head towards wave 3.
What I’m Watching for Jan 09, 2026 🔍
Buy Nifty only above @25971 sl 25858 (15 min. candle closing basis) for a target of 26447-26630.
Short Nifty in the range @25935-25921 sl 25971 (15 min. candle closing basis) for a target of 25818.
Disclaimer: Sharing my personal market view — only for educational purpose not financial advice.
"Don't predict the market. Decode them."

Tube Investments of India Ltd — Wave X Triangle in PlayAfter the sharp decline from ₹4,810, the recent advance initially looked like a potential leading diagonal of a new impulse. However, the internal overlaps and choppy rhythm point instead to a Wave X triangle, likely part of a larger corrective sequence (W–X–Y).
As long as price holds below ₹3,419.90, the bearish outlook remains intact, with the next leg — Wave Y — possibly aiming toward the 0.5–0.618 retracement zone (₹2,511–₹1,968). That region, close to the golden ratio, may act as a potential termination zone for the entire correction.
Disclaimer: This analysis is for educational purposes only and does not constitute investment advice. Please do your own research (DYOR) before making any trading decisions.

Nifty Analysis for Jan 09, 2026Wrap up:-
As updated earlier, wave 1 was completed at 26057 but wave 2 counts have now been changed due to a sudden fall and is expected to be completed at 25858 if nifty breaks and sustains above 25971. Thereafter, nifty will head towards wave 3.
What I’m Watching for Jan 09, 2026 🔍
Buy Nifty above @25971 sl 25858 (15 min. candle closing basis) for a target of 26447-26630.
Disclaimer: Sharing my personal market view — only for educational purpose not financial advice.
"Don't predict the market. Decode them."
