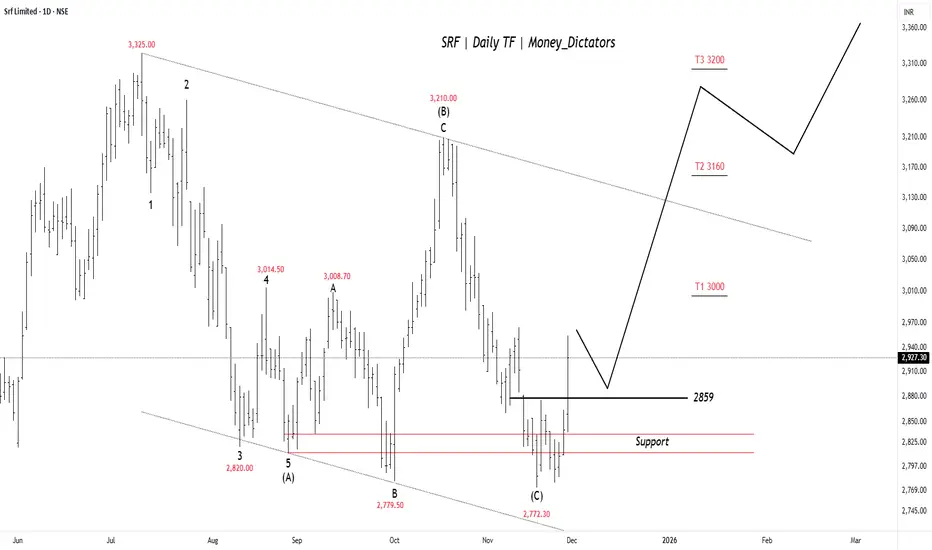
SRF on the Edge of a Sharp BreakoutSRF seems to have finished its ABC correction near the 2770–2800 support zone, and the price has bounced back above 2859 , which now acts as a short-term trigger. If the stock stays above this level, it can move toward 3000 first, then 3160 , and possibly 3200 . The chart shows buyers gradually taking control again after the correction, but the outlook stays positive only as long as price holds above the support region.
Stay Tuned!
@Money_Dictators
Elliott Wave
HDFC BANK LTD PARALLEL CHANNEL BREAKOUTHDFC BANK was traded in channel from past few years and made a breakout with good volume. Entry price at ₹990, with a STOPLOSS ₹940 and TARGET ₹1,190

BTCUSD - Wave 5 Decline Still Likely AheadPrevious Analysis:
BTC is approaching a critical reaction zone where the current rise looks more like a corrective push than the start of a new trend. Price is moving toward the highlighted supply region, which aligns with a potential wave 4 completion inside the descending channel. The structure from the recent low shows an internal a–b–c formation, suggesting this bounce could run into exhaustion as it enters the red zone. Unless BTC breaks out of the channel with conviction, the broader momentum still leans bearish. A rejection from this region would likely trigger the final wave 5 leg, driving price toward deeper Fibonacci levels and completing the corrective cycle before any meaningful recovery attempt can begin.
Stay Tuned!
@Money_Dictators

Nifty Analysis for Nov 21, 2025Wrap-up:
Nifty breaks previous high 26104, now pattern has been changed and nifty now formed internal wxy pattern and major ABC wave pattern of which wave 5 is expected to be completed at 26104.
What I’m Watching for Nov 21, 2025 🔍
Short nifty only if it breaks 26097 SL above 25857 for a target of 25934-25892 and 25673-22596 (SL on 15 min. candle close).
Buy nifty only if takes support at 26154 for a maximum target of 26433 only intraday with a sl below 26097.
Disclaimer: Sharing my personal market view — only for educational purpose not financial advice.

Nifty Analysis for Nov 27, 2025Wrap-up:
Nifty has completed major wave 1 and wave 2 is in progress of which internal wave A is formed and heading towards internal wave B.
What I’m Watching for Nov 27, 2025 🔍
Short nifty only if it breaks 26156 SL above 26216 for a target of 25673-22596 (SL on 15 min. candle close).
Disclaimer: Sharing my personal market view — only for educational purpose not financial advice.

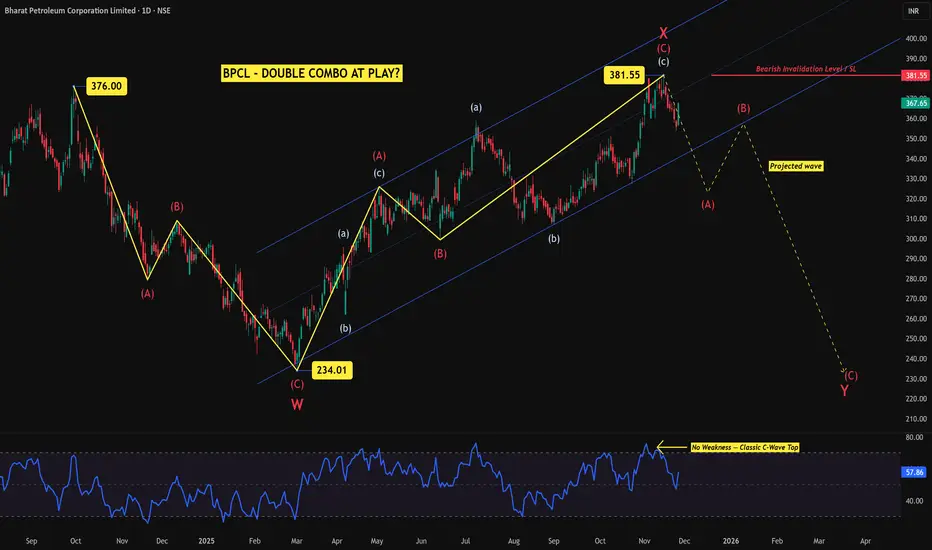
BPCL – Is a Double Combo Unfolding?After reviewing the recent price action in BPCL, the structure that initially looked like a potential impulsive rally has revealed a different internal behaviour upon closer inspection. The key deciding factor was the momentum profile at the recent high near 381.55 . Instead of showing the typical loss of strength expected at the end of a Wave 5, the RSI remained firm with no bearish divergence , which is a classic characteristic of a C-wave termination , not an impulsive fifth wave.
This prompted a reassessment of the entire advance.
Revisiting the Structure
From the March low near 234.01 , price advanced in a clear two-stage corrective manner. Both segments carried zigzag characteristics, aligning better with a W–X–Y double combo rather than an impulsive 1–2–3–4–5 sequence.
Wave W ended at 234.01 after a clean A-B-C decline.
The strong recovery that followed subdivided into two smaller zigzags, forming Wave X , which topped out at 381.55 .
The RSI behaviour at this point supported the corrective interpretation, showing strong momentum without the exhaustion typically seen at the end of an impulsive structure.
This combination lends weight to the view that the rally into 381.55 was corrective in nature.
Current Outlook – Wave Y in Progress
If the 381.55 high is accepted as the completion of Wave X, the decline from that point can be viewed as the early stages of Wave Y, which typically unfolds as another A-B-C structure.
The initial decline resembles a developing Wave A .
A corrective Wave B rebound can follow.
A deeper Wave C may then complete the entire double combo, with possible downside levels aligning toward the 240–260 region depending on the depth of the final leg.
These projected swings are guidelines, not certainties, and the internal structure of each leg must be monitored.
Invalidation Level
The critical level for this view is clear:
A decisive move above 381.55 invalidates the entire bearish W–X–Y expectation.
If price breaks and sustains above this level, the corrective interpretation collapses and a new bullish sequence would be favoured instead.
Conclusion
The internal characteristics of the rally—especially the RSI behaviour—support the idea that BPCL is unfolding a double combo correction rather than a completed impulsive advance. As long as the 381.55 level holds, the risk of further decline remains open, with a potential full completion of Wave Y lower.
Disclaimer:
This analysis is for educational purposes only and does not constitute investment advice. Please do your own research (DYOR) before making any trading decisions.
XAGUSD_Short Elliot Wave Analysis I'm anticipating that XAGUSD (Silver) could decline toward the $48.50 level, with a suggested stop loss around $54.50. Please make sure to conduct your own research before entering any trade.

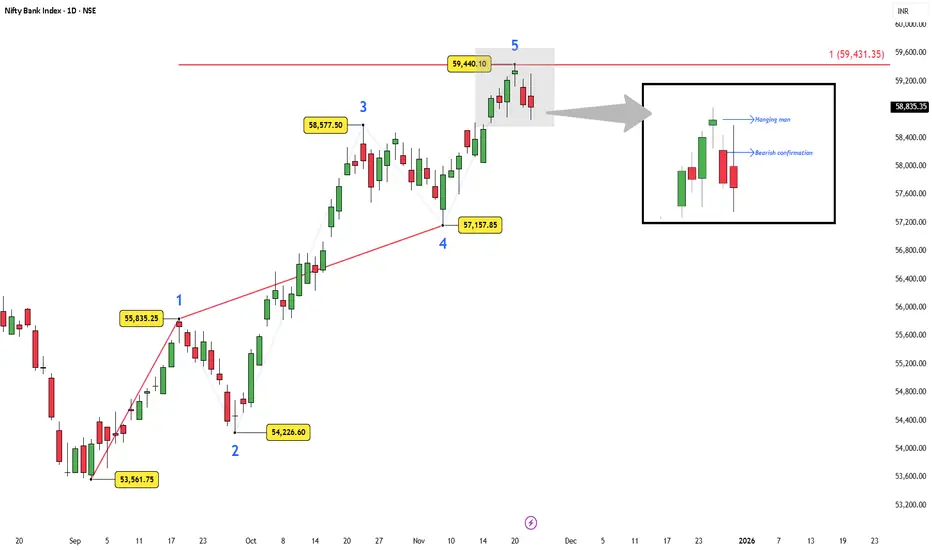
Bank Nifty — Wave 5 Meets 100% Extension ResistanceBank Nifty completed its five-wave rise with Wave 5 ending exactly at the 100% Fibonacci extension of Wave 1 , a classic termination level when Wave 3 is extended.
Inside this zone, price printed a Hanging Man followed by a bearish confirmation candle . The confirmation is not strong, but together with the Fibonacci symmetry at the Wave-5 target, it reflects clear exhaustion.
A corrective phase from this region is reasonable.
A strong reclaim above the recent high would invalidate the exhaustion and reopen the upside.
Disclaimer : This analysis is for educational purposes only and does not constitute investment advice. Please do your own research (DYOR) before making any trading decisions.
BTC Wave 4 Bounce Looks Like a Trap! Is it?BTC is still moving inside a clear corrective channel, with the current bounce likely forming wave 4 before one final drop toward the 1.618 extension near 79,650 . The highlighted red zone shows a potential trap area where price may lure traders into thinking a reversal has started. Until BTC breaks above the channel convincingly, the broader structure still favors a wave 5 decline. The wave count from 1–2–3 supports this final leg down before any major recovery.
Stay Tuned!
@Money_Dictators

Indian Railway Finance Corporation – Complex Correction in PlayDisclaimer: This analysis is for educational purposes only and does not constitute investment advice. Please do your own research (DYOR) before making any trading decisions.
Technical Picture
Indian Railway Finance Corporation (IRFC) stock rallied from the swing low of 65.75 to an all-time high of 229 in a strong impulsive move. Since then, the stock has entered a corrective phase.
The decline from 229 to 108.04 unfolded as a clear three-wave ABC zigzag.
From 108.04 to 148.95, the rise was overlapping and choppy, best counted as an X wave triangle rather than a fresh impulsive sequence.
The fall from 148.95 to 117.33 looks impulsive and is labelled as Wave A of the Y leg.
The ongoing bounce can be labelled as Wave B, with retracement levels around 124–129 acting as possible resistance.
Once Wave B completes, a Wave C decline is expected to finish Wave Y. This Y leg can either:
terminate near 108.04, forming a double bottom structure, or extend toward the 0.786 retracement of the 65.75–229 rally, around 100.70.
Momentum and Indicators
On the D,2D and Weekly charts, RSI is below the 50 mark, showing weak momentum.
Price remains under the 50, 100, and 200-day moving averages, which are acting as resistances (not plotted here to keep the chart uncluttered).
The invalidation level for this corrective view is 148.95. A break above this level would challenge the corrective structure and point to a new impulsive rally.
Fundamentals
Growth : FY25 sales at Rs 27,152 crore vs Rs 26,645 crore in FY24. Net profit at Rs 6,502 crore vs Rs 6,412 crore. Quarterly profits continue steady.
Cash flows : Operating cash flow improved to Rs 8,229 crore. Net cash flow turned positive at Rs 5,657 crore from negative last year.
Leverage : Debt-to-equity is high at 7.83, with interest coverage at just 1.3x, leaving little buffer.
Returns and margins : Return on equity stands at 12.3%, but margins have narrowed from earlier highs.
Valuation : P/E around 25 and P/B at 3.1 suggest the stock is not cheap given its nature as a financing PSU.
in.tradingview.com
Summary
IRFC appears to be in the final stages of a complex W–X–Y correction. Wave Y is unfolding, and price can either find support near 108.04 to form a double bottom or stretch further toward the 100.70 zone. The 129 area is key resistance for the current B wave bounce, and 148.95 remains the invalidation level.
While the company’s fundamentals are stable with steady sales and profits, the balance sheet remains heavily leveraged, and valuations are not inexpensive. Investors should watch for price action around 108–100 for signs of a structural bottom and confirmation before positioning for the next major trend.

SBFC Finance (Requested View)Namaskaram
One friend asked of me my view on SBFC, Here It is.
Just leave a comment if you have query related to your stock
Thank You

Nifty50 - Wave 4 Flat in Play, Triangle on the HorizonNifty’s prior correction completed as a W–X–Y, with Wave Y ending in a rare truncation — a sign of exhaustion before the next impulse began.
The following rise is unfolding into a clean 5-wave sequence. Wave 4 now appears as a flat correction but, per alternation, could stretch into a sideways triangle while holding above the 0.382–0.5 zone.
Once complete, Wave 5 may challenge and possibly clear the ATH line.
Disclaimer: This analysis is for educational purposes only and does not constitute investment advice. Please do your own research (DYOR) before making any trading decisions.

Nifty Analysis for Nov 20, 2025Wrap-up:
As predicted Nifty breaks 26029 after taking support at 25857.
What I’m Watching for Nov 20, 2025 🔍
Short nifty only if it breaks 25785 SL above 25896 for a target of 25607-25545 and 25042-25167 (SL on 15 min. candle close).
Buy nifty only if takes support at 25896 only intraday with a sl below 25785.
Impulsive move is treated as completed once nifty breaks 25785.
Disclaimer: Sharing my personal market view — only for educational purpose not financial advice.

Bitcoin at Support: Bounce Likely, Trend Still WeakBitcoin has been sliding steadily and has now broken its first major support near 103k. The latest drop completed a clear A-B-C decline, with the final C-wave forming an ending diagonal — a pattern that often signals exhaustion at the end of a move. That’s why the selling pressure slowed as price entered the current demand zone.
Oversold Conditions
The RSI on the daily chart has dropped into deeply oversold territory. This is typically where Bitcoin produces a reaction bounce. It doesn’t confirm a trend reversal, but it does hint that sellers may pause.
What Happens Next
A corrective bounce — the X-wave — is the most reasonable expectation. However, X-waves are usually messy and uneven, not clean rallies.
The key area to watch is 100k–103k .
If Bitcoin cannot reclaim this zone, the larger corrective structure remains in control.
Bigger Picture
The moving averages support this caution. The 50-day and 200-day MAs are close to forming a death cross, which signals weakening short-term momentum relative to the long-term trend. It doesn’t imply a crash, but it does suggest that any bounce may face resistance.
If the X-wave fails below 103k, the next leg — the Y-wave — could drive price toward the larger support region around 72k–75k.
In Summary
The decline looks structurally complete, ending with an ending diagonal.
RSI is deeply oversold -> a corrective bounce is likely.
100k–103k is the make-or-break zone.
Failure to reclaim it keeps the W-X-Y correction active.
The final support zone sits lower, near 72k–75k.
A bounce may come first, but the broader structure still leans bearish unless key resistance levels are regained.
Disclaimer: This analysis is for educational purposes only and does not constitute investment advice. Please do your own research (DYOR) before making any trading decisions.

Manifesting the ATH glory - MARKSONSMarksons pharma has successfully taken a good turn around from its multi year support zone and is now poised for its year framed 3rd wave ( a long impulse wave ) as per Elliott wave analysis. With good fundamentals backing the operations and a scope for a good impulse in the coming months/year , Marksons would be a must have on the Watchlist :)

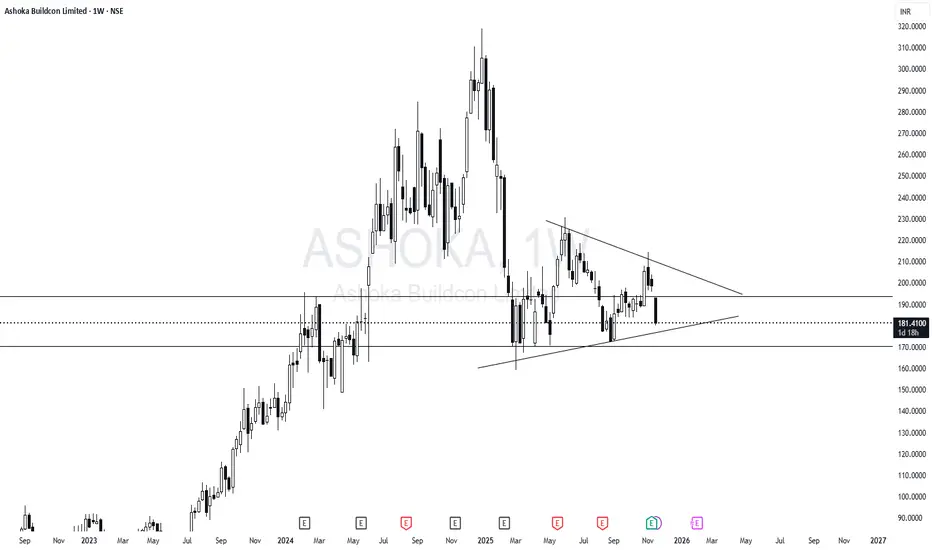
A Beautiful pattern that suits its name - ASHOKA BUILDCONAshoka is poised for an up move given the support it took from its multi-year support zone , with the pattern breaking above 210 , we can expect it to reach its ATH in no time.
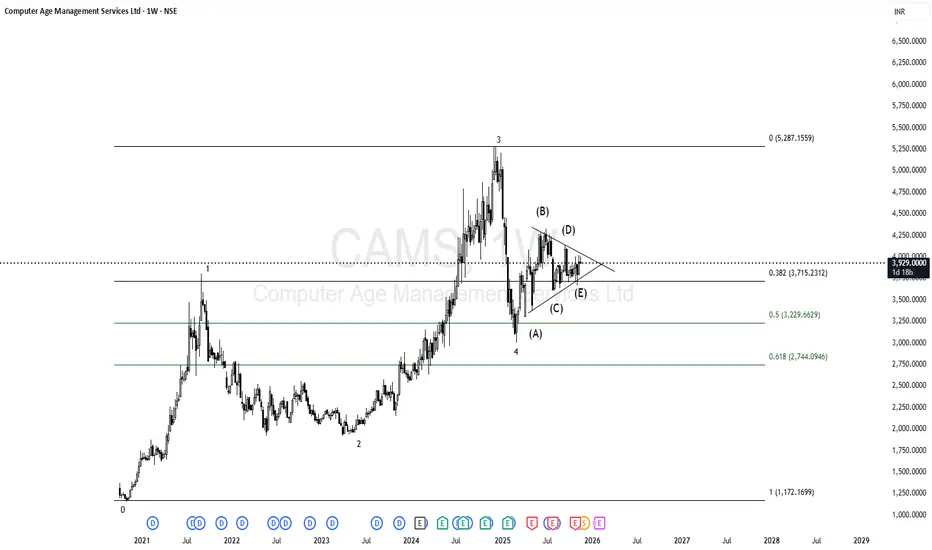
CAMS - creating a good consolidationCAMS is about to give an impulse move towards the upside as it is currently consolidating in the 4th wave. Keep this in the watchlist and look for break above the resistance trendline. And as always, don't enter without a SL :)
Nifty Analysis for Nov 18, 2025Wrap-up:
Nifty breaks 26010, now pattern has been changed and it is a destructive impulsive move.
What I’m Watching for Nov 18, 2025 🔍
Short nifty only if it breaks 25754 SL above 25857 for a target of 25588-25530 and 25042-25167 (SL on 15 min. candle close).
Buy nifty only if takes support at 25857 only intraday with a sl below 25754.
Disclaimer: Sharing my personal market view — only for educational purpose not financial advice.

L&T Technology Services: Correction Complete Near Golden Ratio?After a textbook five-wave impulse from ₹2,924 (2022 low) to ₹6,000 (2024 high), L&T Technology Services appears to have completed a proportional A–B–C correction, finding support precisely near the 0.618 retracement (₹4,099) of the entire advance.
Wave Structure
The advance from the 2022 low unfolded as a clean 5-wave impulse, capped by Wave 5 near ₹6,000.
The subsequent decline subdivides neatly into A–B–C, with Wave C forming a perfect five-wave internal pattern.
Sub-wave (v) of C bottomed around ₹3,951 — just below (iii), confirming structural completion with ideal symmetry.
Fibonacci & Channel Confluence
The decline halted exactly at the 0.618 retracement of the prior impulse — a zone that often attracts buying in post-impulse corrections.
The downward-sloping corrective channel that’s guided Wave C is now flattening, with price repeatedly testing its upper boundary.
A sustained breakout above ~₹4,300–₹4,400 would signal that the market may be transitioning into a new impulsive phase.
Trade Perspective (Educational View)
Scenario 1 – Bullish:
A weekly close above ₹4,400 confirms breakout from the C-wave channel, opening the door toward ₹5,200 → ₹5,650 in subsequent impulsive waves.
Scenario 2 – Extended Correction:
Failure to clear the channel and a close below ₹3,950 would extend the correction toward deeper retracements near ₹3,600 or even ₹3,400.
Summary
L&T Technology Services has now checked every box of a mature corrective phase — Fibonacci alignment, structural symmetry, and wave alternation.
A breakout above the declining channel would be the first real hint that the larger uptrend is ready to resume. Until then, patience beats prediction.
Disclaimer :
This analysis is for educational purposes only and does not constitute investment advice. Please do your own research (DYOR) before making any trading decisions.

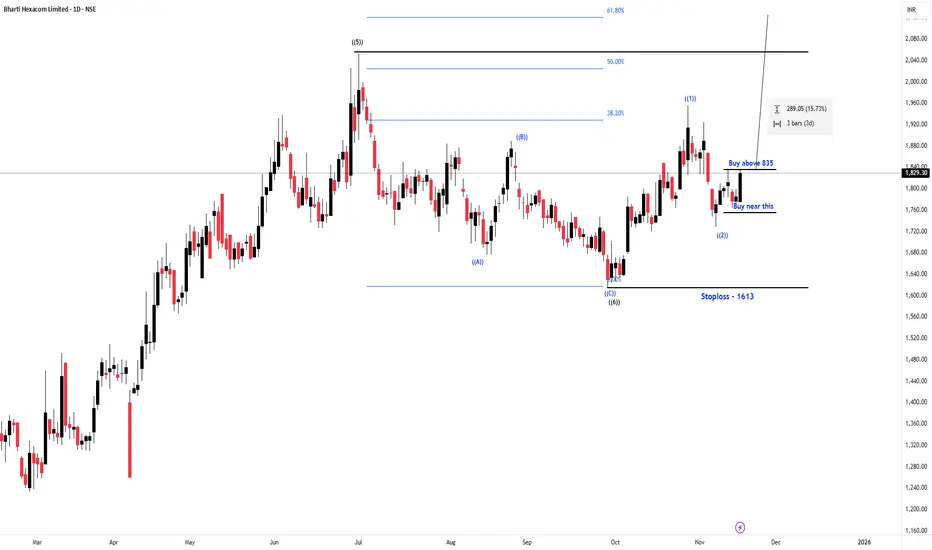
Bharti Hexacom Limited ( Neowave Trading Idea)Namaskaram
This is an swing trade, this is just to show you how our setup works,
will talk about setup in the tomorrow video.
About stock
Trend Cycle- 7th swing
Target just below the previous swing -2020
stoploss- 1614
stoploss will change to 1728 after friday if price goes above 835 and does not come back.
will update the trail sl.
This is an example how our furture setup will work, but still this is a tradable setup and counts is strong to take a swing trade.
It has no boundation of time limit.
if you have questions, you can ask me in the comments.
Thank You
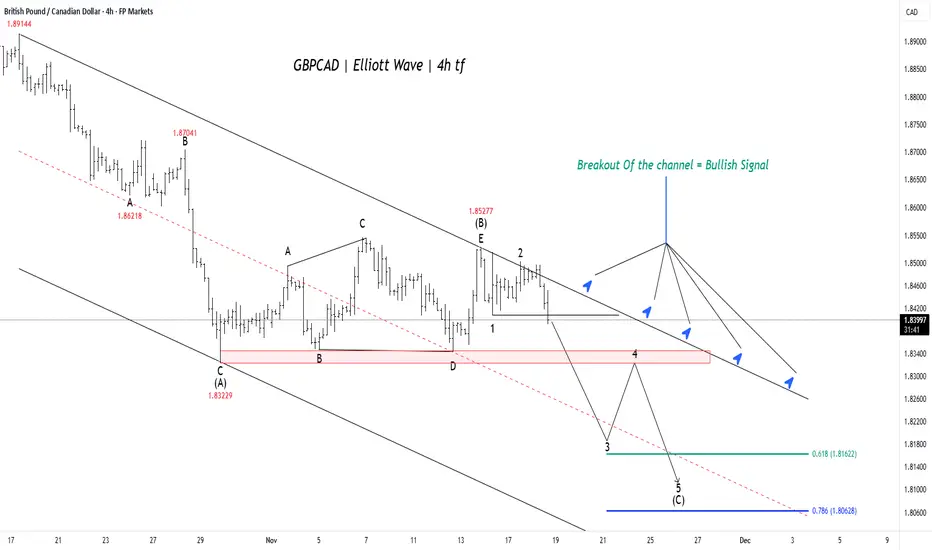
GBPCAD: Final Drop to Key Support Before Major ReversalThe wave Principle strongly suggests the currency pair is currently in the final stages of a large decline, which is expected to precede a major, sustained upward move.
Completion of Correction: The pair has recently completed a complex, sideways corrective pattern (such as a triangle or flat), marking the start of the final downward push.
Final Downward Leg: This ultimate decline, labeled wave (C), is now underway and is projected to drive the price into a critical support zone.
Target Zone: Traders are watching two key targets for the end of this correction: the 0.618 Fibonacci extension near 1.8162 and the deeper 0.786 extension at 1.8062 .
Anticipated Reversal :Once the price successfully completes this wave (C) and holds support within the 1.816 to 1.806 range, the analysis anticipates the immediate start of a significant and powerful bullish rally.
The current market price is still trading above this projected support zone, indicating that the final downward leg has room to run before the setup for the major reversal is complete.
Stay Tuned :)
@Money_Dictators
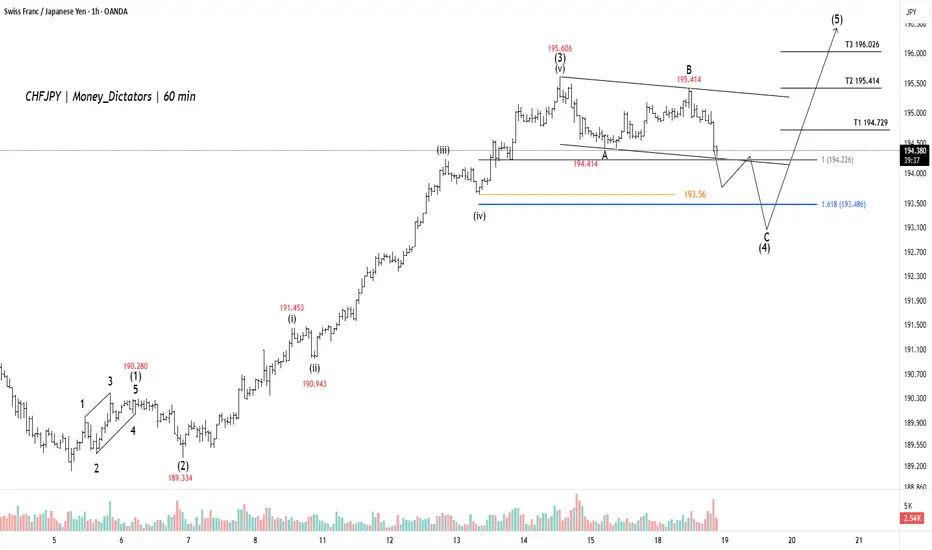
CHFJPY Is Escaping from Bulls, but...CHFJPY is currently completing a corrective pattern, labeled as wave (4).The price is expected to retest and potentially find support around the 193.56 level, or the 1.618 Fibonacci extension near 193.486.Once this correction is complete, the pair is projected to start the final impulse wave (5).The primary target for the final move (5) is 196.026 (T3).
Stay Tuned!
@money-dictators
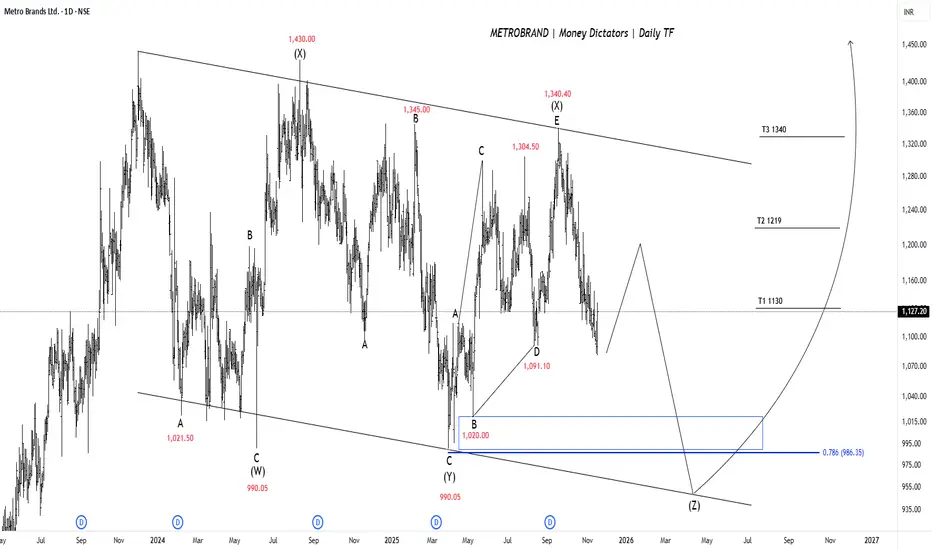
METROBRAND - An Important Case of Final Correction & ImpulseMetrobrand has been trading inside a broad downward-sloping channel for a long time, repeatedly getting rejected from the upper trendline. Each corrective structure appears as part of a complex W-X-Y-X-Z pattern, and currently, the price seems to be completing the final leg (Z). The earlier lows around 990 were tested twice, showing strong support, and now price is recovering from that zone. The recent rise indicates that sellers are losing strength and buyers are slowly stepping in again.
The ideal accumulation range lies between 1,020 and 986 (0.786 retracement), and as long as the stock holds above this zone, the downside risk remains limited. A minor dip or consolidation is still possible in the coming weeks before a stronger uptrend kicks in. Once the price stabilizes and confirms reversal with higher highs and higher lows, we may see momentum building toward the upper resistance.
If the stock sustains above 1,125 and later breaks out of the channel resistance, it has the potential to travel toward 1,245 initially. A successful breakout with volume can trigger a major upside move, extending toward 1,460 or even higher levels. Overall, the risk–reward now tilts in favor of long-term buyers, provided the stock respects the lower support zone near 986 .
Stay Tuned!
@Money_Dictators