Fibonacci


How Support and Resistance of Fibonacci Levels - Pidilite IndJust posted chart for learning purpose, please note the retracements levels bounce from key levels.
How stock behaves at key levels marked to form price action on downside when the latest swing was marked using fibonacci retracement
After Forming W Pattern at bottom, confirming through RSI Divergence,
1) First Retracement to 38.2% levels, then came down
2) again found resistance at 38.2% levels
3) third time broke 38.2% level as it got weak and got resistance at 61.8% level
4) Retraced to 50% level and bounced back to break 61.8% level (perfect price action)
5) Formed double top pattern at 78.6%
6) stock fall downside back to 38.2% levels and retraced to 50% levels (perfect price action)
7) Again retracing and finding resistance at 38.2% level
Happy Learning


BANK NIFTY weekly analysisBank nifty is facing strong resistance @23400-23700 level
Supply zone is @ 22275-22600
Demand zone @ 20950-21180
Demand zone @ 20000-20360
Strong support @ 18560-19050

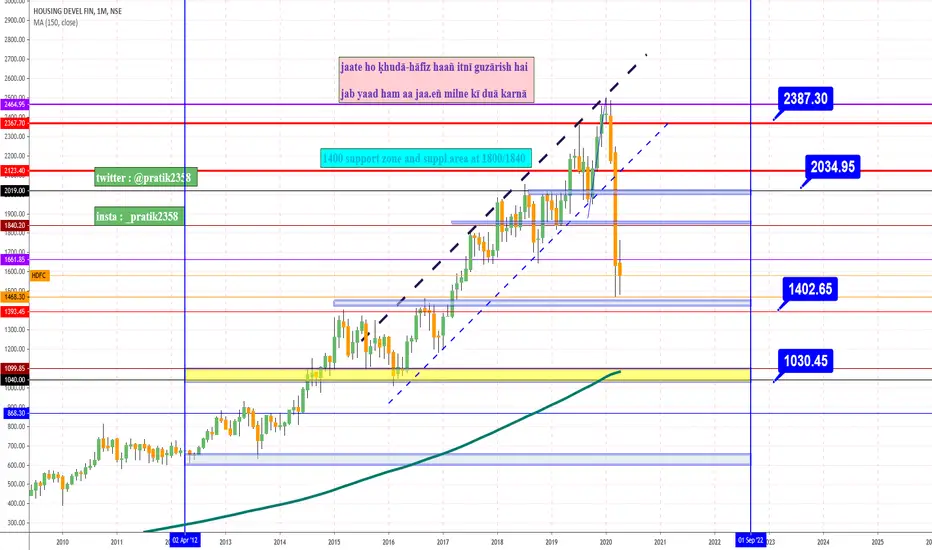
HDFC BANK Fibonacci retraced 50%In the Recent Fall HDFC Bank retraced 50% from its lows. same as NIFTY 50, now NIFTY looks reversal same could be the case for all indexed stockes which retraced to certain levels. we could see 850 levels in HDFCBANK in this MAY series.


AHOKLEY Fibonacci Retracements in this 2year downfall.On weekly chart we can see that it has retraced 50% twice.
it has retraced alomost 100%.
Now it has retraced almost 38% which is at 53 level, i.e today it touched 50.4 levels. considering the economic situation it is difficult to retrace 50% level. if nifty support it can do so.


M&M Fibonacci retracement closed above 38.2 percentIt just closed above 38.6 % of retracement with increased volumes. It can easily reach 50% level.i.e 417. Need to observe price action level at that point.


berger paint fundamentals and panic criss cross crude is down is fundamental positive
market panic is near term negative
