TATASTEEL ( W ) BREAKOUT
Breakout price 183
Target 1 : 198-200
Target 2 : 218-220
Sl : 166
All Target & sl DCB
Note : Only for education purpose
Fundamental Analysis

🇮🇳 LiamTrading – XAUUSD: Dual Strategy Ahead of FOMC🇮🇳 LiamTrading – XAUUSD: Dual Strategy Ahead of FOMC | Focus on Buying the Retracement near $3914
Hello Traders,
After a strong sell-off, Gold (XAUUSD) is showing early signs of recovery, building a minor upward structure.
We continue to focus on buying the pullback, viewing this move as a short-term correction within the broader downtrend.
Expect higher volatility as the FOMC decision approaches.
📰 MACRO CONTEXT & FUNDAMENTALS
The market is holding steady ahead of the FED announcement:
🟢 Technical Recovery:
Gold reversed part of its decline during the Asian session, bouncing slightly from a 3-week low as traders await the FOMC rate decision.
🔴 Headwinds:
However, optimism around US-China trade talks and a stronger USD continue to limit the upside momentum.
📊 TECHNICAL VIEW & TRADING PLAN
We are focusing on high-probability liquidity zones for both long and short opportunities:
🟢 Primary BUY Setup (Retracement Buy)
Looking for a retest of the key buy-side liquidity zone to trigger the next recovery wave.
Entry Zone (Buy): $3914
Stop Loss: $3906 (Tight SL recommended)
Take Profit: TP1 $3933 | TP2 $3956
🔴 SELL Setup (Retest / Short-Term Scalping)
Using the broken trend area for short opportunities.
Entry Zone (Sell): $4048
Stop Loss: $4056
Take Profit: TP1 $4035 | TP2 $4022
🧭 SUMMARY & TRADER’S NOTE
Gold is now in a decision zone — volatility will spike around FOMC.
Trade with discipline:
✅ Enter only at confirmed liquidity zones.
✅ Always respect your Stop Loss.
✅ Manage your capital carefully before the news release.
Wishing everyone a profitable and disciplined session!

J Kumar Infraprojects LtdDate 29.10.2025
J Kumar Infraprojects
Timeframe : Weekly
About
(1) Engaged in the business of execution of contracts of various infrastructure projects
(2) Including Transportation Engineering, Irrigation Projects, Civil Construction and Piling Work
(3) It is amongst the top 5 EPC players eligible to undertake underground metro projects
(4) Amongst few companies qualified to undertake elevated & underground metro projects
Revenue Mix
(1) Metro - 40%
(2) Flyovers, Bridges & Roads - 49%
(3) Civil, Water & Others - 11%
Geographical Split
(1) Maharashtra - 74%
(2) NCR - 15%
(3) Tamil Nadu - 6%
(4) Other - 5%
Clientele
CIDCO, DMRC, MMRC, MSRDC, NHAI, JSW, MMRDA, TATA Steel, Indian Oi
Order Book
Current order book is around 20,000/- crores against the market cap of 4713 Cr
Order Book Break-Up
(1) Flyovers - 39%
(2) Roads - 24%
(3) Metro (Elevated) - 14%
(4) Metro (Underground) - 12%
(5) Civil & Others - 11%
Valuations
(1) Market Cap 4713 CR
(2) Stpock Pe 11.6
(3) Roce 20%
(4) Roe 14%
(5) Book Value 1.5 X
(6) Opm 15%
(7) Promoter 46.64%
(8) Profit Growth (TTM) 19%
Regards,
Ankur

Golden Rally Losing Steam!Following an extended bullish run, gold seems to have completed a double top formation, signaling exhaustion of upward momentum. The emerging head and shoulders pattern reinforces the bearish outlook, with a projected downside target around 3600.

XRPUSDT - EYEING A BREAKOUT ABOVE KEY RESISTANCESymbol - XRPUSDT
XRPUSDT is attempting to break through the upper boundary of its trading range amid a broader bullish recovery across the cryptocurrency market. A confirmed breakout may occur following a minor pullback.
The market continues to absorb the liquidation impact from last few days, with Bitcoin showing structural recovery, suggesting a potential resurgence of bullish sentiment. This development supports a more optimistic outlook for the overall crypto market.
XRPUSDT is currently testing resistance and entering a phase of consolidation. The key breakout trigger lies near 2.661 However, during consolidation, a retest of support levels remains possible as the market may seek liquidity before a potential upward continuation.
Resistance levels: 2.661, 2.739
Support levels: 2.587, 2.500
Since the start of the session, momentum has been notably strong, though a brief correction could materialize before the upward movement resumes. Within this corrective phase, XRPUSDT may retrace toward the 2.587 – 2.500 zone to gather liquidity before potential continuation.

BTCUSD - RESISTANCE RETEST IN PROGRESSSymbol - BTCUSD
Bitcoin continues to consolidate beneath the previously breached ascending trendline, with no distinct signs indicating the end of the corrective phase or the emergence of strong bullish momentum. A retest of the resistance zone is currently forming.
Bitcoin is trading within a defined range between 1,11,650 & 1,06,250 At present, there are no clear bullish reversal signals, and price action suggests a corrective move toward resistance before a potential decline into the liquidity pool near 1,06,250, shaped by prior consolidation and retesting activity.
Two critical resistance zones lie ahead — 1,11,650 and 1,13,600 Resistance at 1,11,650 has been validated. However, failure to sustain rejection here may lead to a test of the upper boundary. A false breakout in that area could trigger a subsequent pullback. Overall, the cryptocurrency market remains relatively subdued, reflecting ongoing uncertainty and caution surrounding broader macro and policy factors.
Resistance levels: 1,11,650 - 1,13,600
Support levels: 1,08,650 - 1,07,375 - 1,06,250
Current price action indicates a developing consolidation phase within a localized downtrend. A confirmed breakout above 1,13,000 and subsequent consolidation above 1,13,500 would strengthen the case for a potential trend reversal. Until such confirmation emerges, a pullback from resistance into the zone of interest remains the primary expectation.

GOLD (XAU/USD): SHORT OPPORTUNITY — RIDING THE FINAL BEAR LEG!1. MACRO VIEW: THE FED DECISION & MARKET TENSION
The Gold market is currently caught in a tug-of-war:
Downside Pressure (USD): Positive developments in the US-China trade talks are easing global risk concerns, which often reduces demand for safe-haven Gold.
Upside Support (Gold): Traders are fully pricing in a 25bps Fed rate cut on Wednesday, putting downward pressure on the US Dollar (which is supportive of Gold). Geopolitical tensions (Russia-US) add further safe-haven appeal.
Key Takeaway: While USD weakness is supportive, our Technicals strongly suggest a corrective move needs to conclude first. The FOMC decision is the ultimate game-changer.
2. TECHNICALS: STRUCTURE CONFIRMS THE BEARISH BIAS
Trend Shift: Gold’s strong previous rally has ended. The structure has been clearly broken, confirming a Bearish Shift for the short-term trend.
Expected Move: We are looking for a classic technical pullback (Retest) to the newly formed resistance zone. Following this retest, we expect sellers to push the price down to complete the correction.
3. 💡 TRADE STRATEGY (THE SHORT SETUP)
We are positioning for a SELL (SHORT) trade, anticipating the end of the corrective phase:
Ideal Entry Zone (Entry): 3,949.849 (Retesting the previous major Support, now acting as Resistance)
Take Profit (TP1): 3,929.793
Take Profit (TP2): 3,878.287 – 3,811.333 (The Major Demand Zone Target below)
Stop Loss (SL): Above 3,949.849 (Placed above the confirmed resistance)
⚠️ Important Note: The FED rate decision on Wednesday guarantees high volatility. Trade cautiously and ALWAYS prioritize risk management!
What is your view on Gold's bottom? Share your thoughts below! 👇
#Gold #XAUUSD #FOMC #TradePlan

LiamTrading - XAUUSD: SCENARIO AHEAD OF FOMCLiamTrading - XAUUSD: SCENARIO AHEAD OF FOMC - The $3840 Mark Awaits a Bottom Catch Reaction Wave
Hello trading community,
The Gold market is exhibiting a strong and sustainable downtrend. We are witnessing a crash after the price broke through key support zones. With the upcoming FOMC event, our strategy is to seek Buy opportunities at deep liquidity zones and continue to Sell when the price recovers to retest the broken trend.
📰 MACRO ANALYSIS & CASH FLOW CONTEXT
Gold is currently under dual pressure:
Bearish Pressure 🔴: Optimism about the US-China trade progress has significantly weakened the demand for Gold, traditionally a safe-haven commodity. Spot Gold prices have fallen below $3950, hitting a three-week low, down about 0.78% on the day (28/10).
Short-term Support 🟢: Bets on the possibility of Fed rate cuts continue to weaken the US Dollar (USD), which is the only factor that could potentially support this precious metal.
Conclusion: This tug-of-war makes bottom identification challenging. The bearish scenario remains the top priority.
📊 TECHNICAL ANALYSIS: THE DOWNWARD WAVE CONTINUES
Based on the H4 chart (image_5fa7fa.png):
Current Trend: The price has successfully broken the key liquidity support zone near $3950 and is continuing its downward momentum.
Current Fibonacci Level: The price is touching and reacting at the 1.618 Fibonacci level (around $3950).
Next Target: The next target for Gold will be the 2.618 Fibonacci area (around $3840), which is a large liquidity zone expected to see strong reactions.
Main Strategy: We focus on two scenarios: Catching the bottom reaction at 3840 and continuing to Sell when the price rebounds.
🎯 DETAILED TRADING PLAN (ACTION PLAN)
We have two detailed scenarios based on the current price level:
🟢 BUY Reversal Scenario
We wait for the price to hit the deep liquidity bottom at 3840 to execute a buy order with the expectation of a technical recovery.
Entry Zone: 3840
Stop Loss (SL): 3832 (tight SL)
Take Profit Targets (TP): TP1: $3872 | TP2: $3898 | TP3: $3925 | TP4: $3950
🔴 SELL Retest Scenario
If Gold recovers without breaking the downtrend structure:
Entry Zone: Watch for a Sell retest at $4091
Stop Loss (SL): $4099
Take Profit Targets (TP): TP1: $4065 | TP2: $4033 | TP3: $4004 | TP4: $3965
SUMMARY & DISCIPLINE (Steven's Note)
Gold is in a strong decline ahead of the FOMC, with significant volatility expected. Capturing deep Fibonacci and Liquidity zones is key.
Note: Always adhere to the set Stop Loss. Capital management is the top priority, risking only 1-2% of the account per trade.
Wishing traders a successful and disciplined new trading week!

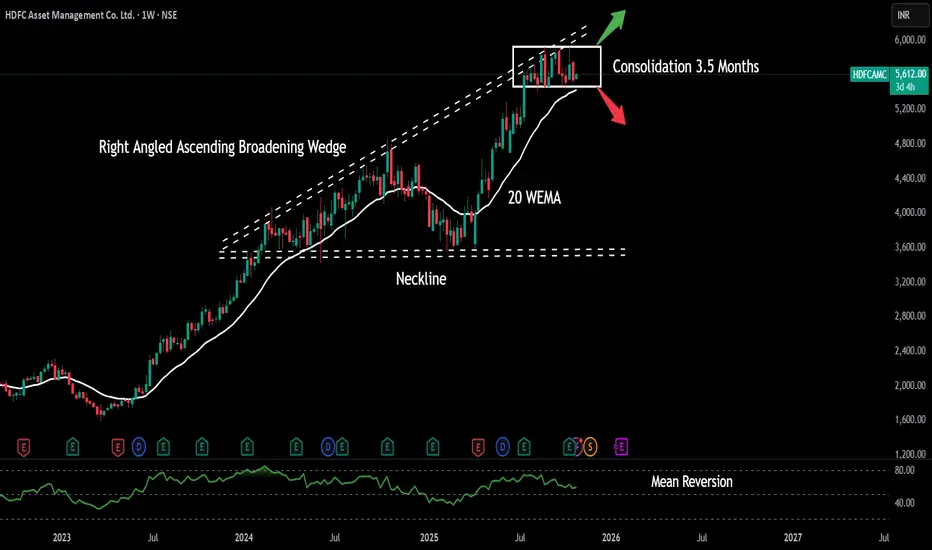
HDFC Asset Management Company Date 28.10.2025
HDFC AMC
Timeframe : Weekly Chart
About
(1) The company acts as an Investment Manager for HDFC Mutual Fund, one of the largest mutual funds in India.
(2) It offers 98 mutual fund schemes, including 39 equity-oriented, 32 debt-oriented, 2 liquid, and 25 others
Market Share
(1) Closing AUM: 11.6%
(2) QAAUM: 11.5%
(3) Actively managed Equity Oriented QAAUM: 12.8%
(4) MAAUM: 13.2%
Operational Metrics
(1) Closing AUM (Rs. Bn): 7,764
(2) QAAUM (Rs. Bn): 7,874
(3) Alternatives AUM (Rs. Bn): 50
(4) Unique Investors (Mn): 12.6
(5) Live Accounts (Mn): 22.1
Closing AUM Mix
(1) Equity-Oriented: 66%
(2) Debt-Oriented: 20%
(3) Liquid: 10%
(4) Other: 4%
Distribution Mix
(1) Direct: 44%
(2) MFDs: 27%
(3) National Distributors: 21%
(4) Banks: 11%
Valuations
(1) Market Cap 1,19,257
(2) Stpock Pe 43
(3) Roce 43%
(4) Roe 32%
(5) Book Value 15 X
(6) Opm 80%
(7) Promoter 52%
(8) Profit Growth (TTM) 24%
Regards,
Ankur
GOLD - ENTERS COREECTION PHASESymbol - XAUUSD
Gold is currently undergoing a corrective phase following approximately six weeks of aggressive upward movement. Price action is forming a consolidation range while continuing to pressure the support zone.
The recent record breaking rally became overheated, prompting profit-taking and long liquidation. Additionally, a gradual shift in market sentiment and macroeconomic backdrop is contributing to capital outflows. However, ongoing US–China trade negotiations, the US government shutdown, and heightened geopolitical uncertainty, including the cancellation of Trump’s meeting with President Putin, continue to pose economic risks that could provide underlying support for the precious metal.
Overall, the current pullback appears to be a healthy corrective pause within the broader structure. The 4000 level remains a critical support area. A sustained recovery above 4110 would indicate that buyers are interested, though further momentum largely depends on developments surrounding global trade policies.
Resistance levels: 4100, 4110, 4163
Support levels: 4058, 4000
A decisive breakdown of the lower boundary of the trading range could trigger a deeper corrective wave. The 4000 level is the primary focus, as strong volatility may occur around this zone. Given the current market conditions - with declines matching the previous intensity of the rally, patience is warranted until momentum stabilizes, enabling more informed technical decisions.

XAUUSD - NOV-DEC 2025 TARGET / STRATEGY analysis While BRICS is already dealing to settle payment for Trades in their Local Currency ditching US dollar, Dollar seems to Weaken Further.
US Dollar Drops 50% Against Gold Since 2021 | The Jerusalem Post
The US dollar has long seemed untouchable, but its fortress is cracking | Fair Observer
with coming Christmas Gold can see a little sell off before Gearing UP.
TARGET already marked for LONG & short both
Note: Keep Trailing once in Profit
also ALSWAY look for EMI 20,50 & 100 it works as a good Support/Resistance
Folow on X

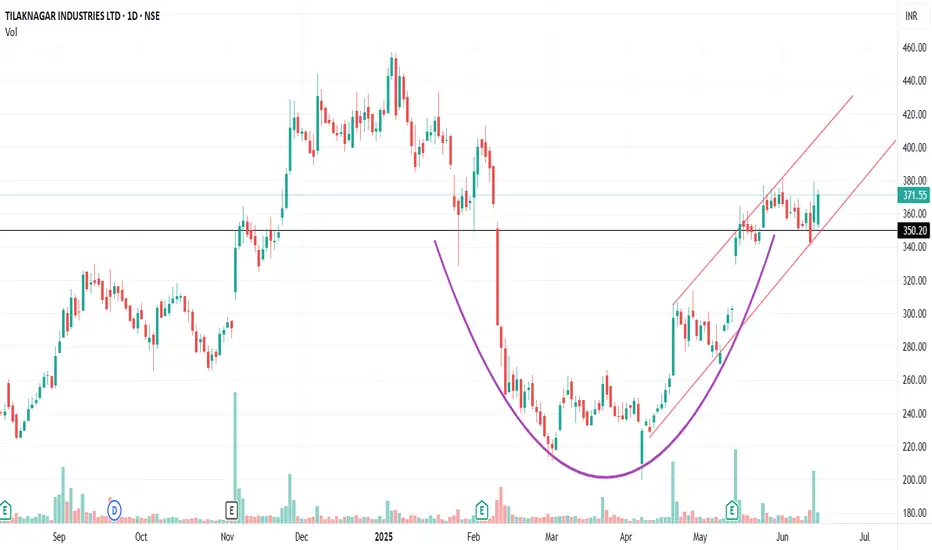
TilakNagar ..Breakout.. Good to be in portfolio.TilakNagar 371 is on breakout from round bottom . On valuation it is undervalued and has potential to move to 500. With ROE and ROCE best among its top 7 peers and paying out a health dividend. FII's have raised their stake. All above factors suggest TilakNagar a good to be in portfolio.
GOLD (XAU/USD): THE FED AND THE FINAL DIP – GET READY TO SHORT1. MACRO SCENARIO: KYA HO RAHA HAI?
Pull Factor (For Sellers): The US-China deal framework is good news, reducing those 100% tariff fears. This is putting some halki halki (slight) pressure on Gold.
Push Factor (For Buyers): CPI figures are weak (3% inflation), which pakka (surely) means the Fed will cut rates soon. Plus, the Russia-Ukraine jhamela (trouble) is a serious safe-haven booster.
The Main Event: The FOMC decision this Wednesday is the baap (father/boss) of all events. This will decide the long-term rasta (path) for Gold.
2. TECHNICAL ANALYSIS: STRUCTURE KA RAAZ (Secret of the Structure)
Current Scene: Gold had a solid run, but now it's in a big sydeway correction. The main price trend has been broken, confirming that the immediate sentiment is bearish. Zyada (More) selling pressure is expected.
Expected Plan: Gold has likely finished its upward natak (drama) and is ready for the final, sharp dip to complete this correction phase.
The Target (Magnet): The critical Value Gap on the Daily chart (around $3,880 – $3,920) is the strongest magnet. Pakka (Definitely), the price is heading here before taking a u-turn.
ENTRY WAITING: We might see a small comeback (retest) towards the broken structure area before the big fall starts. Pura dhyan udhar hi rakhna (Keep full attention there only).
3. 💡 TRADING STRATEGY (SHORT SIDE)
We are focusing on a SHORT trade for this final correctional wave:
Best Entry Zone: $4,080 – $4,100 (Retest of the broken zone).
Booking Profit (TP1): $3,970 (Nearest Demand Zone).
Booking Profit (TP2): $3,880 (The final target at the major Daily Value Gap).
Stop Loss (SL): $4,135 (Above the main Supply Zone, for safety).
A Serious Note: Please keep your Stop Loss tight before the FOMC on Wednesday. Mazaak nahi (No joke)! This short could be the last dance before a long-term rally!
Where do you think Gold will find asra (shelter/support)? Drop your comments below!
#Gold #XAUUSD #FOMC #Trading #TradePlan

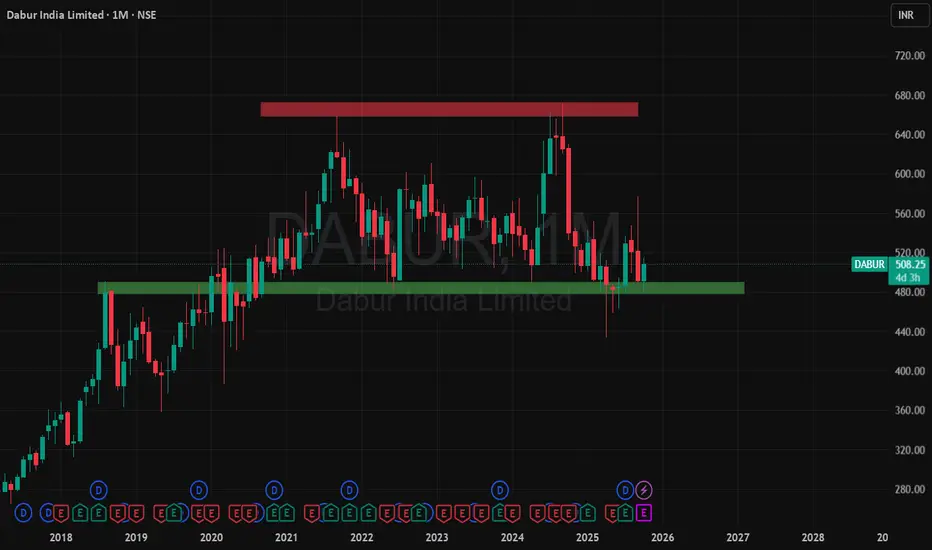
DABUR INDIA – AT A CRUCIAL SUPPORT ZONE1. Company Overview
Dabur India Ltd is one of India’s leading FMCG companies with deep roots in Ayurveda and natural healthcare.
It operates across Home Care, Personal Care, Healthcare, and Foods, serving both domestic and international markets.
The company’s ongoing strategy focuses on rural distribution expansion, premiumisation of products, and margin improvement through operational efficiency and cost control.
2. Technical Analysis
On the monthly timeframe, Dabur’s long-term trend shows a strong up-move — from below ₹10 in 2001 to an all-time high of ₹658 in 2021.
Since 2021, the ₹658–₹672 zone has acted as a major resistance, while the ₹470–₹490 zone has consistently provided strong support.
The same zone, which acted as resistance in 2018, has now turned into a demand zone.
Currently, the stock is trading around ₹511, exactly near the support region and showing signs of reversal from the demand zone.
Projection & Key Levels:
If Q2 FY 2025–26 results come positive, the stock may move toward:
1st Target: ₹550
2nd Target: ₹600
3rd Target: ₹650
However, if this zone fails to sustain, there should be no further expectations, as the maximum swing low lies near ₹430.
This gives a clear roadmap for both upside potential and downside risk.
3. Financial & Fundamental Analysis (FY 2024–25)
Revenue (FY 2024–25): ₹ 12,563 crore vs ₹ 12,404 crore in FY 2023–24 (+1.3% YoY)
Net Profit (FY 2024–25): ₹ 1,740 crore vs ₹ 1,811 crore in FY 2023–24 (–3.9% YoY)
Revenue growth remained modest, while profit declined slightly due to margin pressures and cost factors.
Q1 FY 2025–26: Reported steady performance with stable volumes and controlled expenses.
Q2 FY 2025–26: Yet to be declared — this quarter will be crucial in deciding near-term price direction.
Debt Levels: Long-term borrowings have continued to decline, reflecting financial discipline and improved leverage.
Valuation: Dabur trades at a moderate premium to the FMCG sector average due to its strong brand portfolio and steady financial track record.
4. Technical Indicators Summary
RSI (14): ~63 — showing underlying strength, not overbought.
MACD: In buy mode, supporting short-term bullish sentiment.
Moving Averages:
MA 50 – ₹ 495
MA 100 – ₹ 492
MA 200 – ₹ 510 (currently acting as short-term resistance)
Support Zone: ₹ 470 – ₹ 490
Resistance Zone: ₹ 658 – ₹ 672
5. Combined View — Technicals + Fundamentals
Technically, the stock is taking support at a strong demand zone with clear upside potential if the next results are favorable.
Fundamentally, Dabur remains financially stable with a robust brand base and controlled debt.
A positive Q2 FY 2025–26 can act as a catalyst for a rally toward ₹ 550 / ₹ 600 / ₹ 650, whereas a break below ₹ 470 may extend the fall toward ₹430.
6. Conclusion
Dabur India stands as a fundamentally strong and technically interesting setup within the FMCG space.
The stock is trading near a long-term support zone, offering a good risk–reward setup for investors.
If Q2 FY 2025–26 results are strong, the stock may begin a fresh upward leg toward ₹ 650 levels.
Conversely, if the stock breaks below ₹ 470, the trend may remain weak toward the ₹ 430 zone.
For long-term investors, this zone offers a strategic accumulation opportunity backed by stability, strong distribution, and consistent brand power.
Disclaimer: aliceblueonline.com
[XAUUSD] New Week Scenario: Accumulation Awaiting Drop New Week Scenario: Accumulation Awaiting Drop - Watch for Selling at Liquidity Zone $4195
Hello traders community,
The new week begins with XAUUSD (Gold) being "restrained" in a sideways structure. However, don't let this calm deceive you. Technically, this is an accumulation pattern with a clear bearish bias.
The market is in "wait" mode, and patience will be the key to catching the next big wave.
📰 MACRO ANALYSIS: TUG OF WAR AHEAD OF FOMC
The market is caught between two opposing streams of information:
Bearish Pressure: Positive signs of a US-China trade deal are reducing the demand for safe-haven assets, putting pressure on Gold prices.
Bullish Support: The weakening USD due to expectations that the Fed will continue to cut interest rates, inadvertently provides some short-term support for the precious metal.
Decisive Factor: Traders are "lying low" waiting for this week's two-day monetary policy meeting (FOMC). This will be the main event, determining the medium-term trend of USD and Gold.
📊 TECHNICAL ANALYSIS: CONTINUATION OF BEARISH STRUCTURE
The H1 chart shows a very clear "Sell" scenario:
Price Structure: After a strong drop from the peak, the price is moving sideways in an accumulation pattern of a bearish pennant. This is a continuation structure, indicating that the Sellers are "resting" before pushing the price further down.
Ideal Sell Zone: The $4195 zone is an extremely strong resistance confluence, marked as "Liquidity strong" on the chart.
This is the 0.5 Fibonacci level, the "golden" retracement point of the entire previous decline.
This is the old support zone now turned into new resistance.
Optimal Scenario: We will wait for the price to pull back to test the $4195 liquidity zone. This is an opportunity for Sellers to enter the market with low risk and high profit potential.
🎯 TRADING PLAN (SELL SETUP)
Absolute priority is to Watch for Selling (Sell) in line with the main trend.
ENTRY (Sell): $4195
STOP LOSS: $4205
TAKE PROFIT: TP1: $4168-TP2: $4145-TP3: $4122-TP4: $4102
SUMMARY
In the context of the market awaiting FOMC news, Gold is likely to make a final "pullback" to the $4195 zone before continuing its downtrend. Be patient and wait for signals at this ideal sell zone.
Wishing traders a successful and disciplined new trading week!

XAUUSD GOLD 15 MINTS ANALYSIS BULLISH OUTLOOK XAUUSD (Gold/USD) chart on the 15-minute timeframe, and it shows a clear bullish setup structure. Let’s analyze it step by step:
---
🔍 Chart Pattern Analysis
1. Structure & Zones
The chart shows a Support Area highlighted around the 4080–4075 zone.
This indicates a strong demand zone where buyers are entering the market.
The Resistance Area is marked near the 4095–4100 level, which represents the target zone or profit-taking area.
---
2. Pattern Formation
The price movement suggests a bullish flag or consolidation breakout pattern.
After a strong upward impulse, gold entered a sideways consolidation within the support area.
The breakout from this zone signals continuation of the prior bullish trend.
---
3. Trade Setup (as seen in chart)
Entry Zone: Around 4077–4080
Target Zone: Around 4095–4100
Stop-Loss: Below 4070 support area
This setup reflects a bullish continuation with a favorable risk–reward ratio.
---
4. Volume Profile Observation
Notice higher trading volume near the support zone, confirming buying pressure.
As price moves toward resistance, volume slightly reduces, showing controlled profit booking.
---
📈 Conclusion
The chart pattern shows a bullish continuation setup on XAUUSD.
Gold is expected to move upward from the support area (4077–4080) toward the target zone (4095–4100) if the momentum continues.
Outlook: ✅ Bullish
Entry: $4080–4077
Target: $4095
Stop-Loss: $4070

XAUUSD: Structure Broken! Can the Fed Rate Cut Save Gold?Gold has just completed its first losing week in 10, after a historic rally. Following the record peak of $4,381.21, Gold experienced a sharp correction driven by profit-taking and easing US-China trade tensions. However, weaker-than-expected US CPI data has strongly reinforced expectations for an upcoming Fed rate cut, creating a significant market conflict.
I. MARKET CONTEXT ANALYSIS (H4)
Structure: The prior bullish structure has been broken, shifting the bias to bearish in the short term.
Liquidity: Market forces are now targeting key stop-loss zones to collect liquidity before the next major move.
Strategy: We look to Sell when price pulls back to the Supply Zone (Premium) and Buy when price sweeps liquidity into the strong Demand Zone.
II. DETAILED TRADING PLAN
1. SELL Scenario 📉 (At Supply Zones)
Trade 1:
Entry: $4,202 - $4,204
SL: $4,212
TP: $4,194 / $4,184 / $4,174 / $4,164
Trade 2:
Entry: $4,252 - $4,256
SL: $4,272
TP: $4,236 / $4,216 / $4,196 / $4,176
2. BUY Scenario 📈 (At Demand Zones)
Trade 1:
Entry: $4,158 - $4,161
SL: $4,151
TP: $4,168 / $4,178 / $4,188 / $4,198
Trade 2 (Critical):
Entry: $3,966 - $3,969 (Strong Demand Zone, post-liquidity sweep)
SL: $3,949
TP: $3,989 / $4,009 / $4,029 / $4,049
III. RISK MANAGEMENT NOTE
Capital: Always limit risk to ≤ 1% of capital per trade.
Confirmation: Prioritize waiting for reversal confirmation on lower timeframes (M15/M5) to optimize Risk/Reward ratio.
This is the decisive moment! Trade safe and good luck!
#XAUUSD #Gold #GoldAnalysis #Forex #Trading #Fed #Inflation

General difference between gold pricesGeneral difference between gold prices to show how etf vs actual gold perform

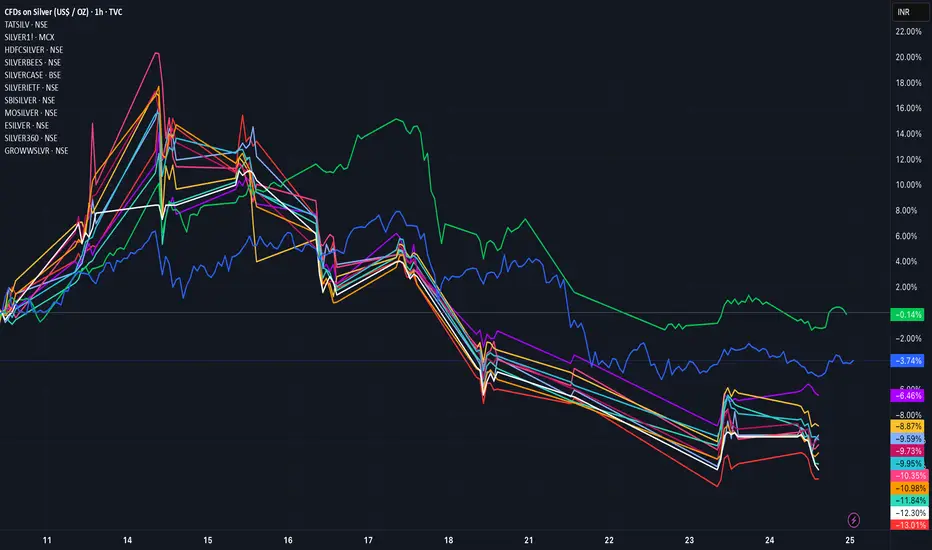
A General percentage scale between multiple Silver ETFsA General percentage scale between multiple Silver ETFs
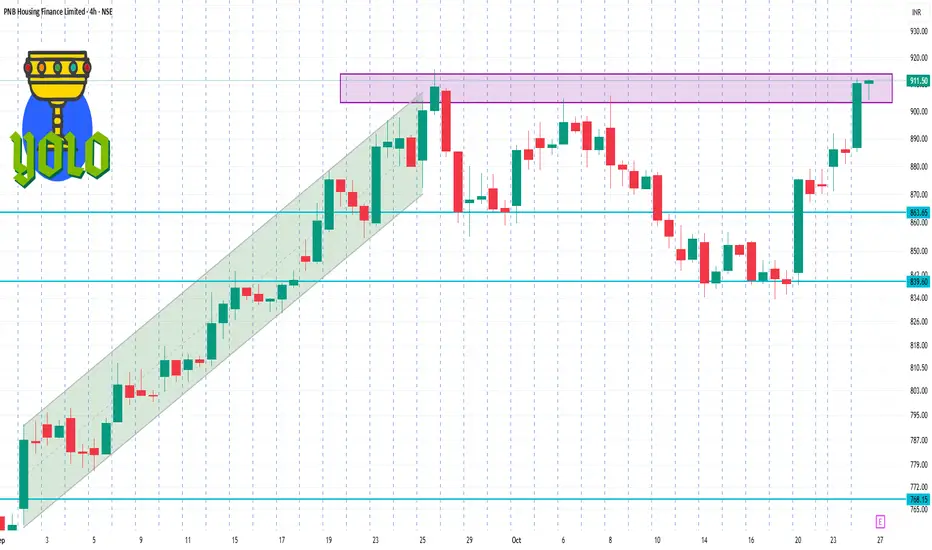
PNBHOUSING 4 Hour Time Frame PNB Housing Finance Ltd is trading at ₹907.30, reflecting a 2.68% increase from the previous close.
📊 Key Support and Resistance Levels
Support Levels: ₹885.15 (recent low), ₹826.72 (Super Trend level).
Resistance Levels: ₹912.15 (recent high), ₹1,141.90 (52-week high).
BUY TODAY SELL TOMORROW for 5%DON’T HAVE TIME TO MANAGE YOUR TRADES?
- Take BTST trades at 3:25 pm every day
- Try to exit by taking 4-7% profit of each trade
- SL can also be maintained as closing below the low of the breakout candle
Now, why do I prefer BTST over swing trades? The primary reason is that I have observed that 90% of the stocks give most of the movement in just 1-2 days and the rest of the time they either consolidate or fall
Trendline Breakout in SOUTHBANK
BUY TODAY SELL TOMORROW for 5%

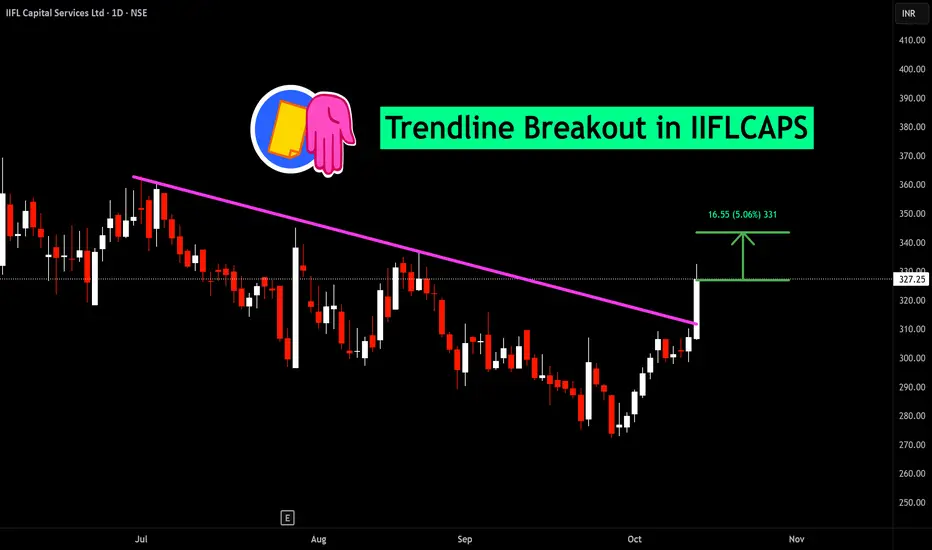
BUY TODAY SELL TOMORROW for 5%DON’T HAVE TIME TO MANAGE YOUR TRADES?
- Take BTST trades at 3:25 pm every day
- Try to exit by taking 4-7% profit of each trade
- SL can also be maintained as closing below the low of the breakout candle
Now, why do I prefer BTST over swing trades? The primary reason is that I have observed that 90% of the stocks give most of the movement in just 1-2 days and the rest of the time they either consolidate or fall
Trendline Breakout in IIFLCAPS
BUY TODAY SELL TOMORROW for 5%
A market Wrap Up on Fx, Rates, Geo- economic & Geo-PoliticsGlobal Wrap
Geo-economics was back on center stage.
The U.S. slapped new sanctions on Russia, broke off trade talks with Canada, upped its financial lifeline to Argentina’s President Milei, and geared up for the Trump–Xi meeting — which Trump insists will deliver a deal. (He’s clearly betting on optimism over precedent.)
U.S. — Soft Inflation, Fed in Focus
September inflation came in cooler than expected, boosting odds of a Fed rate cut on Wednesday. But both core and headline readings still hover a full point above the 2% target.
PMIs were upbeat; the University of Michigan survey… not so much. Consumers are clearly not feeling the vibes yet.
U.K. — Inflation Cools, Borrowing Heats Up
U.K. inflation eased to 3.8%, below forecasts, with wages also softening — pushing yields lower and giving the budget a breather. Still, borrowing for the first half of the fiscal year hit its highest since the pandemic. Less “Great British rebound,” more “Great British recalculation.”
China:
Slower, but on Target
China’s Q3 GDP growth slowed to 4.8%, bringing year-to-date expansion to 5.2% — enough to meet the official goal. Not thrilling, but Beijing will take it.
Markets:
Gold Stumbles, Oil Shines
Equities extended gains, yields stayed calm, and gold finally slipped after nine weeks of rallying. Oil had the opposite mood — both Brent and WTI closed above $60 a barrel as U.S. sanctions tightened on Russian exports.
The Week Ahead:
All eyes on geo-economics round two: the Trump–Xi summit, Argentina’s elections, and a flurry of central bank decisions.
The Fed is expected to trim rates by 25 basis points as job growth cools. Chair Powell’s press conference will be the week’s must-watch — especially with political heat still on the Fed.
The ECB is likely to stay on hold, while the Bank of Japan keeps its famously patient stance.
Meanwhile, the U.S. government shutdown drags into week four, delaying GDP and inflation data yet again — the statistical version of “please hold, your data is important to us.”
Oh BtW, there is the Bank of Canada rate decision too- no mystery there. They will cut another quarter.
Asia & Europe — Data Watch
China PMIs: Services likely up, manufacturing a tad softer.
Eurozone: Q3 GDP and inflation seen hovering near 2%.
U.K.: Consumption data to guide the late-November budget.
India — Still Strong, Slightly Softer
India’s forex reserves rose $4.5 billion to a record $702.3 billion, thanks to valuation gains.
The flash composite PMI slipped to 59.9 from 61.0 — the slowest in five months but still solidly expansionary. Services cooled, manufacturing ticked up, exports softened.
Markets flirted with record highs before mild profit-taking, as everyone awaits progress in U.S.–India trade talks.
Geopolitics — Quiet Resolve and Fiscal Reality
China: The Communist Party’s Fourth Plenum reaffirmed the 15th Five-Year Plan and doubled down on tech leadership. Tariffs may sting, but Beijing’s message is clear: “We’re not blinking.”
Japan: Sanae Takaichi took office as Prime Minister, promising stimulus — but markets aren’t buying it. With public debt at 236% of GDP, Tokyo may be out of fiscal runway. Appointing two ex-finance ministers suggests “prudence now, promises later.”
