BNB/USDT – Bullish Breakout Trade Idea✅ Entry: 871.564
🎯 Target: 890.455
⛔ Stop Loss: 862.304
🔎 Trade Rationale:
Ascending Triangle Breakout – Price has respected the rising trendline and finally broken above the neckline resistance, signaling bullish continuation.
Volume Confirmation – A notable increase in buying volume supports the breakout strength.
Resistance Flip – The previous supply zone around 870 has turned into support, adding confluence.
📊 With a strong bullish structure and favorable RRR, this setup aims to capture the next push towards 890 zone.
⚠️ Disclaimer: This is not financial advice. Always do your own research and manage risk before trading.
Fundamental Analysis

Usha Martin LtdDate 28.08.2025
Usha Martin
Timeframe : Weekly Chart
About
(1) Usha Martin Ltd is primarily engaged in manufacture and sale of steel wires, strands, wire ropes, cords, related accessories
(2) It ranks among the top five manufacturers in the sector
Revenue Mix
Product-Wise
(1) Wire Rope: 73% in H1FY25 vs 67% in FY23
(2) LRPC: 10% in H1FY25 vs 15% in FY23
(3) Wire & Strand: 9% in H1FY25 vs 10% in FY23
(4) Others: 8%
End-User Segment:
(1) Engineering: 20%
(2) Oil & Offshore: 20%
(3) Crane: 16%
(4) Construction & Infrastructure: 12%
(5) Elevator: 9%
(6) Others: 23%
Geography-Wise:
(1) India: 45%
(2) Europe: 25%
(3) Asia Pacific: 13%
(4) Middle East & Africa: 9%
(5) America: 8%
Valuations
(1) Market Cap ₹ 11,629 Cr
(2) Stock P/E 28.8
(3) ROCE 18.8 %
(4) ROE 15.8 %
(5) OPM 17%
(6) Sales Growth 9.20%
(7) Promoter 42.45%
(8) DII 11.06%
(9) FII 14.29%
Regards,
Ankur

GIFT Nifty & Global Market LinkageIntroduction
The Indian stock market has undergone a remarkable transformation in the past two decades. From being a largely domestic-focused equity market, India has steadily moved into the global financial arena. A very important step in this journey was the creation of GIFT City (Gujarat International Finance Tec-City) and the launch of GIFT Nifty, which has become India’s bridge to global markets.
GIFT Nifty is not just a derivative product; it is a symbolic step that integrates India’s financial markets more closely with global capital flows. At the same time, it creates a transparent and efficient platform for international investors to participate in India’s growth story.
But to fully understand its importance, one needs to see how GIFT Nifty is linked to global markets. Markets today are interconnected like never before—movements in Wall Street, European bourses, or Asian markets ripple across Indian indices. GIFT Nifty acts as a mirror and predictor of India’s domestic market sentiment while being shaped by international factors such as U.S. Fed policy, global interest rates, oil prices, and geopolitical risks.
This detailed explanation will cover:
What is GIFT Nifty?
The journey from SGX Nifty to GIFT Nifty.
The significance of GIFT City as India’s international financial hub.
GIFT Nifty’s role in India’s global financial integration.
Global market linkages – how global events influence GIFT Nifty.
Correlations with U.S., Europe, and Asia-Pacific markets.
Opportunities and challenges ahead.
The future of GIFT Nifty in shaping India’s financial markets.
1. What is GIFT Nifty?
GIFT Nifty is a derivative contract (futures and options) based on the Nifty 50 index, but traded on the NSE International Exchange (NSE IX) located in GIFT City, Gujarat.
It allows foreign investors to participate in India’s benchmark index without going through complex registration processes like FPI (Foreign Portfolio Investor) rules in the domestic market.
The contracts are USD-denominated, meaning global traders can easily buy and sell without worrying about INR conversion.
GIFT Nifty runs for almost 21 hours a day, covering Asian, European, and U.S. trading hours—making it one of the most globally accessible contracts linked to India.
In short, GIFT Nifty provides a real-time pulse of how global investors view India, almost around the clock.
2. From SGX Nifty to GIFT Nifty
Earlier, India’s Nifty futures were traded heavily on the Singapore Exchange (SGX), called SGX Nifty.
For nearly two decades, SGX Nifty was the main offshore gateway for international investors to take exposure to Indian equities.
Traders around the world would look at SGX Nifty quotes to predict the opening direction of the Indian stock market.
In fact, SGX Nifty became so popular that even Indian retail traders tracked it overnight to guess how the domestic Nifty would open.
However, in 2018, NSE and SGX had a legal tussle over licensing rights. Finally, in 2022, both parties agreed to shift all SGX Nifty contracts to GIFT City under a “Connect” model.
Now, SGX Nifty is history, and GIFT Nifty is the only official offshore Nifty derivative product. This transition brought trading volumes back under Indian jurisdiction, strengthening India’s position as a global financial hub.
3. GIFT City: India’s International Financial Hub
GIFT City is a special economic zone (SEZ) located in Gandhinagar, Gujarat. Its vision is to create a global financial and IT services hub on par with Singapore, Dubai, and London.
GIFT City offers tax incentives, world-class infrastructure, and a favorable regulatory environment.
The NSE International Exchange (NSE IX) operates here, hosting products like GIFT Nifty.
Banks, insurers, brokers, and global funds are setting up units in GIFT City to tap both Indian and global opportunities.
For India, GIFT City represents a strategic move: instead of foreign investors trading Indian products overseas, they now trade in India itself. This not only boosts financial flows but also gives regulators more oversight.
4. GIFT Nifty’s Role in Global Financial Integration
GIFT Nifty is more than just a futures contract—it symbolizes India’s growing integration with global markets.
Here’s how:
International Accessibility: Investors in New York, London, Hong Kong, or Dubai can trade GIFT Nifty almost anytime, making India’s equity market more globally visible.
Price Discovery: Since trading happens across time zones, GIFT Nifty reflects both global and domestic investor sentiment in near real time.
Hedging Tool: Foreign portfolio investors (FPIs) can hedge their India equity exposure more efficiently.
Liquidity & Volumes: Global participation in GIFT Nifty brings higher liquidity, tighter spreads, and deeper markets.
5. Global Market Linkages – How World Events Affect GIFT Nifty
The beauty (and complexity) of GIFT Nifty lies in its sensitivity to global developments. Because it trades almost continuously, it reacts instantly to global news.
Some of the most important global factors influencing GIFT Nifty are:
U.S. Federal Reserve Policy
Interest rate hikes or cuts in the U.S. directly impact global equity flows.
A hawkish Fed (raising rates) usually hurts risk assets like Indian equities.
GIFT Nifty futures often fall sharply after Fed announcements.
Global Economic Data
U.S. inflation, jobs data, GDP growth, and corporate earnings set the tone for global risk appetite.
Similarly, China’s growth numbers and Europe’s economic indicators affect global sentiment.
Oil Prices
India imports more than 80% of its crude oil needs. A rise in global oil prices usually weakens Indian equities.
GIFT Nifty reacts immediately to Brent crude movements.
Currency Fluctuations
A strong U.S. dollar and weak rupee reduce foreign investor returns.
GIFT Nifty often mirrors INR-USD volatility.
Geopolitical Risks
Wars, conflicts, sanctions, or supply-chain disruptions cause risk-off sentiment globally.
GIFT Nifty, like other emerging market indices, tends to fall under such conditions.
Global Equity Trends
If Wall Street has a strong rally, GIFT Nifty usually trades higher in the U.S. session.
If Asian markets crash early morning, GIFT Nifty shows weakness in the Asian session.
6. Correlation with Global Markets
Let us break down the interconnectedness between GIFT Nifty and major global markets.
a. Link with U.S. Markets (Wall Street)
The U.S. markets (Dow Jones, S&P 500, Nasdaq) are the most influential for GIFT Nifty.
After U.S. closing, GIFT Nifty in the U.S. time zone reacts sharply to tech earnings, Fed speeches, or macro data.
Example: If Nasdaq falls 2% overnight, GIFT Nifty usually opens lower in the Asian session.
b. Link with European Markets
During European hours, GIFT Nifty trades alongside FTSE (UK), DAX (Germany), and CAC (France).
Eurozone recession fears or ECB rate moves affect GIFT Nifty sentiment.
c. Link with Asian Markets
In the morning, GIFT Nifty trades in sync with Nikkei (Japan), Hang Seng (Hong Kong), and Shanghai Composite (China).
A sell-off in China often triggers weakness in GIFT Nifty.
Conversely, optimism in Asian markets boosts Indian sentiment.
7. Opportunities Created by GIFT Nifty
Better Price Discovery for India’s Market
Instead of relying on SGX Nifty, Indian markets now have their own offshore derivative hub.
Boost to GIFT City Ecosystem
Trading volumes, jobs, and financial services activity in GIFT City have surged.
Global Participation in India’s Growth
India is one of the fastest-growing economies. GIFT Nifty allows global funds to participate directly.
Hedging Benefits for FPIs
Foreign investors can protect themselves against Indian market volatility.
Strengthening Rupee’s Global Role
Even though contracts are in USD, India gains visibility as a financial center.
8. Challenges Ahead
Despite its success, GIFT Nifty faces challenges:
Liquidity Migration: Ensuring that volumes remain strong compared to global exchanges.
Awareness: Many global traders still see SGX Nifty as their reference, though it no longer exists.
Competition: Other financial hubs like Singapore and Dubai remain strong competitors.
Volatility Risk: High global interconnectedness means sudden shocks (like COVID-19 or geopolitical events) affect GIFT Nifty instantly.
9. The Future of GIFT Nifty
Looking forward, GIFT Nifty is set to become a cornerstone of India’s financial globalization.
Volumes are rising every month as more global institutions migrate to GIFT City.
New products (like GIFT Bank Nifty, sectoral derivatives, ETFs) may be introduced.
India’s inclusion in global bond and equity indices will further increase offshore demand.
Over the next decade, GIFT City could evolve into a mini-Singapore for Asia.
Conclusion
GIFT Nifty is more than just a trading contract—it is a symbol of India’s financial maturity. By shifting from SGX to GIFT City, India ensured that its financial products are traded on its own soil, strengthening sovereignty and transparency.
At the same time, GIFT Nifty remains deeply connected with global markets. Whether it’s the U.S. Fed, crude oil prices, China’s slowdown, or geopolitical tensions, GIFT Nifty reflects the pulse of global investor sentiment toward India in real time.
In a world where capital moves at the speed of light, GIFT Nifty serves as India’s window to the world and the world’s window to India. Its success will not only strengthen India’s equity markets but also position GIFT City as a major international financial hub in the decades to come.

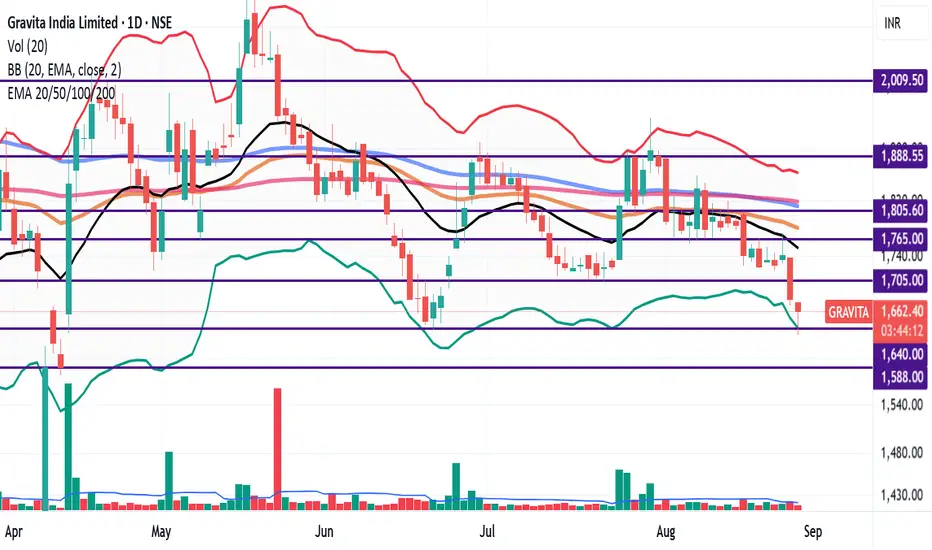
Stock Analysis: Buying Opportiunity in Gravita India Ltd.?.Introduction:
Gravita India Ltd is one of the largest lead producer in India. The company's business is organized across four specialized verticals: Lead Recycling (flagship), Aluminum recycling, Plastic recycling and Turnkey projects.
The company also has expertise in the recycling of used batteries, cable scrap/other Lead scrap, Aluminum scrap, Plastic scrap, etc.
Fundamentals:
Market Cap: ₹ 12,200 Cr.;
Stock P/E: 36.0 (Ind. P/E: 16.55) 👎;
ROCE: 21.5% 👍; ROE: 21.2% 👍;
3 Years Sales Growth: 20% 👍
3 Years Compounded Profit Growth: 30% 👍
3 Years Stock Price CAGR: 74% 👍
Technicals:
Gravita trading below all key EMAs like 20 EMA(Black Line), 50 EMA (Orange Line), 100 EMAs (Blue Line) and 200 EMA (Pink line).
The stock exhibits a strong Bearish Momentum - Below Short, Medium and Long Term Moving Averages.
The stock has Superior Financial Strength, High Growth Trend Stock Priced at High Valuations.
Resistance levels: 1705, 1765, 1808
Support levels: 1640, 1588
Note: As per technical analysis, downside risk is minimum, and upside potential is huge.
Research Recommendations: Axis Securities sees 40% upside potential 🔥
Key Factors that could guide the growth story:
Capacity Rampup on track - Current capacity to see an addition of 1L MTPA by year end and 7L MTPA by FY28.
Volume growth in Lead and Aluminium - Strong performance in Q1 was majorly due to 96% YoY jump in volumes of aluminium and 10% YoY increase in lead.
Growth to kick from H2FY26 - Company is targeting 25% volume CAGR and 35% profitability CAGR in long term. The majority of volume growth (15-16%) would be from existing capacity while 8-10% from new capacity addition.
just wait bank niftydont enter bank nifty still bearish wait for demand zone still price going to their

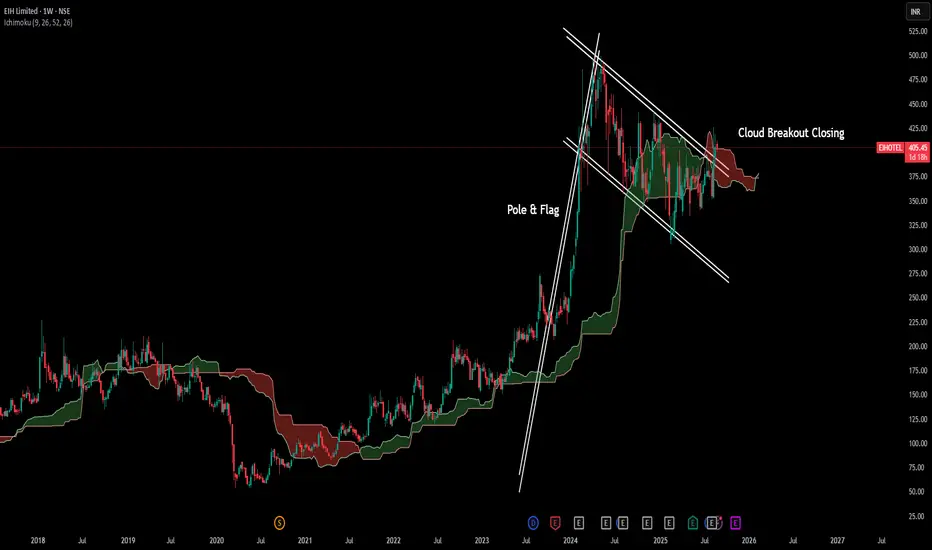
EIH LtdDate 27.08.2025
EIH
Timeframe : Weekly Chart
Technical Remark :
(1) Buy Above 412
(2) Sell Below 401
(3) Weekly Candle spinning Top
(4) Breakout Closing Pole & Flag + Ichimoku Cloud
Fundamental Remarks :
Pioneer of Luxury Hotels in India
(1) Oberoi
(2) Trident
(3) Maidens
Hotels
(1) Domestic Keys : 3,772 keys across Oberoi, Trident, and Maidens brands.
(2) International Keys : 497 under The Oberoi Brand
Pipeline Project
(1) Expansion plans include 20 properties
(2) Aiming 1,350 keys by 2029 (11 domestic and 9 international)
Additional Businesses
(1) Air Charter Services
(2) Car Rental through a joint venture (AVIS India Mobility Solutions)
(3) Mixed-use developments, including retail and F&B spaces
Key Data Points
Owned Hotels
(1) ARR ₹16,940
(2) Occupancy % 73%
(3) RevPAR ₹12,364
Managed Hotels
(1) Average Daily Rate ₹16,398
(2) Occupancy 72%
(3) RevPAR ₹11,807
Zero Debt and Higher Asset Base
(1) Has total assets of 5267 Crs
(2) Zero debt
(3) The company was cash-positive with ~Rs. 711 Crs
Key Valuations
(1) Stock PE 32
(2) ROCE 23.4%
(3) ROE 18%
(4) OPM 37.4%
(5) Sales Growth 9.86%
(6) Profit Growth 23.55%
Regards,
Ankur
KNR heat exchanger Financial --->
Business-
Makes heat exchangers & coils for AC, refrigeration, cold storage, data centers + new products for railways & industrial cooling.
Exports-
Growing fast (Canada, EU, UAE); target 30–35% of sales by FY26.
Growth Drivers-
New Railway business: Got approval, delivered first 10 radiators.
Capacity expansion: New subsidiary plant (Neemrana), 6× bigger, to start in Q2 FY26.
PLI Incentive: ₹141 Cr approved under government scheme (extra income support).
Exports: Targeting US/EU/Canada with AHRI-certified lab tie-up.
ERP & Solar: SAP Cloud system live; solar power to cut costs
High-growth niche player, but stock is expensive. Big upside if exports + Railways + PLI click, downside if margins or execution slip.
----Technical ----
Entry - 907( current level)
Sl - 833( 9% around risk)
Target - just trailing with avg sma/ema

Part 2 Support ans ResistanceAdvantages of Options
High leverage (small money → big exposure).
Flexibility (profit in up, down, or sideways markets).
Risk defined for buyers (can lose only premium).
Useful for hedging portfolios.
Risks of Options
Time decay: Value decreases as expiry approaches.
High leverage can cause big losses (especially for sellers).
Complexity: Needs knowledge of Greeks, volatility, etc.
Emotions: Options move fast → fear & greed affect traders.
Options Greeks (Advanced but Important)
The “Greeks” help measure how option prices move with market factors:
Delta → Change in option price vs stock price.
Gamma → Rate of change of Delta.
Theta → Time decay (how much premium falls daily).
Vega → Impact of volatility on premium.
Rho → Impact of interest rates.
👉 Example: If an option has Theta = -10, it means the premium will lose ₹10 per day (if all else same).

Option Trading Introduction to Options Trading
Imagine you want to buy a house. You like one particular property, but you don’t want to commit right away. Instead, you tell the seller:
"Here’s ₹1 lakh. Keep this house reserved for me for the next 6 months. If I decide to buy, I’ll pay you the agreed price. If not, you can keep this ₹1 lakh."
That ₹1 lakh you gave is called a premium. The deal you made is an option — a contract that gives you the right but not the obligation to buy the house.
This is the core idea of options trading: you pay a small premium to get the right to buy or sell something (like stocks, indexes, commodities, etc.) at a fixed price in the future.
What is an Option?
An option is a contract between two parties:
Buyer of option (the one who pays the premium).
Seller of option (the one who receives the premium).
The buyer has the right (but not obligation) to buy or sell at a certain price. The seller has the obligation to fulfill the deal if the buyer exercises the option.
Key Terms:
Underlying Asset → The thing on which the option is based (stocks like Reliance, Infosys, indexes like Nifty, commodities, etc.).
Strike Price → The pre-decided price at which the buyer can buy or sell.
Premium → The cost of buying the option.
Expiry → The last date till which the option is valid.
Lot Size → Options are traded in fixed quantities, not single shares. Example: Nifty options lot = 50 shares.

BTC 1H Long1. Current Price
BTC is trading around 110,879 USDT at the time of the chart.
2. Trendline
• An ascending trendline is drawn from the recent bottom, showing short-term bullish momentum.
• Price is testing support at this trendline.
3. Entry Zone
• Marked slightly above 110,500 USDT.
• Idea: enter long position as price holds above support & trendline.
4. DCA (Dollar-Cost Average) Zone
• Around 109,383.5 USDT.
• If price dips here, it’s a secondary buy zone to improve average entry.
5. Stop Loss (Invalidation)
• “1H Closing Below” ~108,534 USDT.
• If BTC closes below this level on 1H, the long setup is invalid.
6. Targets
• TP1 (Take Profit 1): 114,658 USDT
• TP2 (Take Profit 2): 115,980 USDT
• These are resistance levels where partial or full profits can be booked.
7. Risk-Reward Setup
• Entry around 110,500 → Stop below 108,534 → TP1 at 114,658, TP2 at 115,980.
• This gives a good Risk-to-Reward (RRR > 2) if the setup plays out.
8. EMA Levels
• Multiple EMAs (20/50/100/200) are shown.
• Price is still trading below the EMAs, meaning trend is bearish overall, but this setup is a counter-trend long scalp.
⸻
📌 Summary
• Bullish Scenario: If BTC holds above the entry and trendline, it can push toward 114,658 (TP1) and 115,980 (TP2).
• Bearish Scenario: If BTC breaks below 108,534 on 1H close, the long setup fails, and price may revisit lower supports.

Vesuvius India LtdDate 27.08.2025
Vesuvius India
Timeframe : Day Chart
About
Vesuvius India Ltd manufactures and trades refractory goods
Business Divisions
(1) Steel division (Flow control solutions)
(2) Foundry division (Sensors and probes)
Product Profile
(a) Shrouds
(b) Stoppers
(c) Pre-cast products
(d) Nozzles
(e) Crucibles
(f) Castable
(g) Taphole clays
(h) Casting and refractory related services
Solutions Offered
(a) Advanced refractory solutions
(b) Crucible refractory solutions
(c) Flow control refractory solutions
(d) Digital measurement refractory solutions
User Industries
(1) Aluminium, cement, lime, mineral processing, hydrocarbon processing, refineries, and power generation, steel and foundry segment
Revenue Breakup
(1) Manufacturing of Refractory Products 57%
(2) Provisioning of refractory services 43%
Geographical Revenue Split
(1) Exports to 13 countries
(2) 3.40% of revenue from exports
Valuations
(1) Market Cap ₹ 10,328 Cr
(2) Stock P/E 41
(3) ROCE 25.5%
(4) ROE 19.3%
(5) OPM 18%
(6) Sales Growth 12.22%
(7) Promoter 55.57%
(8) DII 20.83%
(9) FII 14.31%
Regards,
Ankur

Introduction to Stock Markets1. What is a Stock Market?
At its core, a stock market is a marketplace where buyers and sellers trade shares of publicly listed companies. A share represents a unit of ownership in a company, meaning that if you own a share, you essentially own a part of that company.
Stock markets serve multiple functions:
Raising Capital: Companies issue shares to raise funds for expansion, research, or debt repayment.
Liquidity: They allow investors to buy and sell shares easily.
Price Discovery: They determine the market value of companies based on supply and demand.
Investment Opportunities: They provide avenues for individuals and institutions to grow their wealth.
Two primary types of stock markets exist:
Primary Market: Where companies issue new shares through an Initial Public Offering (IPO) to raise capital.
Secondary Market: Where existing shares are traded among investors. Examples include the New York Stock Exchange (NYSE), NASDAQ, and India’s National Stock Exchange (NSE) and Bombay Stock Exchange (BSE).
2. History and Evolution of Stock Markets
The concept of stock markets dates back to the 17th century. The first organized stock exchange, the Amsterdam Stock Exchange, was established in 1602 for trading shares of the Dutch East India Company. Over time, stock markets spread globally, evolving into sophisticated institutions with advanced trading systems, regulations, and digital platforms.
Key milestones in stock market history include:
1792: The Buttonwood Agreement in New York, which marked the start of the NYSE.
1971: NASDAQ introduced electronic trading, revolutionizing speed and accessibility.
1990s: Introduction of online trading platforms, making markets accessible to retail investors.
3. Importance of Stock Markets
Stock markets are critical for both individual investors and the overall economy.
3.1 Economic Growth
Companies raise capital through stock issuance to expand operations, hire employees, and innovate.
Capital formation fuels industrial growth, increasing productivity and GDP.
3.2 Wealth Creation
Long-term investment in equities historically outperforms other asset classes like bonds or savings accounts.
Compound growth in stock investments allows individuals to accumulate substantial wealth over time.
3.3 Price Transparency
Stock markets provide real-time pricing based on supply and demand, reflecting the true value of companies.
Transparent markets reduce information asymmetry and promote investor confidence.
3.4 Corporate Governance
Listed companies must comply with regulatory norms and disclose financial information, ensuring accountability.
Shareholders gain a voice in company decisions through voting rights.
4. Types of Stocks
Stocks are not uniform. They vary based on ownership, risk, and returns. Common types include:
4.1 Common Stocks
Represent ownership in a company with voting rights.
Returns come in the form of dividends and capital appreciation.
4.2 Preferred Stocks
Offer fixed dividends but limited voting rights.
Generally less volatile than common stocks.
4.3 Growth vs. Value Stocks
Growth Stocks: Companies expected to grow faster than the market average. Returns are mostly capital gains.
Value Stocks: Companies trading below their intrinsic value, often providing steady dividends.
4.4 Blue-Chip Stocks
Large, financially stable companies with strong performance histories.
Example: Reliance Industries, Apple, Microsoft.
5. How the Stock Market Works
The stock market operates on the principles of supply and demand. Prices rise when demand exceeds supply and fall when supply exceeds demand.
5.1 Market Participants
Retail Investors: Individuals trading for personal wealth creation.
Institutional Investors: Banks, mutual funds, hedge funds trading in large volumes.
Traders: Short-term participants aiming to profit from price movements.
Market Makers: Entities that ensure liquidity by buying and selling securities.
5.2 Stock Exchanges
A stock exchange is a regulated platform where stocks are bought and sold.
Examples include NYSE, NASDAQ, NSE, and BSE.
Exchanges maintain transparency, liquidity, and security of transactions.
5.3 Trading Process
Placing an Order: Investors place buy/sell orders through brokers.
Matching Orders: Exchanges match buy and sell orders based on price and time priority.
Settlement: Transfer of ownership and funds between buyer and seller, usually within 2–3 days.
6. Factors Affecting Stock Prices
Stock prices fluctuate constantly. Factors include:
Company Performance: Revenue, profits, and management quality influence investor sentiment.
Economic Indicators: GDP growth, inflation, and unemployment rates impact markets.
Market Sentiment: Investor psychology, fear, and greed can cause volatility.
Global Events: Wars, pandemics, and geopolitical tensions affect prices.
Interest Rates: Higher rates can reduce investment in equities.
7. Stock Market Indices
A stock market index measures the performance of a group of stocks. Examples:
Nifty 50 (India): Represents 50 large companies listed on NSE.
Sensex (India): Comprises 30 leading BSE-listed companies.
S&P 500 (USA): Tracks 500 major US companies.
Indices provide a snapshot of market trends and investor sentiment.
8. Investment Strategies
Investors use various strategies to achieve their financial goals.
8.1 Long-Term Investing
Focused on wealth creation over years.
Often involves buying and holding blue-chip or growth stocks.
8.2 Trading
Short-term buying and selling to profit from price fluctuations.
Types include day trading, swing trading, and momentum trading.
8.3 Value Investing
Buying undervalued stocks based on fundamental analysis.
Popularized by Warren Buffett.
8.4 Growth Investing
Focused on companies with high growth potential.
Prioritizes capital gains over dividends.
9. Risks in the Stock Market
Investing in stocks involves risk. Common risks include:
Market Risk: Overall market movements affect stock prices.
Company Risk: Poor management or declining performance can lead to losses.
Liquidity Risk: Difficulty in selling stocks without affecting price.
Interest Rate Risk: Rising rates may reduce stock prices.
Inflation Risk: High inflation can erode real returns.
Risk management strategies, such as diversification and stop-loss orders, are crucial.
10. Regulatory Framework
Stock markets are heavily regulated to protect investors and maintain stability. Key regulatory bodies include:
SEBI (India): Securities and Exchange Board of India.
SEC (USA): Securities and Exchange Commission.
FCA (UK): Financial Conduct Authority.
These organizations enforce rules on listing, trading, disclosures, insider trading, and investor protection.
Conclusion
The stock market is a powerful tool for wealth creation, economic growth, and corporate financing. Understanding its structure, functions, and risks is essential for any investor. While markets can be volatile and unpredictable, disciplined investing, research, and risk management can make the stock market a reliable avenue for achieving financial goals.
Investing in stocks is not just about money—it’s about knowledge, patience, and strategic decision-making. By embracing these principles, anyone can navigate the stock market successfully, turning it into a lifelong tool for financial empowerment.
Emami LtdDate 26.08.2025
Emami
Timeframe : Day Chart
About
The company is one of India’s leading FMCG Companies engaged in the manufacturing & marketing of personal care & healthcare products.
Brand Portfolio
(1) BoroPlus - 67.7% market share
(2) Healthcare - Zandu, cough syrups, Chyavanprash, honey, Pancharishta etc
(3) Navratna & Dermicool - 62.8% market share
(4) Pain Management - 54% market share. Zandu, Mentho Plus, and Fast Relief
(5) Male Grooming - Fair and Handsome. 67.3% market share
(6) Kesh King - 29.4% market share
Geographical Split
(1) Domestic: 84%
(2) International: 16%
International Business Mix
(1) MENA: 45%
(2) SAARC & SEA: 39%
(3) CIS: 10%
(4) Others: 6%
Note*
(1) MENA : Middle East and North Africa
(2) SEA : South East Asia
(3) CIS : Commonwealth Of Independent States
(4) SAARC : South Asian Association for Regional Cooperation
Manufacturing Facilities
(1) The company operates its 5 manufacturing facilities
(2) 35 third-party manufacturing facilities in India and 4 facilities overseas
Advertisement Expenses
(1) Company spends around 17.7% of its revenues on advertising and promotion
Valuations
(1) Market Cap ₹ 25,018 Cr
(2) Stock P/E 30.6
(3) ROCE 32.4%
(4) ROE 30.2%
(5) OPM 26.55%
(6) Profit Growth 9.96%
(7) Sales Growth 4.06%
(8) Promoter 54.84%
(9) DII 24.06%
(10) FII 11.89%
Regards,
Ankur

Part 1 Candlestick PatternPractical Examples
Example 1: Bullish Trade
Buy 1 call of Stock A at ₹100 strike, premium ₹5.
Stock rises to ₹120.
Profit = (120 – 100) – 5 = ₹15 per share.
Example 2: Bearish Trade
Buy 1 put of Stock B at ₹150 strike, premium ₹8.
Stock falls to ₹130.
Profit = (150 – 130) – 8 = ₹12 per share.
Example 3: Covered Call
Own Stock C at ₹200.
Sell call at ₹220, premium ₹5.
Stock rises to ₹230.
Profit = (220 – 200) + 5 = ₹25 (missed extra ₹10).
Protection against small drops due to premium received.
Advantages of Options
Limited risk for buyers
Leverage potential
Flexibility in strategy
Hedging capabilities
Profit from multiple market directions

Trading Master Class With ExpertsRisk and Reward in Options
Options provide defined risk for buyers and potential risk for sellers:
Buyers: Maximum loss = premium paid, profit = theoretically unlimited for calls, limited for puts.
Sellers (writers): Maximum profit = premium received, risk = potentially unlimited for uncovered calls, high for puts.
Example:
Selling a call without owning the stock (naked call) can lead to unlimited losses if the stock skyrockets.
Buying a put limits risk but can still profit from sharp downward moves.
Hedging with Options
Options are a powerful tool for hedging investments:
Protective Put: Buying a put on a stock you own protects against a decline.
Collar Strategy: Buy a put and sell a call to limit both upside and downside risk.
Portfolio Insurance: Large investors use index options to protect portfolios during market volatility.

Part 3 Learn Institutional Trading Why Trade Options?
Options are popular for several reasons:
Leverage: You can control a large number of shares with a relatively small investment (premium).
Hedging: Protect your portfolio against downside risk using options as insurance.
Income Generation: Selling options can provide regular income (premium received).
Flexibility: Options allow you to profit from upward, downward, or sideways movements.
Risk Management: Losses can be limited to the premium paid.
Types of Options Strategies
Options strategies can be simple or complex, depending on the trader’s goal:
Basic Strategies
Long Call: Buy a call expecting the stock to rise.
Long Put: Buy a put expecting the stock to fall.
Covered Call: Hold the stock and sell a call to earn premium.
Protective Put: Buy a put to protect against downside risk on a stock you own.

Part 2 Ride The Big MovesDisadvantages of Options
Complexity for beginners
Time decay risk (premium can vanish)
Unlimited risk for sellers of uncovered options
Requires active monitoring for effective trading
Tips for Successful Options Trading
Understand the underlying asset thoroughly.
Start with basic strategies like long calls, puts, and covered calls.
Use proper risk management and position sizing.
Keep track of Greeks to understand sensitivity.
Avoid over-leveraging.
Monitor market volatility; high volatility can inflate premiums.
Use demo accounts or paper trading for practice.

Cup and Handle Breakout in NYKAAA potential Cup and Handle breakout is forming in Nykaa (FSN E Commerce Ventures) on the daily chart. Price action shows a classical rounded base followed by handle consolidation, with prices breaking above resistance at ₹229.50. The breakout target is approximately ₹4.70 higher (about 2% upside), supporting bullish momentum. Additionally, the September 230 CALL option has surged 13.89%, reinforcing strong follow-through and trader interest on the breakout. This setup fits textbook continuation patterns and suggests a positive short-term outlook for Nykaa as long as prices hold above the breakout level.
Trade Context for Posting
Pattern: Cup and Handle breakout.
Underlying: FSN E Commerce Ventures (Nykaa), NSE daily chart.
Breakout Level: ₹229.50.
Target Upside: ₹4.70 (approx. 2% from breakout), option up 13.89%.
Validation: Bullish price action, volume expansion, supportive option activity.
Trade Plan: Consider long positions above ₹229.50, with stop-loss below the handle low. Watch for sustained momentum and volume, aiming for the indicated breakout objective.
This trade is based on established technical analysis principles, showing strong risk-reward from current levels, and is backed by sharp movement in related call options.

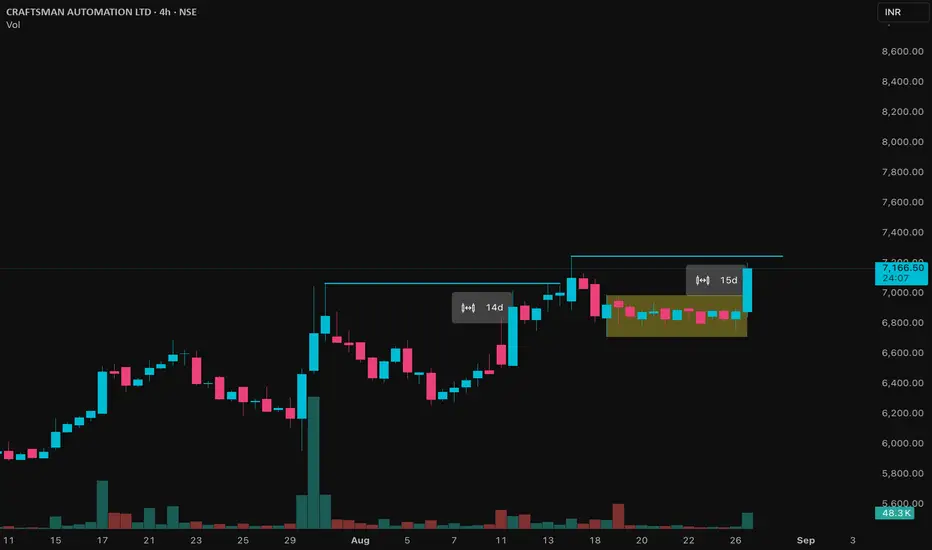
Craftsman Price ActionCraftsman Automation’s share price in August 2025 has been trading near ₹6,839, showing resilient performance and hitting close to the upper end of its 52-week range. The stock has surged over 24% in the past three months, demonstrating strong momentum thanks to improved sentiment and periodic bullish technical signals, such as recent moving average crossovers.
Financially, the company posted robust annual sales growth above 20% and consolidated net sales exceeding ₹1,700 crore, but short-term earnings growth has been mixed with some volatility in profit trajectory. Craftsman’s valuation remains notably high, with its price-to-earnings ratio elevated above 77, reflecting investor expectations for strong future growth. This optimism is underpinned by industry forecasts projecting EPS growth over the next few years at a rate higher than the sector average.
Promoter holding at nearly 49% reflects management commitment, and steady interest and employee expenses indicate stable operations. Technically, bullish signals on moving averages have led to short-term price gains, while bearish signals on other indicators may cause small dips from time to time. Overall, Craftman Automation is seen as a premium growth play with strong operational results and solid long-term prospects, though investors should be mindful of valuation risks and short-term price swings.
Grasim: 25-Year Growth Story Reaches New HeightsTechnical Analysis
Grasim Ltd presents one of the most remarkable long-term growth stories in Indian markets. Having tracked this stock since 1999 when it traded below ₹20, the journey has been extraordinary. From those humble levels, the stock demonstrated a steady bullish rally reaching ₹2,880 by July 2024, representing a phenomenal 144x growth over 25 years.
Post the July 2024 peak, the stock corrected to below ₹2,300 levels. However, following massive FY2025 results, the stock regained momentum and created a new all-time high at ₹2,896. This establishes the ₹2,800-₹2,900 zone as a strong resistance area that has been tested multiple times.
Currently trading at ₹2,811, the stock is consolidating near the resistance zone. A decisive breakout above this supply zone with confirmation through bullish candlestick patterns would signal the next leg of the rally.
Entry Strategy: Wait for breakout above ₹2,900 zone with volume confirmation and bullish patterns.
Targets:
Target 1: ₹3,000
Target 2: ₹3,100
Target 3: ₹3,200
Stop Losses:
Minor Support: ₹2,600-₹2,700 (minor demand zone)
Major Support: ₹2,200-₹2,300 (strong demand zone)
If ₹2,200-₹2,300 zone is taken down, no more expectations on this stock.
Q1 FY26 Financial Highlights (vs Q4 FY25 & Q1 FY25)
Total Income: ₹40,118 Cr (↓ -9% QoQ from ₹44,267 Cr; ↑ +16% YoY from ₹34,610 Cr)
Total Expenses: ₹31,296 Cr (↓ -12% QoQ from ₹35,517 Cr; ↑ +12% YoY from ₹27,927 Cr)
Operating Profit: ₹8,822 Cr (↑ +1% QoQ from ₹8,750 Cr; ↑ +32% YoY from ₹6,682 Cr)
Profit Before Tax: ₹3,834 Cr (↓ -4% QoQ from ₹3,996 Cr; ↑ +42% YoY from ₹2,691 Cr)
Profit After Tax: ₹2,767 Cr (↓ -7% QoQ from ₹2,973 Cr; ↑ +34% YoY from ₹2,066 Cr)
Diluted EPS: ₹20.85 (↓ -5% QoQ from ₹21.98; ↑ +28% YoY from ₹16.33)
Fundamental Highlights
Grasim Industries delivered robust Q1 FY26 performance with consolidated revenue rising 16% YoY to ₹40,118 crore, EBITDA growing 36%, and PAT climbing 32%. The company crossed the significant ₹1.5 lakh crore TTM milestone with standalone revenue surging 34% YoY to all-time high of ₹9,223 crore.
Market cap stands at ₹1,91,225 crore (up 2.37% in 1 year) with promoter holding at 43.1%. Stock reached all-time high of ₹2,896.55 before current consolidation, demonstrating strong momentum.
Key growth drivers include diversified business portfolio spanning Cellulosic Fibre, Chemicals, Cement, and new ventures. Birla Opus paints brand targets ₹10,000 crore gross revenue within 3 years, positioning to become the second-biggest player in the ₹80,000 crore decorative paints market.
Cellulosic Staple Fibre revenue grew 7% YoY with domestic volumes higher by 2% YoY, while Chemicals EBITDA surged 36% YoY. The strong performance across segments validates the diversification strategy.
Strong subsidiary performance from UltraTech Cement and Aditya Birla Capital continues to drive consolidated growth, with management expressing confidence in sustained momentum across all business verticals.
Conclusion
Grasim's remarkable 25-year journey from sub-₹20 levels to ₹2,896 all-time high, backed by strong Q1 FY26 fundamentals showing 32% PAT growth and ₹1.5 lakh crore TTM milestone, validates the long-term growth thesis. The ₹10,000 crore Birla Opus paints target and diversified portfolio provide multiple growth engines. Breakout above ₹2,900 resistance could trigger the next rally toward ₹3,200 levels. Key support zones at ₹2,600-₹2,700 and ₹2,200-₹2,300 provide risk management levels.
Disclaimer: lnkd.in

Ramco Cements: Higher Highs Journey Reaches New PeakTechnical Analysis
Ramco Cements has demonstrated an exceptional long-term uptrend since 2006, continuously making higher highs and higher lows. The stock showcased remarkable growth from ₹50-60 levels to ₹1,100 by July 2021, representing an extraordinary 18-20x growth over 15 years.
Post the 2021 peak, the stock corrected to ₹600 levels but maintained its structural uptrend by forming higher lows. Following this pattern, it steadily climbed back to ₹1,100 levels, respecting the higher low formation.
The breakthrough moment came with expectations of positive Q1 FY26 results. The stock decisively broke its previous all-time high and surged to ₹1,200. Despite achieving positive outcomes in the results, some profit booking has occurred, bringing the stock to current levels of ₹1,050.
Entry Strategy: Enter on any dips with focus on continuation of the higher highs pattern.
Targets:
Target 1: ₹1,200
Target 2: ₹1,300
Target 3: ₹1,400
Stop Losses:
Major Support: ₹800 (higher low support zone)
If ₹800 level is taken down, no more expectations on this stock as it would break the higher low pattern.
Q1 FY26 Financial Highlights (vs Q4 FY25 & Q1 FY25)
Total Income: ₹2,074 Cr (↓ -13% QoQ from ₹2,397 Cr; ↓ -1% YoY from ₹2,094 Cr)
Total Expenses: ₹1,676 Cr (↓ -19% QoQ from ₹2,078 Cr; ↓ -5% YoY from ₹1,773 Cr)
Operating Profit: ₹398 Cr (↑ +25% QoQ from ₹319 Cr; ↑ +24% YoY from ₹320 Cr)
Profit Before Tax: ₹115 Cr (↑ +150% QoQ from ₹46 Cr; ↑ +140% YoY from ₹48 Cr)
Profit After Tax: ₹85 Cr (↑ +227% QoQ from ₹26 Cr; ↑ +130% YoY from ₹37 Cr)
Diluted EPS: ₹3.60 (↑ +210% QoQ from ₹1.16; ↑ +129% YoY from ₹1.57)
Fundamental Highlights
Ramco Cements delivered remarkable Q1 FY26 turnaround with consolidated PAT surging 227% QoQ and 130% YoY to ₹85 crore, driven by significant cost optimization and operational efficiency improvements. The company achieved this despite marginal revenue decline.
Market cap stands at ₹25,673 crore (up 34.2% in 1 year) with stable promoter holding at 42.6%. Stock demonstrated impressive 52.33% increase over the past year against Sensex's 2.15%, showcasing strong outperformance.
The company recently unveiled 'Hard Worker' construction chemicals brand with FY25 division revenue of ₹210 crore, targeting ambitious ₹2,000 crore in 4-5 years. This strategic diversification opens new growth avenues beyond traditional cement business.
Stock reached all-time high of ₹1,206.60 before current consolidation, with technical analysis showing strong institutional buying support. The breakout was accompanied by above-average volumes, adding conviction to the upward move.
Despite recent profit booking post-results, the stock maintains strong uptrend structure with 52-week high at ₹1,206.60 and current trading around ₹1,063, indicating healthy correction within the bull trend.
Conclusion
Ramco Cements' exceptional 227% QoQ PAT recovery and 18-year higher highs pattern reaching new ₹1,200 peak validates the long-term uptrend thesis. The construction chemicals diversification targeting ₹2,000 crore revenue and strong institutional support provide additional growth catalysts. Current consolidation near ₹1,063 offers attractive entry for targeting ₹1,400 levels. Critical support at ₹800 must hold to maintain higher low pattern integrity.
Disclaimer: lnkd.in

Jyothy Labs LtdDate 26.08.2025
Jyothy Labs
Timeframe : Day Chart
Business Segments
(1) Fabric Care 44%
(2) Dishwashing 34%
(3) Personal Care 11%
(4) Household Insecticides 6%
(5) Others 5%
Distribution Mix
(1) Urban 60%
(2) Rural 40
Brands
Fabric Care
(1) Ujala & Henko
(2) Mr. White & Morelight - Liquid Detergent
(3) 84% market share (Ujala)
Dishwashing
(1) EXO and PRIL
(2) 13.7% market share
Personal Care
(1) Margo & Jovia
Household Insecticides
(1) Mosquito repellent coil - Maxo
(2) 23.8% market share
Manufacturing Capabilities
(1) The company operates 23 manufacturing plants across India
Valuations
(1) Market Cap ₹ 12,775 Cr
(2) Stock P/E 34.9
(3) ROCE 24.6 %
(4) ROE 19.0 %
(5) OPM 18%
(6) Profit Growth 2.72%
(7) Sales Growth 3.27%
(8) Promoter Holding 62.88%
(9) FII 12.66%
(10) DII 15.98%
Regards,
Ankur

Grasim: 25-Year Growth Story Reaches New Heights🔍 Technical Analysis
Grasim Ltd presents one of the most remarkable long-term growth stories in Indian markets. Having tracked this stock since 1999 when it traded below ₹20, the journey has been extraordinary. From those humble levels, the stock demonstrated a steady bullish rally reaching ₹2,880 by July 2024, representing a phenomenal 144x growth over 25 years.
Post the July 2024 peak, the stock corrected to below ₹2,300 levels. However, following massive FY2025 results, the stock regained momentum and created a new all-time high at ₹2,896. This establishes the ₹2,800-₹2,900 zone as a strong resistance area that has been tested multiple times.
Currently trading at ₹2,811, the stock is consolidating near the resistance zone. A decisive breakout above this supply zone with confirmation through bullish candlestick patterns would signal the next leg of the rally.
Entry Strategy: Wait for breakout above ₹2,900 zone with volume confirmation and bullish patterns.
🎯 Targets:
Target 1: ₹3,000
Target 2: ₹3,100
Target 3: ₹3,200
🚫 Stop Losses:
Minor Support: ₹2,600-₹2,700 (minor demand zone)
Major Support: ₹2,200-₹2,300 (strong demand zone)
If ₹2,200-₹2,300 zone is taken down, no more expectations on this stock.
💰 Q1 FY26 Financial Highlights (vs Q4 FY25 & Q1 FY25)
Total Income: ₹40,118 Cr (↓ -9% QoQ from ₹44,267 Cr; ↑ +16% YoY from ₹34,610 Cr)
Total Expenses: ₹31,296 Cr (↓ -12% QoQ from ₹35,517 Cr; ↑ +12% YoY from ₹27,927 Cr)
Operating Profit: ₹8,822 Cr (↑ +1% QoQ from ₹8,750 Cr; ↑ +32% YoY from ₹6,682 Cr)
Profit Before Tax: ₹3,834 Cr (↓ -4% QoQ from ₹3,996 Cr; ↑ +42% YoY from ₹2,691 Cr)
Profit After Tax: ₹2,767 Cr (↓ -7% QoQ from ₹2,973 Cr; ↑ +34% YoY from ₹2,066 Cr)
Diluted EPS: ₹20.85 (↓ -5% QoQ from ₹21.98; ↑ +28% YoY from ₹16.33)
🧠 Fundamental Highlights
Grasim Industries delivered robust Q1 FY26 performance with consolidated revenue rising 16% YoY to ₹40,118 crore, EBITDA growing 36%, and PAT climbing 32%. The company crossed the significant ₹1.5 lakh crore TTM milestone with standalone revenue surging 34% YoY to all-time high of ₹9,223 crore.
Market cap stands at ₹1,91,225 crore (up 2.37% in 1 year) with promoter holding at 43.1%. Stock reached all-time high of ₹2,896.55 before current consolidation, demonstrating strong momentum.
Key growth drivers include diversified business portfolio spanning Cellulosic Fibre, Chemicals, Cement, and new ventures. Birla Opus paints brand targets ₹10,000 crore gross revenue within 3 years, positioning to become the second-biggest player in the ₹80,000 crore decorative paints market.
Cellulosic Staple Fibre revenue grew 7% YoY with domestic volumes higher by 2% YoY, while Chemicals EBITDA surged 36% YoY. The strong performance across segments validates the diversification strategy.
Strong subsidiary performance from UltraTech Cement and Aditya Birla Capital continues to drive consolidated growth, with management expressing confidence in sustained momentum across all business verticals.
✅ Conclusion
Grasim's remarkable 25-year journey from sub-₹20 levels to ₹2,896 all-time high, backed by strong Q1 FY26 fundamentals showing 32% PAT growth and ₹1.5 lakh crore TTM milestone, validates the long-term growth thesis. The ₹10,000 crore Birla Opus paints target and diversified portfolio provide multiple growth engines. Breakout above ₹2,900 resistance could trigger the next rally toward ₹3,200 levels. Key support zones at ₹2,600-₹2,700 and ₹2,200-₹2,300 provide risk management levels.
