OPTIEMUS Price ActionOptiemus Infracom Limited (OPTIEMUS) is currently trading around ₹608 as of August 2025. The stock has shown a strong recent performance, gaining approximately 4% in the latest trading sessions, with daily price ranges between ₹585 and ₹625.
Over the past year, the stock price has fluctuated substantially, with a 52-week low near ₹378 and a high nearing ₹874. The current price sits closer to the mid-to-upper end of this range, indicating a recovery from lows but still beneath recent highs.
Financially, Optiemus Infracom has an earnings per share (EPS) of about ₹7.58. The price-to-earnings (PE) ratio stands elevated, above 80, which highlights strong market expectations for future growth or reflects a premium valuation often seen in technology or telecom-related firms.
The price trades above its 50-day average (~₹609) and 200-day average (~₹595), indicating a positive medium-term trend. Volume levels are moderate, consistent with stable investor interest.
While the stock has seen volatility, the trajectory suggests a gradual uptrend supported by its core business segments in electronics and telecommunications infrastructure. Key support is seen around ₹580, while resistance near ₹630 could test the strength of the ongoing rally.
In summary, Optiemus Infracom is positioned in an upward trading range with strong growth expectations, but valuation is relatively high, which should be monitored alongside company earnings and sector dynamics for future moves.
Fundamental Analysis

Part 3 Trading Master Class Option Trading in India (2025 Context)
India has seen an explosive rise in options trading. NSE reports show daily options turnover crossing ₹300 trillion in notional value.
Popular contracts:
Nifty 50 Weekly Options
Bank Nifty Weekly Options
FinNifty, Sensex, and Stock Options
Retail traders prefer weekly expiries because they are cheaper and offer fast opportunities. Institutions use monthly contracts for hedging and spreads.
10. Option Trading Psychology
Success in options is not just about strategies; it’s about mindset.
Discipline: Stick to stop-loss and position sizing.
Avoid Greed: Do not sell naked options without risk management.
Patience: Not every day is a trading day.
Continuous Learning: Market conditions and volatility regimes keep changing.

Part 2 Trading Master Class Advantages of Option Trading
Leverage – Small capital controls large positions.
Flexibility – Strategies for any market condition.
Defined Risk (for buyers) – Maximum loss = premium.
Hedging Tool – Protects portfolios from crashes.
Income Generation – Through selling options (covered calls, spreads).
Risks in Option Trading
Time Decay – Value erodes quickly near expiry.
Unlimited Loss for Sellers – Naked option selling is very risky.
Volatility Crush – After events like results, volatility falls and option premiums collapse.
Liquidity Risk – Some contracts are illiquid, making exit difficult.
Psychological Stress – Options move very fast; requires discipline.

Divergence SecretsKey Terminologies in Option Trading
Before diving deep, let’s understand some essential terms:
Call Option: A contract that gives the buyer the right (but not the obligation) to buy an asset at the strike price before expiry.
Example: Buying a Reliance ₹2500 Call Option means you can buy Reliance shares at ₹2500 even if the market price rises to ₹2700.
Put Option: A contract that gives the buyer the right (but not the obligation) to sell an asset at the strike price before expiry.
Example: Buying a Nifty 19000 Put Option means you can sell Nifty at 19000 even if the market falls to 18500.
Premium: The price paid to buy the option contract.
Example: If a Nifty 20000 Call is trading at ₹150, that ₹150 is the premium.
Strike Price: The pre-decided price at which the option can be exercised.
Expiry Date: The last date on which the option contract is valid.
In-the-Money (ITM): Option that already has intrinsic value.
Example: Nifty at 20000 → 19500 Call is ITM.
Out-of-the-Money (OTM): Option that has no intrinsic value (only time value).
Example: Nifty at 20000 → 21000 Call is OTM.
At-the-Money (ATM): Option strike price is closest to current market price.
Lot Size: Options are traded in predefined lot sizes, not single shares.
Example: Bank Nifty option lot size = 15 units (as per 2025 rules).
Option Chain: A tabular representation showing available strikes, premiums, open interest, etc. for calls and puts.

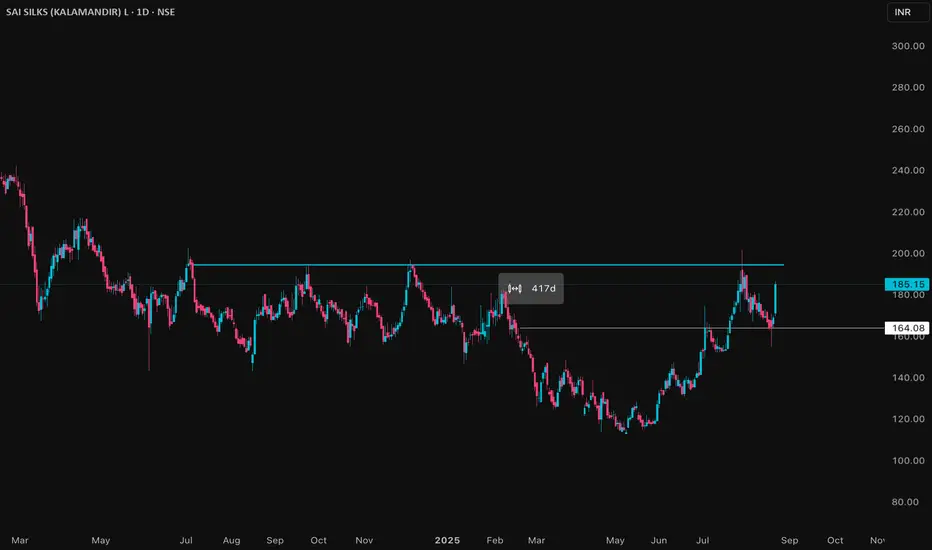
KALAMANDIR Price ActionKalamandir Industries (Sai Silks) is currently trading around ₹165–₹185 as of August 2025. The stock has seen a significant recovery in recent months after reaching lows near ₹113 in the past year. It is trading close to its 52-week high of about ₹201, indicating strong bullish momentum.
The company operates in the textile and garment retail sector, with a focus on silk and ethnic wear. Revenue growth has been moderate, with recent quarterly financials showing steady improvement in sales and profit margins, driven by an uptick in both retail and wholesale demand.
Valuation wise, the stock has a price-to-earnings (PE) ratio around 22–23, reflecting moderate market expectations for growth. The price-to-book (PB) ratio stands near 2.2, indicating a fair premium over book value.
Volume patterns show increased trading activity near current price levels, confirming investor interest. The stock is currently in a consolidation phase after a strong rally, with support around ₹150 and resistance near the recent highs at ₹200.
In summary, Kalamandir Industries is positioned for potential upside with improving fundamentals and positive technical momentum. Investors should monitor key support and resistance levels for entry or profit-taking decisions.
EURUSD TRADE SETUPEUR/USD – Short Setup (15m) 📉
Price retested supply around 1.1646 and is showing rejection.
Entry: 1.1642
SL: 1.1648
TP: 1.1622
Intraday bias remains bearish as long as price stays below 1.1650.
— YCGH CAPITAL

GOKULAGRO Price ActionGokul Agro Resources Ltd is currently trading around ₹333. The stock has recently gained close to 6% in a single session, reflecting strong bullish sentiment. The year-to-date performance is solid, with the price up substantially from its 52-week low of ₹193, and not far below the 52-week high of ₹377.
The company’s latest quarterly results showed significant sales growth, with March 2025 net sales up nearly 23% year-over-year and profit after tax also improving. The earnings per share (EPS) is about ₹17.9, and its price-to-earnings (PE) ratio stands near 18, which is reasonable for the sector. Book value per share is approximately ₹61.9, making the price-to-book ratio above 5, on the higher side for an agro-commodity company.
Gokul Agro’s upward momentum is backed by positive business results and optimism about the edible oils and agri-processing sector in India. The stock trades well above its 50-day and 200-day moving averages, confirming the uptrend. High trading volumes and active participation indicate continued interest from both institutional and retail investors.
Overall, Gokul Agro Resources is showing robust growth, supported by improved profitability and strong sector dynamics. The key levels to watch are support near ₹310 and resistance around ₹350–₹377. The outlook remains positive as momentum and earnings trends are both favorable.

INFY Bullish Setup** IF you like my observation, please boost and follow for more content."
Ticker: INFY
Time Frame: 1-Hour
Trade Type: Bullish
Entry Point: 1486.20
Target Price (TP): 1589.15
Stop Loss (SL): 1417.45
Risk-to-Reward Ratio (RRR): 1:1.5
Trade Setup and Rationale:
Market Context:
INFY has been showing signs of recovery, breaking out of a corrective phase. The price is currently positioned for a potential uptrend, supported by a significant bullish pattern forming on the chart.
Entry Point (1486.20):
The price has recently tested a support zone and is now showing signs of a strong reversal. The entry point is set just above this level, ensuring a confirmation of the bullish trend before committing to the trade.
Target Price (1589.15):
The target is set at a key resistance level where price is expected to face potential selling pressure. This level aligns with previous highs and is a reasonable place to lock in profits while riding the trend.
Stop Loss (1417.45):
The stop loss is placed just below the recent swing low, ensuring that the trade has a controlled risk. This placement minimizes the risk of getting stopped out in case of minor fluctuations while keeping the risk-to-reward ratio favorable.
Trade Logic:
The trade is supported by a bullish breakout pattern with increasing volume. After a period of consolidation, price action is showing signs of upward momentum, making this a high-probability trade setup.
The risk-to-reward ratio of 1:1.5 offers a balanced risk for the potential reward, providing a good trading opportunity with a well-placed stop loss.
Volume Confirmation:
Volume is showing a steady increase as the price starts moving upward, indicating that market participants are supporting the bullish move.
Trend Confirmation:
The trend is confirmed by the price breaking above previous resistance, and the bullish setup aligns with the market structure.

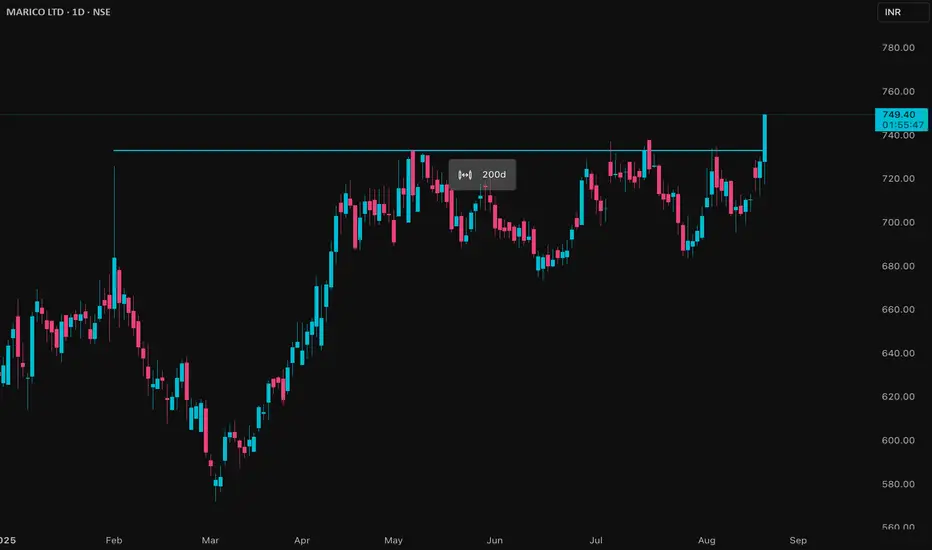
MARICO Price ActionMarico, as of August 2025, continues to showcase strong performance and consistent growth across its key financial metrics:
- **Revenue Growth:** Marico recorded ₹10,831 crore in annual revenue for FY25, an increase from ₹9,653 crore the previous year. June 2025 quarterly revenue was ₹3,259 crore, reflecting a sharp uptick from previous quarters.
- **Profitability:** Net profit for FY25 stands at ₹1,658 crore. The June 2025 quarter alone delivered a net profit of ₹513 crore, its highest in the recent five quarters. Earnings per share (EPS) have steadily risen to ₹12.59.
- **Margins and Return Ratios:** The company maintains healthy profit margins, with FY25 gross profit margin at 21.66%, operating margin at 20.02%, and net profit margin at 15.3%. Return ratios are robust, as seen in a return on net worth/equity of 40.99% and return on assets at 19.53%.
- **Balance Sheet Health:** Marico’s financial structure remains strong, with a debt-to-equity ratio of 0.10, indicating low leverage. The company also boasts a high interest coverage and strong cash flows from operating activities.
- **Segment Performance:** The food business continues to outperform with rapid growth, and premium personal care lines also show resilience. Domestic volume growth improved sequentially, driven by recovery in key brands and ongoing initiatives in pricing and innovation. International business delivered double-digit constant currency growth.
- **Shareholder Value:** The share price hit an all-time high of around ₹748, with a healthy dividend payout increasing to ₹10.5 per share in FY25.
- **Operational Efficiency:** Marico exhibits efficient working capital management, visible in its consistently high inventory and asset turnover ratios.
- **Outlook:** The company is optimistic about margin expansion in the coming quarters due to expected moderation in input costs. Its core categories are expected to sustain or accelerate volume growth, aided by premiumisation, innovation, and expansion in foods and personal care.
In summary, Marico is financially strong, profitable, and remains well-positioned for further growth, benefiting from a broad portfolio, strong brands, prudent financial management, and resilient demand both in India and internationally.
GODFRYPHLP Price Action## Trend Overview
Godfrey Phillips India (GODFRYPHLP) is showing a volatile but overall bullish structure on the daily chart. The stock recently hit an all-time high near ₹9,645 and is currently trading around ₹8,687. After a strong rally over the past year, the price has entered a consolidation phase, with short-term corrections and profit booking visible.
## Price Action & Momentum
- The stock has gained over 100% in the last year, reflecting strong long-term momentum.
- In the short term, the price has pulled back from its peak and is trading below key resistance levels, indicating some selling pressure.
- Despite the pullback, the broader uptrend remains intact as the price is still above major moving averages.
## Technical Indicators
- **Moving Averages:** The daily price is above its 50-day and 200-day simple moving averages, supporting a positive long-term bias. Shorter-term averages (20-day and 50-day) are converging, suggesting consolidation.
- **Relative Strength Index (RSI):** The RSI is in the neutral zone, indicating neither overbought nor oversold conditions. This points to a potential pause or sideways movement before the next trend.
- **MACD:** The MACD indicator has shown a weak sell signal, but the overall momentum loss is mild, not confirming a strong reversal.
- **Bollinger Bands:** The price is in the lower half of the bands, suggesting a cooling-off period after a sharp rally. Volatility remains high.
## Support and Resistance
- **Immediate Support:** Around ₹8,500, where the stock has found buying interest in recent sessions.
- **Major Support:** Near ₹8,000, which coincides with the 50-day moving average and a previous breakout zone.
- **Immediate Resistance:** Near ₹8,900 to ₹9,000, which aligns with recent swing highs.
- **Major Resistance:** The all-time high at ₹9,645.
## Volume and Sentiment
- Recent sessions have seen higher volumes on down days, indicating profit booking.
- Long-term sentiment remains positive, but short-term traders are cautious due to the recent correction and volatility.
## Summary
GODFRYPHLP remains in a strong uptrend on the daily timeframe, but the current phase is marked by consolidation and profit-taking after hitting record highs. The price is holding above key supports, and as long as it stays above the 50-day moving average, the broader bullish structure is intact. Short-term movements may remain range-bound with a slight downward bias until a clear breakout above resistance or breakdown below support occurs. Risk management is advised due to elevated volatility.

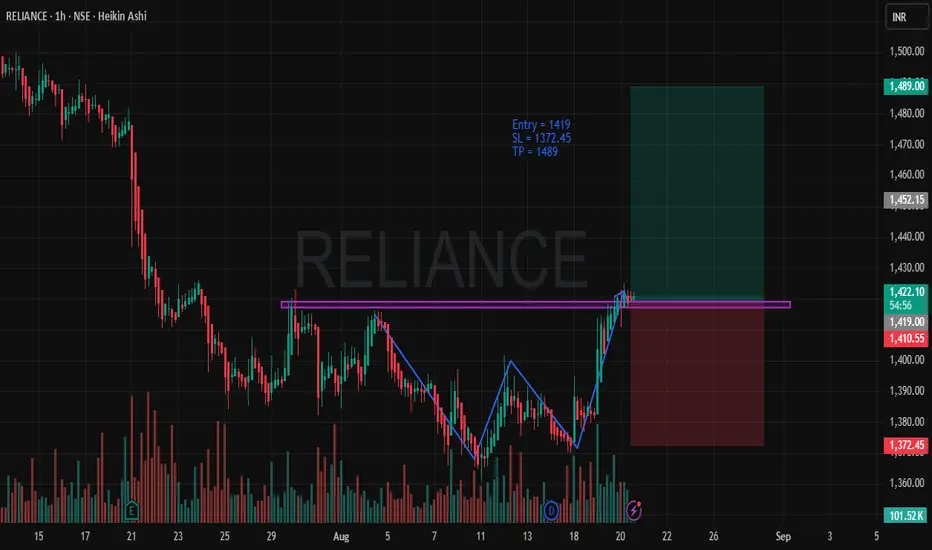
RELIANCE - Bullish SetupTimeframe: 1-Hour
Trade Type: Long Position
Entry Price: 1419
Stop Loss (SL): 1372.45
Take Profit (TP): 1489
Risk-to-Reward (RRR): 1:3.53
Trade Rationale
Bullish Trend Setup: The price action is showing a clear bullish momentum as RELIANCE has recently broken through a significant resistance level (indicated by the purple line). This breakout is a strong signal of potential upward movement.
Chart Pattern: The price forms a classic double bottom pattern (highlighted on the chart), which signifies a reversal from a downtrend to an uptrend. The pattern is confirmed with strong volume, showing the increased participation of buyers.
Entry Point: We are entering this position at 1419, right after the price breaks the resistance and starts moving upwards. This breakout marks the start of the potential rally.
Stop Loss: The SL is placed at 1372.45, just below the recent swing low, ensuring a safe exit if the market decides to reverse.
Take Profit: The TP is placed at 1489, a logical price target that accounts for a solid risk-to-reward ratio of 1:3.53. This is a reasonable expectation based on recent price action and volatility.
Volume Confirmation: Strong volume is observed, confirming the strength of the move. Typically, breakouts accompanied by high volume are more likely to continue in the breakout direction, supporting the bullish scenario.
Market Conditions: The broader market conditions appear favorable for long positions, with sentiment and technical indicators showing bullish signs across the broader market.
Risk Management
A tight Stop Loss ensures that we minimize risk in case of market retracement, while the Take Profit target allows us to ride the trend and maximize the potential return on this trade.
The Risk-to-Reward Ratio is set at 1:3.53, which aligns with sound risk management principles, allowing for substantial profits even with a lower win rate.
Risk Management in TradingIntroduction
Trading is often seen as the art of predicting market moves, buying low, and selling high. Yet, the most successful traders will tell you that trading is not about prediction, it’s about protection. The markets are uncertain, and no strategy, indicator, or system can guarantee 100% accuracy. What separates consistently profitable traders from losing ones is not just their ability to analyze charts but their skill in managing risk.
Risk management is the backbone of long-term survival in trading. Without it, even the best strategies eventually fail. With it, even an average strategy can deliver consistent returns over time. In this guide, we’ll dive deep into what risk management is, why it matters, and the tools and techniques every trader must master.
Chapter 1: What is Risk in Trading?
Risk in trading refers to the possibility of losing money due to adverse market movements. Every trade carries uncertainty, and risk management is about controlling the size and impact of that uncertainty.
There are different types of risk in trading:
Market Risk (Price Risk):
The chance of prices moving against your trade. For example, buying a stock at ₹100 and it falls to ₹90.
Leverage Risk:
Using borrowed money or margin amplifies both gains and losses. A small price move can wipe out capital if leverage is excessive.
Liquidity Risk:
The inability to exit a position at the desired price due to low trading volume. This happens often in small-cap stocks or thinly traded futures.
Volatility Risk:
Sudden price swings can trigger stop losses or create unexpected losses, especially around news events.
Psychological Risk:
Emotional decisions – fear, greed, revenge trading – often increase losses.
Systemic Risk:
External shocks like economic crises, geopolitical tensions, or pandemics can affect all markets simultaneously.
In simple terms: Risk = Probability of Loss × Magnitude of Loss.
Chapter 2: Why Risk Management is the Core of Trading
Most beginners focus on finding the “perfect strategy.” They try indicators, signals, or tips. But even the most accurate strategies have losing trades.
Consider two traders:
Trader A: Has a 70% winning strategy but risks 20% of capital per trade.
Trader B: Has a 50% winning strategy but risks only 1% of capital per trade.
Who survives longer? Trader B. Why? Because Trader A only needs a short losing streak to blow up his account, while Trader B can survive hundreds of trades.
Risk management ensures three things:
Survival: You live to trade another day.
Consistency: Your equity curve grows steadily without wild drawdowns.
Confidence: Knowing losses are controlled reduces stress and emotions.
In short: Trading without risk management is gambling.
Chapter 3: The Mathematics of Risk
3.1 The Risk of Ruin
Risk of ruin means the probability of losing all your trading capital. If you risk too much per trade, your account may not survive inevitable losing streaks.
Example:
If you risk 20% per trade, a losing streak of just 5 trades wipes out 67% of your account. To recover, you would need a 200% gain!
But if you risk 1% per trade, even 20 consecutive losses only reduce your account by ~18%. That’s survivable.
3.2 Risk-Reward Ratio
The Risk-Reward Ratio (RRR) measures potential reward compared to risk.
If you risk ₹100 to make ₹200, your RRR is 1:2.
A higher RRR allows profitability even with a low win rate.
For example:
At 1:2 RRR, you need only 34% win rate to break even.
At 1:3 RRR, just 25% win rate keeps you profitable.
3.3 Position Sizing Formula
A popular formula is:
Position Size = (Account Size × Risk per Trade) ÷ Stop Loss (in points/value)
Example:
Account Size = ₹1,00,000
Risk per Trade = 1% = ₹1,000
Stop Loss = ₹10 per share
Position Size = 1000 ÷ 10 = 100 shares
This ensures you never lose more than ₹1,000 in that trade.
Chapter 4: Tools of Risk Management
4.1 Stop Loss
A stop-loss order closes your trade automatically at a pre-defined price to limit losses. Types:
Hard Stop: Fixed exit point.
Trailing Stop: Moves with price to lock profits.
4.2 Take Profit
Opposite of stop-loss – locks in gains at a target level.
4.3 Diversification
Never put all capital into one trade or one asset. Spread risk across instruments, sectors, or strategies.
4.4 Hedging
Using options, futures, or correlated assets to reduce risk. Example: Buying Nifty futures and buying a protective put option.
4.5 Risk per Trade Rule
Most professional traders risk 0.5% to 2% of capital per trade. This balance allows growth while protecting against drawdowns.
4.6 Daily Loss Limit
Set a maximum daily loss (e.g., 3% of account). If hit, stop trading for the day. This prevents emotional revenge trades.
Chapter 5: Psychological Aspects of Risk
Risk management is not just technical; it’s psychological. Many traders fail because of:
Overconfidence: After wins, increasing position size too aggressively.
Fear: Cutting winners too early or avoiding valid trades.
Greed: Holding losers, hoping they’ll turn profitable.
Revenge Trading: Trying to recover losses quickly, leading to bigger losses.
Good risk management enforces discipline. You follow rules, not emotions.
Chapter 6: Advanced Risk Management Strategies
6.1 Kelly Criterion
A mathematical formula to optimize bet size based on edge and win probability.
Formula: f = (bp – q) / b*
Where:
f = fraction of capital to risk
b = odds (reward/risk)
p = probability of win
q = probability of loss
Although powerful, many traders use a fraction of Kelly (half-Kelly) to reduce volatility.
6.2 Value at Risk (VaR)
Common in institutional trading. It estimates the maximum expected loss over a given period at a certain confidence level (e.g., 95%).
6.3 Volatility-Based Position Sizing
Adjust position size according to market volatility. If volatility is high, trade smaller; if low, trade larger.
6.4 Portfolio Risk Management
Beyond individual trades, manage total portfolio risk. For example:
Limit exposure to correlated trades (e.g., don’t go long on multiple IT stocks at once).
Set maximum portfolio drawdown (e.g., 10%).
Chapter 7: Real-Life Examples
Example 1: The Trader Without Risk Management
Rahul has ₹1,00,000. He risks ₹20,000 per trade. After just 5 consecutive losses, his account drops to ₹33,000. To recover, he now needs +200% returns. Emotionally shattered, Rahul quits trading.
Example 2: The Disciplined Trader
Priya also starts with ₹1,00,000. She risks 1% per trade = ₹1,000. After 5 losses, she still has ₹95,000. She survives, learns, improves her strategy, and grows steadily.
Moral: Survival > Prediction.
Chapter 8: Building a Personal Risk Management Plan
Every trader must design a plan tailored to their style. Key components:
Capital Allocation: How much capital to trade vs. keep in reserve.
Risk per Trade: Set a percentage (1–2%).
Stop Loss Rules: Fixed or ATR (Average True Range) based.
Position Sizing Method: Use formula or volatility-based sizing.
Diversification Rules: Limit exposure per sector/asset.
Daily & Weekly Loss Limits: Stop trading after exceeding them.
Review & Adaptation: Analyze performance monthly and adjust.
Chapter 9: Common Mistakes Traders Make
Trading without stop losses.
Risking too much on one trade.
Averaging down losing trades.
Ignoring correlation between trades.
Trading during high-impact news without preparation.
Not tracking risk metrics (drawdown, expectancy, RRR).
Chapter 10: Risk Management for Different Trading Styles
Day Traders: Must be strict with intraday stop losses and daily limits.
Swing Traders: Should focus on overnight gap risk and diversify across positions.
Long-Term Investors: Must manage concentration risk and rebalance portfolios.
Options Traders: Need to monitor Greeks (Delta, Gamma, Vega) for exposure.
Conclusion
Risk management is the invisible hand that shapes trading success. While strategies may change, markets may evolve, and tools may improve, the principle remains timeless: Control risk, and profits will take care of themselves.
Every trader faces uncertainty, but those who respect risk survive and thrive. Without risk management, trading becomes a casino. With it, trading becomes a business.
Fundamental Analysis vs Technical Analysis: Which Strategy Wins?Introduction
In the world of stock market investing and trading, two schools of thought dominate: Fundamental Analysis (FA) and Technical Analysis (TA). Both approaches aim to answer the same question — “Should I buy, hold, or sell this stock?” — but they take entirely different paths to reach their conclusion.
Fundamental analysis focuses on the business behind the stock: revenues, profits, assets, management quality, industry position, and future growth potential.
Technical analysis focuses on the stock’s price and volume behavior, studying patterns and trends to predict short-term and long-term movements.
This debate has existed for decades, with investors like Warren Buffett standing firmly on the side of fundamentals, and traders like Paul Tudor Jones thriving on technicals. But in reality, the answer to “which strategy wins” is more nuanced.
In this guide, we’ll break down both approaches in detail, compare their strengths and weaknesses, and analyze which one works better in different market contexts.
Part 1: Understanding Fundamental Analysis
What is Fundamental Analysis?
Fundamental Analysis (FA) is the study of a company’s intrinsic value. The idea is simple: every stock has a “true worth,” and if its current market price is lower than this intrinsic value, it’s undervalued (a buying opportunity). Conversely, if the market price is higher, it’s overvalued (a selling or shorting opportunity).
Key Components of FA
Financial Statements
Income Statement (profit & loss) → Are revenues and profits growing?
Balance Sheet → Does the company have too much debt?
Cash Flow Statement → Is the company generating real cash or just accounting profits?
Ratios & Metrics
P/E Ratio (Price-to-Earnings) – How much are investors willing to pay for each unit of earnings?
P/B Ratio (Price-to-Book) – Is the stock valued fairly compared to assets?
ROE (Return on Equity) – How efficiently is management using investor capital?
Debt-to-Equity – Is the company financially stable?
Qualitative Factors
Management quality
Competitive advantage (moat)
Industry trends
Government policies and regulations
Macroeconomic Factors
Inflation, interest rates, GDP growth
Global economic conditions
Sectoral growth trends
Example of Fundamental Analysis in Action
Imagine you’re analyzing Infosys.
Revenue and profits have been steadily growing.
P/E ratio is lower than peers like TCS and Wipro.
Strong cash flows, low debt, high ROE.
The IT industry is expected to grow as global businesses continue digital transformation.
Conclusion: Infosys is fundamentally strong, and if its stock is trading at a reasonable valuation, it may be a good long-term buy.
Part 2: Understanding Technical Analysis
What is Technical Analysis?
Technical Analysis (TA) studies price and volume patterns on stock charts to predict future movements. The underlying belief is that “Price reflects everything” — all news, fundamentals, and emotions are already priced into the stock. Thus, by studying charts, traders can anticipate where the price will move next.
Key Components of TA
Price Charts
Line charts, candlestick charts, bar charts
Trends
Uptrend (higher highs, higher lows)
Downtrend (lower highs, lower lows)
Sideways (range-bound)
Support & Resistance Levels
Support = a price level where demand is strong enough to stop decline
Resistance = a level where selling pressure stops price rise
Technical Indicators
Moving Averages (MA, EMA) – Identify trend direction
RSI (Relative Strength Index) – Measures overbought/oversold conditions
MACD (Moving Average Convergence Divergence) – Identifies momentum shifts
Bollinger Bands – Measures volatility and breakout possibilities
Chart Patterns
Head & Shoulders, Double Top, Cup & Handle, Triangles, Flags, etc.
Volume Analysis
Rising price + high volume = strong bullish confirmation
Falling price + high volume = strong bearish confirmation
Example of Technical Analysis in Action
Suppose Reliance Industries is trading at ₹2,500.
The stock has formed strong support at ₹2,450 and resistance at ₹2,600.
RSI shows it’s oversold near 30, suggesting a bounce.
Volume spikes confirm buying interest.
A candlestick reversal pattern (hammer) forms near support.
Conclusion: Reliance may bounce from ₹2,450 towards ₹2,600 in the short term, making it a good trading opportunity.
Part 3: Key Differences Between FA and TA
Aspect Fundamental Analysis Technical Analysis
Focus Business, financials, valuation Price, volume, market psychology
Timeframe Long-term investing (months to years) Short to medium-term trading (minutes to weeks)
Tools Balance sheet, ratios, economy, management analysis Charts, indicators, patterns, support/resistance
Philosophy “Buy good businesses at the right price” “Price discounts everything; trends repeat”
Users Investors, value investors, mutual funds Traders, swing traders, day traders, scalpers
Strengths Identifies undervalued stocks for wealth creation Captures quick moves for profit
Weaknesses Slow, doesn’t time entries well May give false signals, ignores fundamentals
Part 4: Strengths & Weaknesses of Each Approach
Strengths of FA
Helps identify multi-bagger stocks (e.g., Infosys, HDFC Bank, Asian Paints).
Provides long-term conviction, reducing panic selling.
Focuses on wealth creation rather than just trading gains.
Weaknesses of FA
Doesn’t provide precise entry/exit timing.
Market can stay irrational for long (undervalued stocks may stay undervalued).
Requires deep knowledge of finance and economics.
Strengths of TA
Provides timing precision (when to buy/sell).
Useful for short-term profits.
Works in any market — stocks, forex, commodities, crypto.
Weaknesses of TA
Can be subjective (two traders may interpret the same chart differently).
False signals are common.
Doesn’t consider company fundamentals — risky if used blindly.
Part 5: Which Strategy Wins?
The answer isn’t either/or. The real winners are those who know when to use which approach.
For Long-Term Investors
FA is the primary tool.
Example: Warren Buffett uses fundamentals to identify businesses that will compound wealth over decades.
For Short-Term Traders
TA is more effective.
Example: Day traders and swing traders rely on charts, not balance sheets.
For Hybrid Investors (Best of Both Worlds)
The most successful investors often combine both.
Example: Buy fundamentally strong companies (FA) and use TA for better entry/exit timing.
Part 6: Real-Life Examples
Amazon (FA Winner): In 2001, Amazon was loss-making, but fundamental believers in e-commerce saw potential. Long-term holders became millionaires.
Tesla (FA + TA): Initially, Tesla looked overvalued by fundamentals, but TA showed strong momentum and trend-following traders made massive gains.
Yes Bank (FA Ignored): Many traders made profits using TA in short-term swings, but long-term FA showed cracks in fundamentals, leading to eventual collapse.
Part 7: Market Conditions – Who Wins When?
Bull Market → Both FA and TA work. FA finds strong companies, TA helps ride the trend.
Bear Market → TA is more useful for risk management. FA may trap investors in “value traps.”
Sideways Market → TA is superior as it identifies range-bound trades.
Post-Crash Recovery → FA wins by identifying undervalued gems for long-term recovery.
Conclusion
The debate of Fundamental Analysis vs Technical Analysis isn’t about which is superior, but about which fits your goals, personality, and timeframe.
If you want to build long-term wealth → Go with Fundamental Analysis.
If you want to make short-term profits → Technical Analysis is your tool.
If you want the best of both worlds → Combine FA + TA.
Ultimately, markets reward not those who argue which strategy is better, but those who apply the right strategy at the right time.
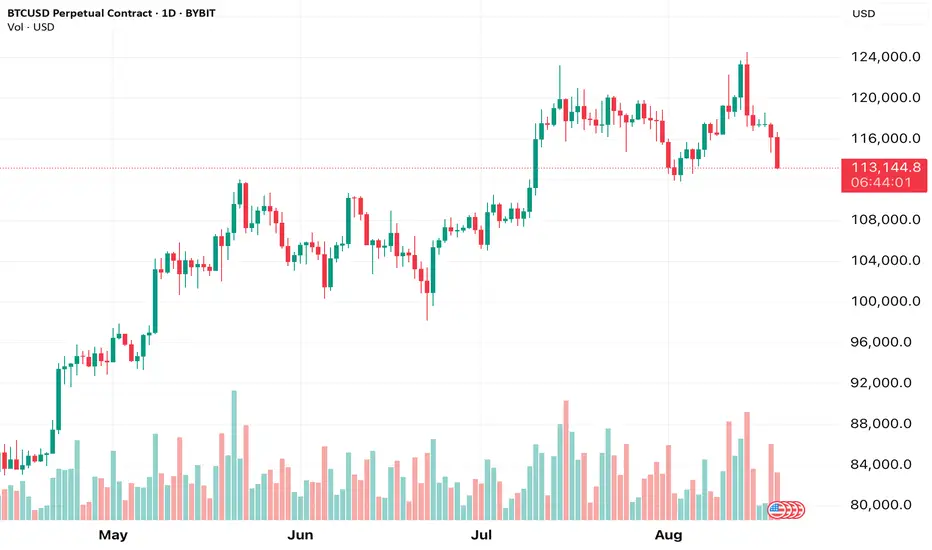
BTC chart for my own analysisFor technical analysis matching tech with AI. Lookign at various aspects to see what makes sense for short and long.
Free Cash Flow – The Most Ignored Metric That Can Save You!Hello Traders!
When most people look at a company’s financials, they stop at profits.
But smart investors know that profits on paper don’t always mean cash in hand.
That’s where Free Cash Flow (FCF) comes in, the metric that reveals the real financial strength of a business.
What is Free Cash Flow?
Free Cash Flow is the money a company has left after paying all operating expenses and making necessary investments in its business.
It’s the cash available to pay dividends, buy back shares, reduce debt, or reinvest for growth.
Why It Matters More Than Reported Profits
Cash is King:
A company might report high profits but still struggle if it doesn’t have actual cash flow.
FCF shows if the business can fund itself without borrowing.
Signals Financial Health:
Consistently positive FCF means the company generates enough money to grow and reward shareholders.
Negative FCF for many years can be a red flag unless it’s due to planned growth investments.
Protects During Tough Times:
Companies with strong FCF can survive economic slowdowns without cutting essential spending or taking on expensive debt.
How to Check It
You can find FCF in the company’s cash flow statement:
FCF = Operating Cash Flow – Capital Expenditures
Rahul’s Tip:
Don’t just chase high profits.
Always check if the company is actually generating cash, because without cash, growth and survival both become impossible.
Conclusion:
Free Cash Flow might be the most ignored metric in investing, but it’s also one of the most powerful.
It tells you if a company can stand on its own feet, grow sustainably, and protect your investment in tough markets.
If you found this useful, like the post, share your view in the comments, and follow for more practical investing tips!
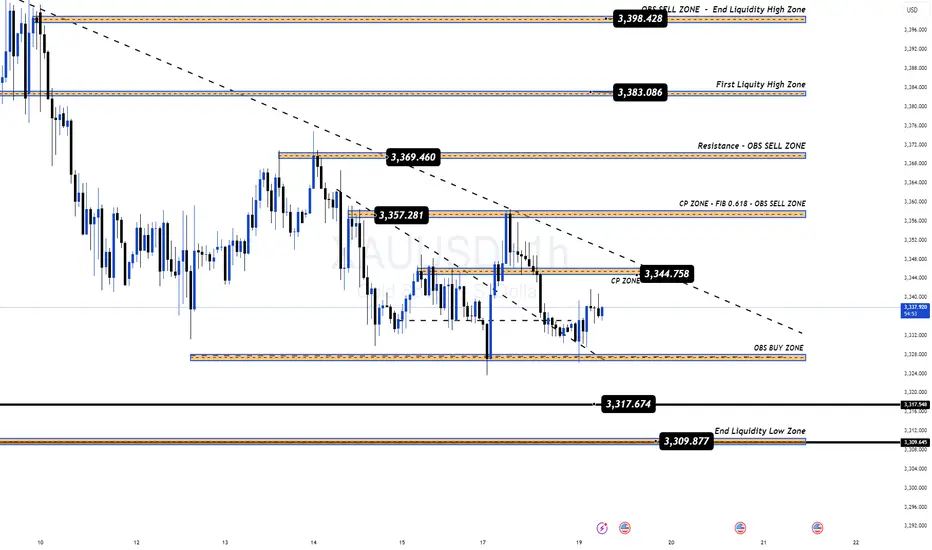
🇮🇳 Gold Under Pressure | Key Levels to Watch TodayGold continues to move in line with our weekly outlook. Despite strong rebounds from liquidity zones, the market still faces heavy selling pressure, unable to break out of the 335x – 336x resistance area.
With no major news events scheduled today, price action is expected to remain within range, making KeyLevels the most important zones to trade from.
📌 Trading Bias Today
Priority remains on SELL setups at upper resistance zones. Adjust entries slightly for better risk–reward.
For BUY positions, wait for deeper entries to avoid liquidity sweeps around 333x – 332x, which have been tested multiple times recently.
🔑 Key Market Levels
Resistance: 3346 – 3357 – 3370 – 3383
Support: 3324 – 3316 – 3309
📌 Trading Plan for India Traders
✅ BUY Zone: 3316 – 3314
SL: 3310
TP: 3320 – 3324 – 3328 – 3332 – 3336 – 3340 – 3350 – 3360+
✅ SELL Zone: 3356 – 3358
SL: 3362
TP: 3352 – 3348 – 3344 – 3340 – 3330 – 3320
⚠️ Summary
Gold remains inside a bearish channel, waiting for a clear breakout. Until major news like the FOMC hits, expect sideways price action within today’s KeyLevels.
👉 Watch reactions closely around 333x – 336x for the next potential move.
Stay disciplined, trade the levels, and let the market show its hand.
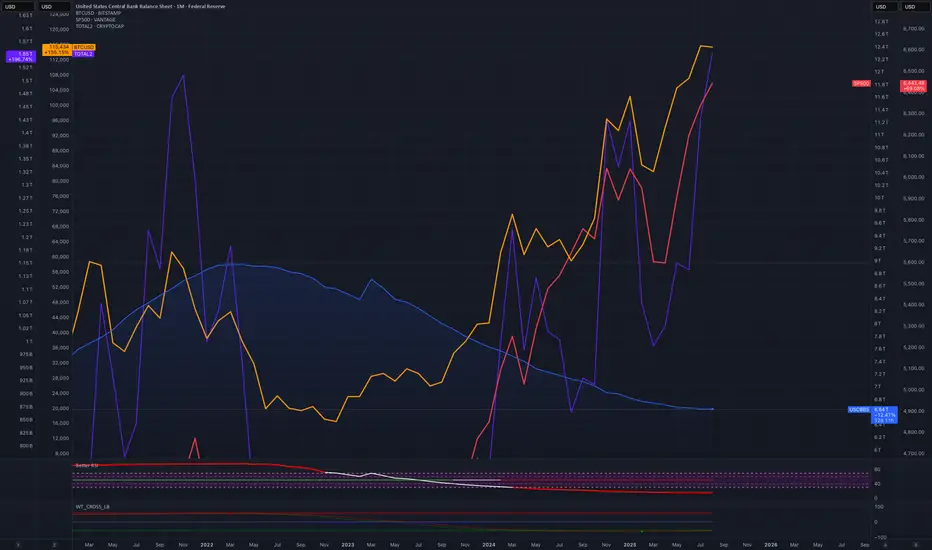
USD Liquidity vs S&P vs BTC vs Altcoin Market Cap (total2)This cart shows how USD liquidity affects some assets such as Bitcoin, stock market and altcoin market cap.
Trading Master Class With ExpertsBasic Concepts & Terminology
Before going deeper, let’s simplify the core terms in options trading:
Strike Price: The fixed price at which the buyer can buy (call) or sell (put) the asset.
Expiry Date: The date on which the option contract expires (e.g., weekly or monthly).
Option Premium: The cost paid by the buyer to the seller for getting this right.
Lot Size: Options are traded in lots, not single shares. Example: Nifty option lot = 50 units.
In-the-Money (ITM): When exercising the option is profitable.
Out-of-the-Money (OTM): When exercising the option is not profitable.
At-the-Money (ATM): When the strike price = current price of the underlying asset.
Example:
Suppose Reliance is trading at ₹2,500.
A Call option with strike 2,400 is ITM (because you can buy at 2,400, lower than 2,500).
A Put option with strike 2,600 is ITM (because you can sell at 2,600, higher than 2,500).

Part 6 Learn Institutional TradingPopular Option Strategies
Options can be combined to design strategies:
Beginner Strategies:
Covered Call: Hold stock + sell call option.
Protective Put: Hold stock + buy put to protect downside.
Intermediate:
Straddle: Buy call + buy put (same strike) → profit in big moves.
Strangle: Buy OTM call + OTM put → cheaper than straddle.
Spread: Buy one option, sell another to reduce cost (Bull Call Spread, Bear Put Spread).
Advanced:
Iron Condor: Sell OTM call + put, buy further OTM call + put → profit in sideways market.
Butterfly: Buy 1 ITM, sell 2 ATM, buy 1 OTM → limited risk, limited reward.
Calendar Spread: Sell near-term option, buy long-term option.
Options Trading in India
Options are traded mainly on NSE.
Index Options (Nifty, Bank Nifty, FinNifty, Sensex) dominate volume.
Weekly expiry (Thursday) has made option trading highly popular.
SEBI Rules: Margin requirements apply for writers, buyers only pay premium.
Retail boom: 90%+ of daily market volume comes from options now.

Part 2 Ride The Big MovesBasic Concepts & Terminology
Before going deeper, let’s simplify the core terms in options trading:
Strike Price: The fixed price at which the buyer can buy (call) or sell (put) the asset.
Expiry Date: The date on which the option contract expires (e.g., weekly or monthly).
Option Premium: The cost paid by the buyer to the seller for getting this right.
Lot Size: Options are traded in lots, not single shares. Example: Nifty option lot = 50 units.
In-the-Money (ITM): When exercising the option is profitable.
Out-of-the-Money (OTM): When exercising the option is not profitable.
At-the-Money (ATM): When the strike price = current price of the underlying asset.
Example:
Suppose Reliance is trading at ₹2,500.
A Call option with strike 2,400 is ITM (because you can buy at 2,400, lower than 2,500).
A Put option with strike 2,600 is ITM (because you can sell at 2,600, higher than 2,500).

GU DAY TRADINGPrice retested supply after a strong bearish impulse.
Entry: 1.3515
SL: Above 1.3523
TP: 1.3496
Market bias remains bearish unless price pushes higher with strength. Keeping risk tight.

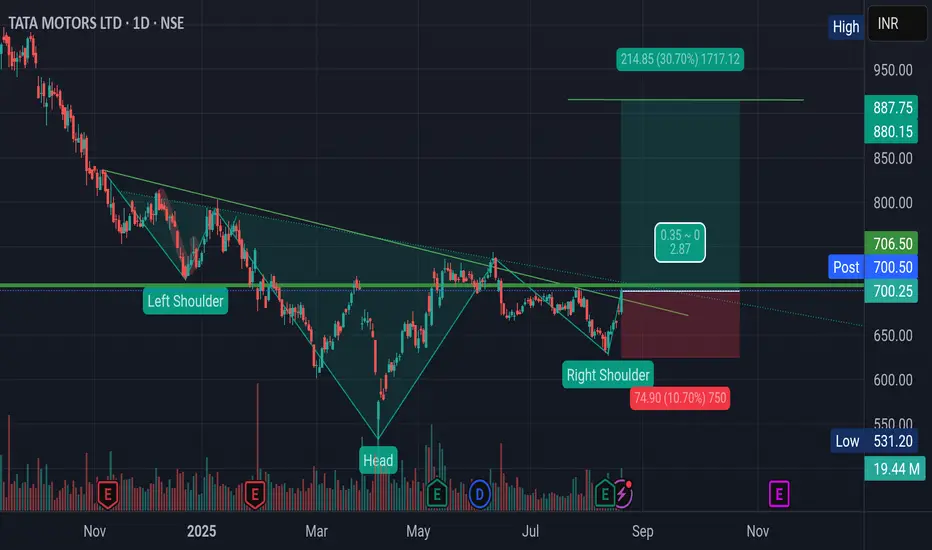
Inverted H&S Breakout in Tata MotorsMotor and electric Vehicle giant Tata Motors has given Breakout from Inverted Head and Shoulder pattern with good volume.
Once the price sustains and closes above Rs. 707. The stock should rally to its target of Rs. 880
One Should remain positive till price breaches and sustains below right Shoulder of the pattern.
The possibility of positive movement is fueled by the recent GST rate Cut possibility announced by PM modi. 👌
Also, there is positive news about fulfillment of Rare Earth Metals (very essential in EV vehicles) from China.😱
Note: This analysis is for Educational Purpose Only. Please invest after consulting a professional financial advisor.
Sectoral Story: Week Ending August 18, 2025 (Healthcare)As of August 18, 2025, Indian equities closed the truncated week on a positive note: Nifty gained 1.10% and Sensex rose 0.93%, even as FPIs were net sellers to the tune of $348 million.
Sectoral Performance (Weekly)
Top gainers: Healthcare (+3.60%), Automobiles (+2.74%), Defence (+2.59%), Digital (+2.36%), Mobility (+2.25%).
Broad strength: 17 of 20 sectors advanced; 7 sectors rose more than 2%.
Laggards: Consumer Durables (-0.59%) and FMCG (-0.45%) underperformed; Chemicals edged lower (-0.22%).
Breadth metrics: Average return across 20 sectors was 1.20%. The top 5 delivered 2.71%; the top 10 posted 2.15%. Bottom 10 managed 0.24%, underscoring risk-on sentiment.
Selected indices (close on Aug 15 vs Aug 8):
Nifty Healthcare: 14,644.90 vs 14,135.55 (+3.60%)
Nifty Automobiles: 24,118.80 vs 23,474.65 (+2.74%)
Nifty India Defence: 7,804.80 vs 7,607.90 (+2.59%)
Nifty India Digital: 8,845.50 vs 8,641.35 (+2.36%)
Nifty Mobility: 21,046.80 vs 20,582.70 (+2.25%)
PSU Banks: 7,025.25 vs 6,881.25 (+2.09%)
IT: 34,833.20 vs 34,398.50 (+1.26%)
Banks: 55,341.85 vs 55,004.90 (+0.61%)
FMCG: 54,656.30 vs 54,900.95 (-0.45%)
Consumer Durables: 37,329.60 vs 37,549.60 (-0.59%)
The Week That Was: The Good, The Bad, and The Ugly
The good: An unexpected sovereign rating upgrade for India from BBB- to BBB with a stable outlook buoyed sentiment, with potential to ease yields and reduce funding costs. Inflation cooled markedly—CPI to 1.55% and WPI to -0.58%—bolstering the case for another policy rate cut. Primary markets stayed active, with healthy IPO appetite prompting more large filings.
The bad: Tariff overhang persisted for textiles, select chemicals, gems & jewellery, and leather, with clarity on the full impact still pending.
The ugly: July’s merchandise trade deficit widened to an 8‑month high of $27.35 billion, risking pressure on the H1 FY26 current account deficit.
Momentum broadened across sectors with domestic themes—healthcare, autos, defence, digital, and mobility—leading. Despite FPI outflows and trade pressures, easing inflation and the sovereign upgrade set a constructive backdrop, with potential policy support and earnings resilience likely to guide near‑term leadership.
Disclaimer: lnkd.in
