Powergrid: Will it power its way to 231 / 238Powergrid
The stock seems to have sustained above its crucial resistance level at 218
Now it has a clear path towards 231 / 238
Take care & safe trading...!!!
Disclaimer
- The view expressed here is my personal view
- Past performance is not a guarantee for future predictions
- Use this for educational purpose
- Any decision you take, you need to take responsibility for the same
- It's your hard earned money. Treat it wisely
- Trade / Invest keeping in mind your trading style, goals and objectives, time horizon & risk tolerance
- if trading in F&O, understand that F&O trading involves risk
- Do take proper risk management measures
- Do your own analysis and consult your financial adviser if need be
Futures

IOC: Chart set up suggests Buy on DipsIOC
The stock is in strong territory and has support at 73.5 / 68
Target for the current set up 79 / 84 / 90
Take care & safe trading...!!!
Disclaimer
- The view expressed here is my personal view
- Past performance is not a guarantee for future predictions
- I have been wrong in the past and can be wrong again in future too
- Use this for educational purpose
- Any decision you take, you need to take responsibility for the same
- It's your hard earned money. Treat it wisely
- Trade / Invest keeping in mind your trading style, goals and objectives, time horizon & risk tolerance
- if trading in F&O, understand that F&O trading involves risk
- Do take proper risk management measures
- Do your own analysis and consult your financial adviser if need be

Nifty: Chart set up and trading strategyNifty is currently having support at 18400 odd levels
Nifty all time high is at 18604
Given the set up one may consider to a Short strangle strategy in weekly options
Dec 01 Expiry
Sell 18300 Put optoin
Sell 18650 Call option
Net receivables 68-70 points
Loss in trade if closing on Dec 01 is below 18232 or above 18718
Review points 18350 on the lower side and 18605 on the upside
It should give ample scope to adjust / exit.
Take care & safe trading...!!!
Disclaimer
- The view expressed here is my personal view
- Past performance is not a guarantee for future predictions
- Use this for educational purpose
- Any decision you take, you need to take responsibility for the same
- It's your hard earned money. Treat it wisely
- Trade / Invest keeping in mind your trading style, goals and objectives, time horizon & risk tolerance
- if trading in F&O, understand that F&O trading involves risk
- Do take proper risk management measures
- Do your own analysis and consult your financial adviser if need be

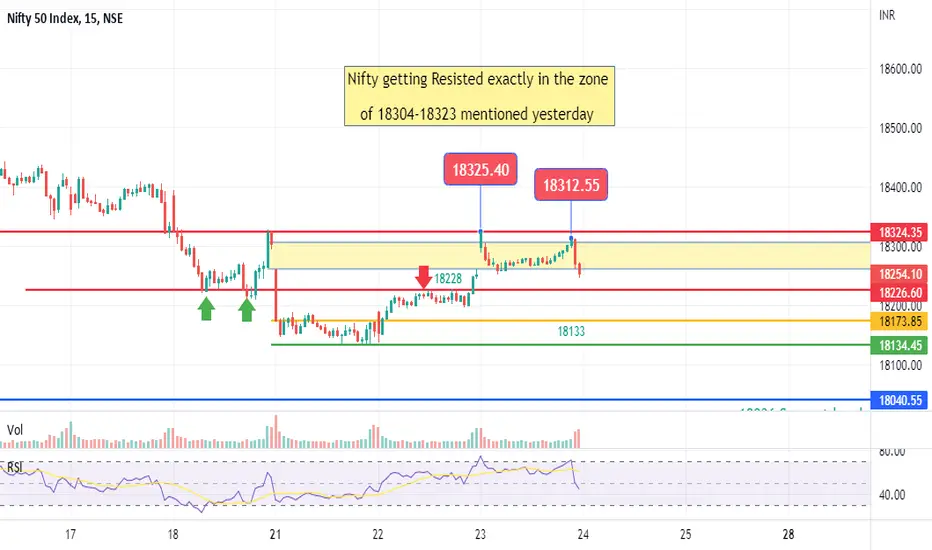
Nifty: Moving on expected linesNifty
Yesterday I had given important levels for Nifty
18228 - It respected the level for the whole day and gave a breakout in last 1/2 hour of trade
Above 18228 the next level given was 18304-18323 zone
Today Nifty opened at 18325 and immediately retraced and traded the whole day in the yellow zone ( again the yellow zone has been marked in yesterday's analysis.
Trust the analysis has been helpful in not being a blind bull in Nifty.
Still sticking to the view of expected expiry range between 18036-18323 with Nifty level of 18180 being very crucial.
Take care & safe trading...!!!
XAUUSD REVERSAL ZONE STAY TUNETRADING SUGGESTION:
Now we looking to the gold market coming into reversal area,so wait for market get perfect SELL trade.
.
.
.
.
TAKE A TRADE,SIT BACK AND RELAX

Nifty: 18350-18400 crucial zone to watch out forNifty
The level of 18350-18400 has acted as crucial resistance in the past
Immediate Support at 18258 odd levels
High risk traders may consider buying Nifty 17 Nov expiry 18300 Put option between 58-66 (CMP 62.50)
Target 84 / 96 / 102
SL 51.50
Disclaimer
- The view expressed here is my personal view
- Past performance is not a guarantee for future predictions
- Use this for educational purpose
- Any decision you take, you need to take responsibility for the same
- It's your hard earned money. Treat it wisely
- Trade / Invest keeping in mind your trading style, goals and objectives, time horizon & risk tolerance
- if trading in F&O, understand that F&O trading involves risk
- Do take proper risk management measures
- Do your own analysis and consult your financial adviser if need be

Laurus Lab: Important Support and Resistance levelsLaurus Lab
we are looking at weekly chart of Laurus Lab Ltd
the zone of 436-463 has seen buying interest on previous occasions
Target 1 for the current set up comes to around 583-604 zone
Target 2 - 700-720 odd levels
Time frame 2-3 years
A word of caution: Below 435 next important support is around 340-370 zone. So plan your trade accordingly...!!!
This is from Positional point of view for Longer time horizon
Take care & safe trading...!!!
Like and follow for more ideas like these

HDFCAMC in accumulation phaseHDFCAMC has formed a pennant pattern on a daily timeframe which is being backed by the support zone.
Reasons to enter -
1. Accumulating for the last 4 trading sessions.
2. Testing the trendline 3rd time.
3. Overall Market structure is bullish

SBIN: Chart analysis, view and trading strategySBIN
We are looking at weekly chart of SBIN stock
Observations
- SBIN is yet to give a weekly closing above the Sept 12 - Sept 19 weekly high
- support at 554 / 545 / 530 zone
Given the set up
One can wait for SBIN to close and sustain above 579 on a weekly closing basis or for at least 3 days before taking for fresh long position
Otherwise 530-540 zone could be a better place to enter
Derivatives Strategy
One may consider a Bear Call Spread strategy in SBIN for November series
Sell 600 Call option
Buy 630 Call option
Net receivables 6 points
Lot size 1500
Max Profit Potential of Rs 9000 per strategy lot till 24 Nov 2022
Profit potential of 12.5% approximately on Margin requirement
Take care & safe trading...!!!
Like, follow, share for more trading ideas like these
Disclaimer
-The view expressed here is my personal view
- Past performance is not a guarantee for future predictions
- I have been wrong in the past and can be wrong again in future too
- Use this for educational purpose
- Any decision you take, you need to take responsibility for the same
- It's your hard earned money. Treat it wisely
- Trade / Invest keeping in mind your trading style, goals and objectives, time horizon & risk tolerance
- if trading in F&O, understand that F&O trading involves risk
- Do take proper risk management measures
- Do your own analysis and consult your financial adviser if need be

Nifty: Is Nifty Feeling the October heat near resistance zone?Nifty
- We are looking at daily candlestick chart
Observations
- On 16 Sept Nifty opened gap down between 17877 to 17796
- coincidently Nifty 76.4% retracement level is also around same level 17777
- for 4 consecutive days Nifty is struggling at 17800 levels
- With 1 hour's trade to go today volume is on a lesser side
Given the conditions, fresh longs in Nifty can be avoided.
Have bought a few Put options for 24 November expiry.
Review points for me - View gets invalidated if Nifty trades above 17880
Please follow your risk management measures
Take care & safe trading...!!!
Disclaimer
-The view expressed here is my personal view
- Past performance is not a guarantee for future predictions
- I have been wrong in the past and can be wrong again in future too
- Use this for educational purpose
- Any decision you take, you need to take responsibility for the same
- It's your hard earned money. Treat it wisely
- Trade / Invest keeping in mind your trading style, goals and objectives, time horizon & risk tolerance
- if trading in F&O, understand that F&O trading involves risk
- Do take proper risk management measures
- Do your own analysis and consult your financial adviser if need be

Ambuja Cement: Chart set up, view and trade potential Ambuja cement
We are looking at weekly chart of Ambuja Cement
- weekly closing high 539.35
- low made thereafter 471.05
The stock has possibly done its short term target on the upside (Jitna neeche utna ooper)
View: Rangebound
Given the set up one may consider a Bear Call Spread strategy
Sell 560 Call option currently around 8.3
Buy 600 Call option currently around 3.1
Lot size 1800
Net receivables Rs 9360 per strategy lot
Margin requirement approximately 91K
Profit potential approximately 10.25% on Margin till 24 Nov 2022.
Protection for a rise up to 565.2 till 24 Nov expiry.
Review point for me, If weekly close is above 544. It gives ample scope to adjust / exit in case stock behaves in a different way. Do follow your risk management measures
Take care & safe trading...!!!
Like and follow for more trading ideas like this
Disclaimer
-The view expressed here is my personal view
- Past performance is not a guarantee for future predictions
- I have been wrong in the past and can be wrong again in future too
- Use this for educational purpose
- Any decision you take, you need to take responsibility for the same
- It's your hard earned money. Treat it wisely
- Trade / Invest keeping in mind your trading style, goals and objectives, time horizon & risk tolerance
- if trading in F&O, understand that F&O trading involves risk
- Do take proper risk management measures
- Do your own analysis and consult your financial adviser if need be

ICICI Bank: Chart set up and trading strategyICICI Bank
We are looking at daily candlestick chart pattern
Observations
- ICICI Bank chart reflects it made a gravestone doji on September 15, 2022 (indicates previous buyers were happy to sell at 936 odd levels)
- subsequently we saw profit booking in the stock
- now the stock is back at 920-940 odd levels
- we see ICICI Bank still not making a decisive move above the September 15 high
View going forward
- so far as ICICI Bank is below 945 odd levels we might see ICICI Bank rangebound
- support at 868 / 844
Given the set up one may consider a Bear Call Spread strategy in ICICI Bank
Sell 960 Call option currently around 12
Buy 1000 Call option currently around 4
Net receivables 8 points
Lot size 1375
Net profit potential Rs 11000 per strategy lot
Margin requirement - approximately 93500
Yield Potential - 11.75% approximately
Review point for me: If ICICI Bank closing is above 943.
It gives ample scope to adjust / exit in case stock moves otherwise. Pls follow your Risk management measures.
Take care & safe trading...!!!
Like and follow for more trading ideas like these
Disclaimer
- The view expressed here is my personal view
- Past performance is not a guarantee for future predictions
- I have been wrong in the past and can be wrong again in future too
- Use this for educational purpose
- Any decision you take, you need to take responsibility for the same
- It's your hard earned money. Treat it wisely
- Trade / Invest keeping in mind your trading style, goals and objectives, time horizon & risk tolerance
- if trading in F&O, understand that F&O trading involves risk
- Do take proper risk management measures
- Do your own analysis and consult your financial adviser if need be

DLF: Chart set up and trading strategyDLF
Multiple Line of resistance around 376 - 385
- 21 day EMA around 370
- 63 day EMA around 369
- 252 day EMA around 354
Given the set up one may consider a Short strangle strategy in DLF
Sell DLF 400 Call option
Sell DLF 340 Put option for October series
Net receivable Rs 9.6 per strategy lot.
Max profit potential Rs 15840 per strategy and gives a yield potential of approximately 11 % on Margin till expiry.
Review points, if closing below 353 or above 385
Take care & safe trading...!!!
Disclaimer
-The view expressed here is my personal view
- Past performance is not a guarantee for future predictions
- I have been wrong in the past and can be wrong again in future too
- Use this for educational purpose
- Any decision you take, you need to take responsibility for the same
- It's your hard earned money. Treat it wisely
- Trade / Invest keeping in mind your trading style, goals and objectives, time horizon & risk tolerance
- if trading in F&O, understand that F&O trading involves risk
- Do take proper risk management measures
- Do your own analysis and consult your financial adviser if need be

#BTC Bullish & Bearish Chart PatternStart Bullish Rally on 16-10-2022 to 18-10-2022
Start Bearish Rally on 18-10-2022 to 20-10-2022

Nifty: Chart set up for November series and trading strategyNifty
- we see Nifty trading above 21 day EMA, 63 day EMA and well above 252 day EMA
- Line of resistance around 18200 odd levels
- Line of Support around 16800
- So is the 200 day EMA support around 16780
Right now we are in the middle of the range
Trading strategy
Given the set up one may consider a Short Strangle strategy for Nifty for November series
Sell 18300 Call option currently around 93
Sell 16500 Put option currently around 79
Net receivables 172 points. Yield potential of approximately 9% on Margin deployed in strategy till 24 Nov 2022.
Loss in strategy if Nifty closes above 18472 or below 16328 on 24 November.
Review points for me, 18030 on the upside and 16800 on the lower side. This would give ample time to exit / adjust in case need be. You decide on your Risk Management part.
Take care & safe trading...!!!
Do Like and Follow for more such trading ideas!
Disclaimer
- The view expressed here is my personal view
- Past performance is not a guarantee for future predictions
- I have been wrong in the past and can be wrong again in future too
- Use this for educational purpose
- Any decision you take, you need to take responsibility for the same
- It's your hard earned money. Treat it wisely
- Trade / Invest keeping in mind your trading style, goals and objectives, time horizon & risk tolerance
- if trading in F&O, understand that F&O trading involves risk
- Do take proper risk management measures
- Do your own analysis and consult your financial adviser if need be

Nifty: Plan your investment / trade after you read this...
Observations
- we are looking at Post 2008 Global meltdown era
- the chart here is Nifty weekly chart
- we have used 252 week EMA for our thesis
- A Cycle here is defined as the rise of Nifty from 252 week EMA - making a top and then retesting the 252 week EMA
- correction only to the point of 252 EMA is taken in to consideration
- to cut off the noise, only time cycle where the candlestick is more than 104 weeks (2years) is considered
Cycle 1
- we see 80 weeks of Rising phase giving returns to the tune of 84% before peaking out
- the c orrection phase lasted 55 weeks and gave negative returns of 28.5%
Cycle 2
- In 79 weeks in the Rising phase , Nifty gave 79% approximately &
- in Correction phase it corrected 24.5% in 47 weeks
Cycle 3
- this was an exceptional phase as the Rising phase lasted 205 weeks before peaking out and gave returns of 81.5% approximately &
- the correction phase was the shorted and correction up to 252 week EMA was done in just 7 weeks which was 19% below the 12430 peak (again note we are not talking about full correction which was 39% but only correction up to 252 EMA here)
Cycle 4
- In the current cycle, if 18604 level is our peak so far, it was reached in 72 weeks giving returns of 89%
- the correction phase has already done 51 weeks so far & counting
Interesting co-relations
- Except for Cycle 3, The rising phase has been between 70-80 weeks
- All the 4 Rising phase have given returns to the tune of 80-90% approximately
- All the correction phase has been shorter than Rising phase
- currently 252 week EMA is approximately 26% away from the recent peak corelating well with historical corrections
Wow... that was too much of data analysis.😀
Whether Nifty retests 252 week EMA or not; only time will tell. All we can do is plan for it, be prepared and if opportunity does comes then be in control of the situation and make the most of it...😊
I hope the analysis would help you in planning your trade and investments...
AIM FOR THE BEST... PLAN FOR THE WORST !
Do let me know what you think in the comment section below
You can Thank me with a little Like and you can follow me of course. Feel free to share it, if you think it could help some one plan their trade and investment. It would make me feel the effort was worth it 🙏🙏
Take care & safe investing / trading...!!!
Disclaimer
- The view expressed here is my personal view
- Past performance is not a guarantee for future predictions
- I have been wrong in the past and can be wrong again in future too
- Use this for educational purpose
- Any decision you take, you need to take responsibility for the same
- It's your hard earned money. Treat it wisely
- Trade / Invest keeping in mind your trading style, goals and objectives, time horizon & risk tolerance
- if trading in F&O, understand that F&O trading involves risk
- Do take proper risk management measures
- Do your own analysis and consult your financial adviser if need be

Nifty Trade data analysis for trade decision making -Oct 12 2022Nifty
Retail traders had a bet neutral addition in Index Futures and in Options had a net positive bias
FIIs added more on the Short side in Index Futures and in Options had a net negative bias
Proprietary traders added Long in Index Futures but have hedged it using Options
Before taking any trade decision today Important pointers
PCR is at 0.72
Since PCR is in oversold region Fresh shorts might be risky and should be done near resistance levels.
Watch out for 17096 odd levels in Nifty futures. That would decide whether we see short covering rally or whether bounce fizzles out
Majority of Weekly Call Option buyers of yesterday are trapped now and might require a Nifty close above 17280 by 13 Oct
So understand the psychology of traders and take decision wisely
Like and follow
For more info you can Direct Message me
Disclaimer
- The view expressed here is my personal view
- Past performance is not a guarantee for future predictions
- I have been wrong in the past and can be wrong again in future too
- Use this for educational purpose
- Any decision you take, you need to take responsibility for the same
- It's your hard earned money. Treat it wisely
- Trade / Invest keeping in mind your trading style, goals and objectives, time horizon & risk tolerance
- if trading in F&O, understand that F&O trading involves risk
- Do take proper risk management measures
- Do your own analysis and consult your financial adviser if need be

Nifty at 240 day EMA and trading strategyNifty
- RBI Policy Meet on 28Sept- 30 Sept 2022
- Result season is about to begin
and Nifty is near 240 day EMA
Important Fibonacci level that may provide Support
61.8% retracement 16293
76.4% retracement 15868
Important Resistance zone
17166-17320 zone
17758-17820 zone
Given the set up one may consider to go for a Short Strangle strategy in Nifty for Oct series
Sell 15800 Put option and
Sell 17800 Call Option
The strategy has a profit potential of 10% and gives a protection
- for a fall up to 15620 odd levels on the downside
- for a rise up to 17980 odd levels in the up side
That's a protection of approximately 1200 points on either side from current levels. However do understand that trading in F&O involves risk. Read the disclaimer carefully.
Do Like and Share if you find it useful.
Take care & safe trading...!!!
Disclaimer
- The view expressed here is my personal view
- Past performance is not a guarantee for future predictions
- I have been wrong in the past and can be wrong again in future too
- Use this for educational purpose
- Any decision you take, you need to take responsibility for the same
- It's your hard earned money. Treat it wisely
- Trade / Invest keeping in mind your trading style, goals and objectives, time horizon & risk tolerance
- if trading in F&O, understand that F&O trading involves risk
- Do take proper risk management measures
- Do your own analysis and consult your financial adviser if need be

Nifty: How Data Analysis can help youYesterday's trade data clearly showcased that the FIIs had added Net Short position in Index Futures
Retail traders went long in Index Futures.
In Options retail traders were more active in Put side but had bias on the Long side.. .
Even in Stock Futures FIIs added Short positions
Trade with knowledge. Invest some time in study and then in trade....
My recent trading ideas
DLF, Asian Paints, TCS where sideways to short trade was suggested and IDFC First exiting from Long positions at 54.5
Like and Follow
Take care & safe trading...!!!
You can Direct Message for more info

Asian Paints: Chart set up and trading strategyAsian Paints
- After 3 Black crows candle stick pattern, recovery in the stock has been tepid so far
- The tepid recovery is also due to rise in crude oil prices during the same time.
- Given the setup, one may consider to sell Asian Paints 3500 Call Option around 50 (October series)
Keep a close watch if Asian Paints closes above 21 day EMA ( currently around 3386) and or crude prices cools off drastically
Take care & safe trading
Disclaimer
-The view expressed here is my personal view
- Past performance is not a guarantee for future predictions
- I have been wrong in the past and can be wrong again in future too
- Use this for educational purpose
- Any decision you take, you need to take responsibility for the same
- It's your hard earned money. Treat it wisely
- Trade / Invest keeping in mind your trading style, goals and objectives, time horizon & risk tolerance
- if trading in F&O, understand that F&O trading involves risk
- Do take proper risk management measures
- Do your own analysis and consult your financial adviser if need be

Nifty: Wheels on the Nifty go up and down On September 28, it was suggested that Nifty is near 240 day EMA and that 17166-17320 zone might act as short term resistance and short term support being around 16300 odd levels.
Well, Nifty has made a high of 17187 thereafter and and now is back at it's 240 day EMA.
For the October month, Important Support and resistance levels going forward
Gap support 1 - 16653-16746
Gap support 2 - 16360-16490
- 50 day and 20 day EMA around 17270 and 17340 coinciding with Gap resistance zone at 17166-17320
The Short strangle strategy suggested on 28 September, which had a Net receivables of 181 points at that time; is currently valued at 125. That gives a profit of 56 points per strategy lot. We continue to hold and as long as Nifty is between 16300-17320 odd points, we would be passive in our trading approach.
Important levels to watch out for till 6th October 2022
16980 / 17062 / 17123 on the upside
16855 / 17733 / 17608 on the downside
Take care & safe trading...!!!
Disclaimer
- The view expressed here is my personal view
- Past performance is not a guarantee for future predictions
- I have been wrong in the past and can be wrong again in future too
- Use this for educational purpose
- Any decision you take, you need to take responsibility for the same
- It's your hard earned money. Treat it wisely
- Trade / Invest keeping in mind your trading style, goals and objectives, time horizon & risk tolerance
- if trading in F&O, understand that F&O trading involves risk
- Do take proper risk management measures
- Do your own analysis and consult your financial adviser if need be

Nifty Future Downside This analysis is fot tutorial purpose only.
You can see here After completing 5 legs of Elliot wave now A & B has formed and formation of C wave is pending.Hopefully downside targets can be seen in coming week.See the possibility of two targets explained as two supports.

Types of participants in the derivatives marketHey everyone!
Last week we talked about the basics of derivatives and what all different derivative instruments are available in the markets. In this post, we will talk about the types of people who use derivatives and why they exist.
There are broadly three types of participants in the derivatives market:
→ Hedgers
→ Traders (also called speculators)
→ Arbitrageurs.
An individual may play different roles at different times.
Hedgers
→ They employ derivatives to mitigate the risk they suffer from fluctuations in the pricing of the underlying assets.
→ Institutions such as investment banks, central banks, hedge funds, etc. all use derivatives to hedge or reduce their exposures to market variables such as currency exchange rates, interest rates, equity values, bond prices, and commodity prices.
Speculators/Traders
→ The speculators are primary participants in the futures market.
→ They try to predict the future movements in prices of underlying assets and position themselves accordingly.
→ Speculators can be individual traders, proprietary trading firms, hedge funds, or market makers.
Arbitrageurs
→ Arbitrage is a deal that produces profit by exploiting a price difference in a product in two different markets.
→ Arbitrage occurs when a trader executes a simultaneous purchase and sale of the same asset in different markets in order to gain from tiny price differences between them.
→ The arbitrage trade is often short lives because the arbitrageurs would rush in executing these transactions, thereby closing the price gap at different locations.
Thanks for reading! Hope this was helpful.
See you all next week. 🙂
– Team TradingView
Feel free to check us out on Twitter , Instagram , and YouTube for more awesome content! 💘
