GBPUSD - FACES RESISTANCE AS BEARISH SIGNALS EMERGESymbol - GBPUSD
CMP - 1.3525
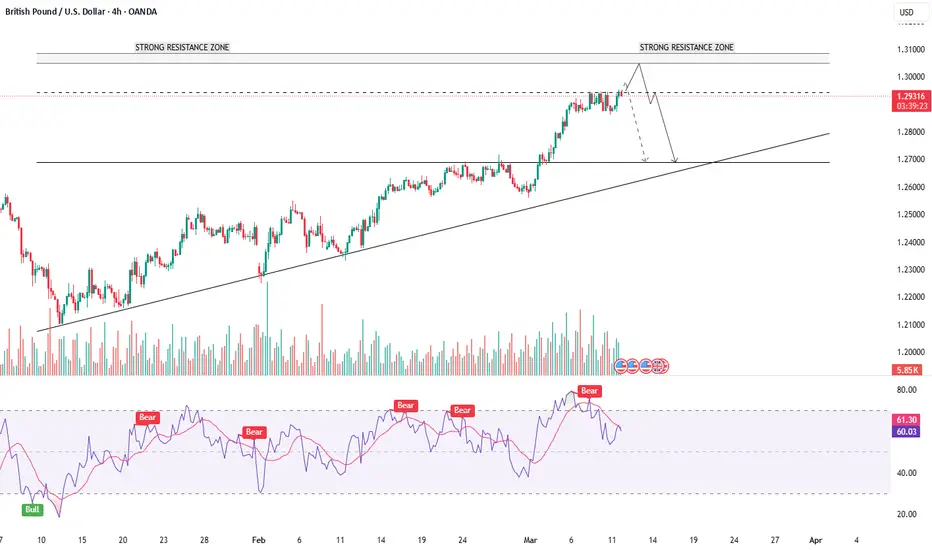
GBPUSD has been rallying amid a weakening US dollar but is now encountering strong resistance and showing signs of a false breakout suggesting a potential corrective phase ahead.
The pair is currently testing a key resistance zone within a distribution phase, with a double top pattern forming on the higher timeframe - a classic bearish reversal signal. Despite the broader bullish structure, the failure to sustain gains above key resistance 1.3600 and ongoing consolidation below 1.3545 point to weakening momentum.
Additionally, the US dollar has reached support levels and may begin to recover, adding further downward pressure on GBPUSD.
Resistance levels: 1.3548, 1.3570, 1.3600
Support levels: 1.3512, 1.3455
If the pair cannot hold above 1.3565 during this retest, a deeper pullback is likely, potentially offering short opportunities. The correction could extend toward the 1.3450–1.3365 & may test 1.3300 support range before any continuation of the broader uptrend.
GBPUSD

GBPUSD – Stalling at resistance, correction ahead?The market is reacting to a series of strong US economic data, especially the rising expectations for ADP and ISM PMI figures. This has boosted the USD, putting pressure on major currency pairs, including GBPUSD.
Looking at the H4 chart, GBPUSD is trading near the resistance zone around 1.35959 while also testing a long-term descending trendline – a level that has previously rejected price multiple times. Notably, although price is still holding above the EMA 34 and 89 support zone, recent candles reflect clear hesitation, suggesting the pair is “stuck at a crossroads.”
A reasonable technical scenario: if the price continues to be rejected at 1.35959 and breaks below the EMA confluence and support area at 1.34994, a short-term downtrend may resume. The nearest target would be around 1.34530 – a strong technical support that has held up price in the past.

GBPUSD IS BULLISH!!As per analysis, market is trending higher.
Two weeks before market is bullish ( gains a lot).
So last week profit booking happens( just my view only).
Now you know what will happen in bullish market after profit booking,
Yes market will go higher.
My first looking area 1.3632
Second one is 1.3747 area.
This is totally my view only , do your own analysis before taking any decision.
Market is simple, but not easy.
One more thing( I am in a long position from 1.3458)

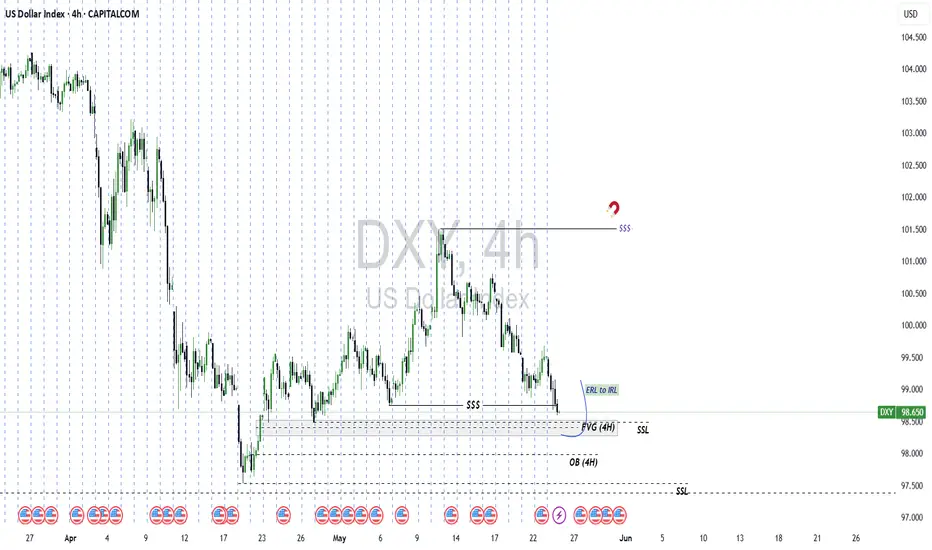
US Dollar to bounce? DXY Longs and EU shorts on the table.1. Based on the technical analysis, it seems that the US Dollar will have bounce after all. A quick liquidity purge near the SSL levels might be on the checklist. Nonethless, I'll be looking forward to EU shorts this week.
2. There is also a divergence between EU and GU on HTF. GU has shown liquidity purge on BSL which EU hasn't.
GBPUSD in bullish trend may be it can go uppppppGBPUSD in bullish trend may be it can go upppppp
we need to wait for d1 green and pullback in 1h timeframe and a bullish engulfing candlestick
in 1h timeframe on support level

GBPUSD SELLTechnically speaking, GBPUSD is in a downtrend on the 4H timeframe, with price slowly approaching a key sell area. I’ll be closely watching price action as it enters that zone to see if short positions make sense.
There are already a few potential downside targets in place, which makes the setup even more promising.
Let’s see how price reacts in that area.

Eurusd trade idea, again i sell in this tradeEurusd trade idea, again i sell in this trade
there is multiple reason for me to sell in this trade
1) trend is shifted bullish to bearish
2) daily candle is red , previous candle
3) price action taking rejection from resistance
4) 4h closed candle is hammer or pin bar

Eurusd worked very well in short position #eurusdEurusd worked very well in short position #eurusd
Reason for sell in this trade
1) daily closed candle is red
2) dxy shift of structre in bullish (short term)
3) breakout in 30 min. timeframe with strong bearish engulfing candlestick

"GBP/USD Bullish Setup: Eyeing 1.35656 Target "Trend: Bullish 📈
🔵 Price Channel
Price is moving inside an ascending channel 🔼
Top Line: Resistance
Bottom Line: Support
Multiple touchpoints confirm channel validity ●●●●●
📍Current Price: 1.34094
Above the 70 EMA (📉 EMA: 1.33510) ➡️ Bullish Bias ✅
📦 FVG (Fair Value Gap)
Zone: Potential support 🔵 Demand area
Expecting price to dip into this box before going up ⬇️🔵⬆️
🔒 Resistance Zone
Just above the FVG
Price faced rejection here 🚫
🎯 Target Point: 1.35656
Major bullish target for this setup 🚀
Clear sky above if price clears resistance ☁️➡️🌤️
🧠 Trade Idea
Wait for retracement into FVG zone 🔽
Enter Long (Buy) if support holds 💰
TP: 1.35656 🎯
SL: Below the FVG zone ❌
⚠️ Upcoming USD News Events

GBP/USD Rebounds as Tariff Fears EaseThe GBP/USD pair climbed to around 1.3270 on Thursday, snapping a two-day losing streak. The recent softening in concerns over potential tariff threats from U.S. President Donald Trump triggered some selling pressure on the U.S. dollar, offering a short-term lift for the pound. The move suggests a possible shift in sentiment as traders reassess the immediate risks in the global trade landscape.

GBP/USD at a Turning Point – Correction Pattern in PlayIt appears that the corrective Wave A in the GBP/USD pair is nearing completion, and the formation of Wave B may be underway. The Wave 1 to 5 structure seems to have been completed, indicating the beginning of an A-B-C corrective phase.
If the correction unfolds as expected, potential upside targets are 1.32918 and 1.33555. However, if the market faces rejection below the trendline, the stop-loss level would be 1.32021.

GBPUSD - EYEING 1.3430 BARRIER - CORRECTION LIKELYSymbol - GBPUSD
CMP - 1.3406
The GBPUSD pair is gaining strength amid a broader rally driven by the ongoing decline in the US Dollar Index. This depreciation in the dollar is largely attributed to prevailing political dynamics in the United States, a shift in sentiment toward lower interest rates, and ongoing trade-related tensions. As a result, major currency pairs - particularly those within the dollar basket are experiencing upward momentum.
In this context, the British pound is appreciating and approaching a key resistance level at 1.3430, this area has not been tested since its last confirmation approximately six months ago and is characterized by significant liquidity, which may initially hinder further upward movement.
Key Resistance Level: 1.3430
Key Support Levels: 1.3292, 1.3207
Should the price approach this resistance sharply and fail to break through decisively - potentially forming a false breakout, there may be a subsequent corrective move. In such a scenario, a pullback toward the liquidity rich zone around 1.3292 could occur, especially if the pair fails to consolidate above 1.3430.

Breakout Momentum: GBP/USD Eyes 1.3500+Hey traders! Let’s break down the setup on GBP/USD for this week.
Today, the pair successfully broke above the 1.3290 resistance, completing a classic cup and handle pattern on the H4 chart. Now, price is approaching the key 1.3415 daily high — a historically strong resistance zone.
📌 Technical view: EMA34 and EMA89 are trending upward, clearly supporting the bullish momentum. If a pullback occurs, the 1.3290–1.3210 zone could offer a solid BUY opportunity.
📰 News to watch: All eyes are on Fed Chair Jerome Powell’s speech tonight. The market anticipates a dovish tone, especially with U.S. jobless claims data also being released. Signs of economic softness could strengthen the case for rate cuts — and that’s GBPUSD-friendly.
🎯 Suggested strategy: Wait for a reaction at the support zone before entering long. If 1.3415 breaks, we could see a push towards 1.3500+ in the midterm.
Let’s see how it plays out — trade safe and stay sharp!

GBP/USD Head & Shoulders Breakdown – Bearish Trade Setup AlertPattern Breakdown:
Left Shoulder:
* Formed around April 15
* Medium-high peak
* Indicates early resistance
Head:
* Tallest peak around April 16
* Price exhaustion sign
Right Shoulder:
* Lower high formed after the head
* Matches the left shoulder
* Lower momentum from bulls
Neckline (Support):
* Horizontal blue zone
* Price has broken below
* Bearish confirmation
Trade Setup:
Entry Point:
* 🔽 1.32349
* Just below the neckline for confirmation
Stop Loss:
* ⛔ 1.32532
* Above right shoulder to limit risk
Target Point:
* 🎯 1.31200
* Based on height of the pattern
* Great Risk-to-Reward Ratio.
Indicators:
EMA 7 (Black Line)
* 📉 Current Price below EMA
* Acting as dynamic resistance.
What to Watch:
🔍 Look for strong bearish candle close below neckline
✅ Re-test of neckline as resistance can be ideal for entry
⏳ Wait for momentum confirmation if not entered yet.

GBP/USD Technical Outlook: Elliott Wave Mapping the Next MoveThis GBP/USD 4H chart presents an Elliott Wave analysis.
Wave (1) and (2): The market had an impulsive bullish movement in Wave 1, followed by a corrective Wave 2.
Wave (3): A strong bullish move with momentum.
Wave (4): A corrective phase, forming a triangle pattern (a-b-c-d-e), which suggests the market is preparing for another impulsive leg.
Entry Confirmation: A breakout above the triangle pattern.
First Target: 1.31457 (Fibonacci 0.382)
Second Target: 1.32105 (Fibonacci 0.5)

GBP/USD Analysis – Strong Resistance at the Daily Supply Zone🔥 Overview:
GBP/USD is currently reacting to a Daily Supply Zone, a key area where selling pressure could emerge. On the H4 timeframe, a BOS has formed, suggesting a potential shift in market structure.
📊 Detailed Analysis:
Daily Timeframe: Price is testing a major supply zone, which could act as a strong resistance level. If sellers step in, we might see a rejection from this area.
H4 Timeframe: A BOS has already occurred, indicating a break in the previous bullish momentum. Price could pull back slightly to retest the supply zone before continuing lower.
Potential Scenario: If price remains below the H4 supply zone, there is a high probability of further downside movement in the coming sessions.
⚠️ Key Takeaway: Waiting for additional confirmation from price action before entering a trade is crucial to managing risk effectively.
#GBPUSD #Forex #Trading

GBP/USD Trade Analysis: Bullish Reversal from Support ZoneExponential Moving Averages (EMAs):
200 EMA (Blue) at 1.29309: Represents the long-term trend.
30 EMA (Red) at 1.29122: Represents the short-term trend.
Price is currently below both EMAs, suggesting a bearish trend.
Support and Resistance Zones:
Resistance Zone (Purple at the top): Price previously reacted strongly at this level.
Support Zone (Purple at the bottom): A potential demand area where price is currently bouncing.
Trade Setup:
Entry Point: Near 1.28875 (highlighted on the chart).
Stop Loss: Set around 1.28714-1.28856, below the support zone.
Target Point: 1.29730, above the resistance and near the 200 EMA.
Risk-to-Reward Ratio: The setup aims for a higher reward than risk.
Trade Idea:
Bullish Reversal Trade: The price is reacting at a support zone, and the target aligns with a previous resistance level.
A confirmation (strong bullish candle or break of 30 EMA) could indicate a move toward 1.29730.
EMA Crossover Watch: If the 30 EMA crosses above the 200 EMA, it may confirm a stronger uptrend.
Potential Risks:
If price breaks below 1.28714, the bullish idea is invalid.
Resistance at 1.29309 (200 EMA) could slow the move upward.

GBPUSD - BULLS NEED TO EXERCISE CAUTION - NEWS AHEADSymbol - GBPUSD
CMP - 1.2937
The GBPUSD pair has shown impressive bullish strength recently, continuing its upward move against the US dollar. This strength can be attributed to aggressive sell-off of the US dollar, which has created a favorable environment for the British pound. The pair is currently trading in a critical zone, with consolidation at the 1.2920 - 1.2940 levels, making it a pivotal point for future price action.
From a technical standpoint, I previously shared my analysis when GBPUSD was trading around the 1.2460 levels, identifying a strong breakout, and I'm pleased to report that all the targets I set have been reached.
However, the current situation remains complex, with crucial economic data due to be released shortly. US JOLTs job openings data is expected later today, followed by CPI data tomorrow. These releases will have a significant impact on the US dollar, which in turn will influence GBPUSD. Given that the US dollar index (DXY) is trading at oversold levels, if the upcoming data comes more than forecast, we could see a strong rebound in the US dollar, potentially pushing GBPUSD lower. However, if the data comes lower than expected reading, it could trigger another corrective move in the DXY & an up move in GBPUSD. Despite this, I believe such a move would be a false breakdown in DXY, with the US dollar likely to recover and strengthen in the medium term.
In the event of weaker than forecast data, the GBPUSD pair could see a push towards the 1.3050-1.3080 levels. These levels represent strong resistance zones, where the pair is likely to encounter selling pressure. Should GBPUSD reach these levels, a reversal back towards lower levels is highly probable.
Key Support Levels: 1.2920, 1.2900
Key Resistance Levels: 1.2950, 1.3000, 1.3060
As key support for the pair is at 1.2920-1.2900, and a strong break below these levels could signal a potential shift in trend. On the other hand, resistance levels lie around 1.2950. If the bulls manage to push past these levels, we may see further price growth till 1.3050-1.3080. However, bulls should exercise caution at current levels. Any reversal could occur sooner than expected, given the prevailing market conditions and upcoming economic data releases.
In conclusion, the fate of GBPUSD heavily depends on the upcoming US economic data. Traders should closely monitor the JOLTs and CPI data, as these will likely dictate the next move for the pair.
USD PLUNGES – IS THIS THE START OF A VOLATILE YEAR?📌 MARKET OVERVIEW
The US Dollar (USD) is experiencing a sharp decline, with the DXY index dropping by 3.5% in the past week, marking its second-largest drop since the 2020 pandemic. More importantly, USD is now on a three-month losing streak, sending ripples across global financial markets.
👉 The Euro is the primary driver behind USD’s weakness, surging 4.7% against the USD, the biggest jump since 2009.
📌 DXY weakness amid escalating trade wars is a crucial signal – it indicates that major shifts are about to unfold in the financial markets!
📊 WHY IS THE USD DROPPING?
🔹 1. The Euro’s Strong Recovery
The Euro is benefiting from the European Central Bank (ECB) maintaining stable monetary policies, while the US Federal Reserve (FED) leans towards rate cuts.
This policy divergence has reduced the appeal of the USD, pushing the Euro to its highest level in over a decade.
🔹 2. Market Expectations of Fed Rate Cuts
Recent US economic data shows weaker inflation, increasing the likelihood that the FED may ease monetary policy soon.
Lower interest rates diminish the attractiveness of the USD, encouraging investors to shift capital into alternative assets like gold and the Euro.
🔹 3. Trade War & Economic Uncertainty
Tensions between the US and China continue to escalate, with Trump’s aggressive tariff policies adding to global trade instability.
However, instead of strengthening the USD, these policies are creating negative market sentiment, leading investors to pull away from USD-based assets.
📌 USD is now in a difficult position:
✔️ The FED may loosen monetary policy, weakening USD further.
✔️ The ongoing trade war is eroding confidence in the USD.
📉 HOW USD WEAKNESS AFFECTS GLOBAL MARKETS
🔸 Gold Surges as USD Declines
Gold prices rally whenever USD weakens, as investors move funds into safe-haven assets.
If USD continues to drop, gold could break its all-time high (ATH) and surge towards $2,970 - $3,000.
🔸 Stock Markets Could Benefit
Lower interest rates and a weaker USD generally support the US stock market, especially export-driven companies.
However, if recession fears intensify, investors may move towards safer investments like gold and government bonds.
🔸 Other Global Currencies May Strengthen
A weaker USD boosts major currencies like the Euro (EUR), British Pound (GBP), and Japanese Yen (JPY).
This could shift global trade dynamics, influencing economic trends in the coming months.
⚡️ CONCLUSION – IS USD IN FREE FALL?
📌 The USD’s three-month decline is a major warning sign, signaling potential shifts in global financial markets.
📌 If USD continues its downtrend, gold could hit new highs, while stocks may see increased volatility.
📌 Traders must closely monitor FED decisions on monetary policy and ongoing trade tensions between the US and China.

Second Buy Recommendation - GBP/JPY to 194-194.5I. Market Overview
GBP/JPY did not move as expected yesterday, but the overall uptrend remains intact.
The price has retested the 190.4 - 191.0 support zone and reacted positively.
Buying volume has increased significantly at the lows, indicating strong demand.
EMA 33 and EMA 50 on the H4 chart are still trending upward, supporting the bullish outlook.
II. Trading Strategy - Additional Buy (BUY 2)
1. Entry Points
🔹 BUY around 191.0 - 191.5 if the price continues to show positive reactions.
🔹 BUY more if the price revisits 190.4, as this remains a key support level.
2. Stop Loss (SL)
❌ Place SL below 189.8, as breaking this level may invalidate the uptrend.
3. Take Profit (TP) Targets
✅ TP1: 192.5 – Close 50% of the position and move SL to breakeven.
✅ TP2: 194.0 - 194.5 – Fully close the remaining position.
4. Risk Management
Risk-to-reward ratio (R:R) is approximately 2.5:1, suitable for swing trading.
If the price surges sharply, adjust the strategy based on real-time market movements.
III. Conclusion of Ngohungsky
Recommendation to continue buying GBP/JPY in the 191.0 - 191.5 range, with additional entries near 190.4 if necessary.
Targeting 194.0-194.5, but will partially take profit at 192.5 to secure gains.
The main trend remains bullish, so patience is required.
📌 Stay updated and adjust the strategy accordingly! 🚀

GBP/JPY Trading Strategy – Short to Target 185I. Technical Analysis
1. Overall Trend
On the H4 timeframe, GBP/JPY remains in a downtrend, as indicated by:
Lower highs and lower lows.
Price trading below both the EMA 50 & EMA 200, confirming bearish momentum.
A weak pullback formation, suggesting a continuation of the downtrend.
On the D1 timeframe, GBP/JPY is moving within a descending channel, encountering resistance around 191.4 - 192.8 (previous swing high and descending trendline).
2. Key Resistance & Support Levels
✅ Strong Resistance (Sell Zone):
190.2 - 191.45: Confluence of the descending trendline + EMA 50 on H4.
192.8: Major resistance level and a logical Stop Loss placement.
✅ Target Support (Take Profit):
185.2 - 185.0: A strong support zone from the previous low.
✅ Indicators Confirmation:
Decreasing volume on price pullback, indicating weakening bullish momentum.
RSI below 50, not yet oversold, leaving room for further downside movement.
II. Trading Strategy
1. Entry Points
Sell GBP/JPY around 190.2 - 191.45 upon price testing resistance.
Consider splitting the order:
Sell 50% at 190.2
Sell remaining 50% at 191.45 (if price continues upward).
2. Stop Loss (SL)
192.8: A break above this level invalidates the bearish setup.
3. Take Profit (TP)
TP1: 187.0 → Close 50% of the position and move SL to breakeven.
TP2: 185.2 - 185.0 → Fully close the trade.
4. Risk/Reward Ratio (R:R)
Average Entry: 190.8
SL: 192.8 (-2.0 pips)
TP: 185.2 (+5.6 pips)
R:R = 2.8:1 → Reward is 2.8 times the risk, making this an attractive swing trade setup.
III. Risk Management & Market Scenarios
🔸 If Price Moves in Favor
✅ Upon reaching 187.0, move SL to breakeven, ensuring no risk exposure.
🔸 If Price Hits 192.8
❌ Exit the trade entirely, as the bearish structure is broken.
🔸 Key Observations
⚠️ If price aggressively rises to 191.45 with strong volume, wait for bearish confirmation before entering.
IV. Conclusion of me
Short GBP/JPY at 190.2 - 191.45, TP at 185.2 - 185.0, SL at 192.8.
Strong R:R ratio (2.8:1), suitable for swing trading.
Expected Holding Period: Until mid-week, closely monitoring price action.
Follow me now, good luck evrybody!

GBPUSD - TREND REVERSAL?Symbol - GBPUSD
GBPUSD is attempting to capitalize on a potential trend reversal amid the ongoing correction of the U.S. dollar. The price is currently testing a key resistance level within a consolidation phase, indicating a possible breakout. On the daily timeframe, the price remains above the previously breached trendline, with the effort to surpass the resistance providing insights into market sentiment. A continued correction in the dollar could benefit the British pound, particularly if the U.S. Dollar Index breaks below 107 and moves toward the 106-105 range.
From a technical perspective, attention is centered on the 1.257 level, which acts as a crucial resistance threshold. A sustained break and consolidation above this level may trigger a rally.
Resistance levels: 1.2575, 1.2718
Support levels: 1.250, 1.2377
I do not rule out the possibility of a retest of the 1.250 support level to accumulate liquidity before further upward movement. The dollar is expected to continue its correction following remarks from Trump and Powell regarding potential rate cuts.

GBPUSD Inverse head and shoulder patternFX:GBPUSD
Hi All, here you can see that, GBPUSD has created a Inverse head and shoulder pattern in 1D Time Frame. so we can go for long and pull back entries.
