MTARTECH: Trendline BO with Fresh Momentun, Chart of the WeekNSE:MTARTECH Trendline Breakout after Signals Fresh Momentum as BofA Takes Stake in It. Let us understand it in the "Chart of the Week."
As per the Latest SEBI Mandate, this isn't a Trading/Investment RECOMMENDATION nor for Educational Purposes; it is just for Informational purposes only. The chart data used is 3 Months old, as Showing Live Chart Data is not allowed according to the New SEBI Mandate.
Disclaimer: "I am not a SEBI REGISTERED RESEARCH ANALYST AND INVESTMENT ADVISER."
This analysis is intended solely for informational purposes and should not be interpreted as financial advice. It is advisable to consult a qualified financial advisor or conduct thorough research before making investment decisions.
Price Action Overview:
- Current Price: ₹2,689.70 (+13.38%)
- 52-Week High: ₹2,920.35
- 52-Week Low: ₹1,155.60
- The stock has broken out from a multi-month symmetrical triangle pattern with strong volumes
- Price is currently trading 8% below its all-time high, showing recovery momentum
- A recent breakout occurred with significant volume expansion (6.66M vs the average of 2.38M)
Volume Spread Analysis:
- Current Volume: 6.66M (significantly above average)
- Average Volume: 2.38M
- Volume Spike: Nearly 3x the average, confirming strong institutional interest
- Breakout accompanied by highest volume in recent months
- Volume expansion during up-moves and contraction during corrections is a bullish sign
- Green volume bars dominating in recent sessions indicating buying pressure
Symmetrical Triangle Breakout:
- Formation Period: Mid-2024 to Early 2026
- Apex Point: Around ₹1,600-1,700 zone
- Breakout Level: ₹2,400-2,450
- Pattern indicates consolidation followed by directional move
- Breakout suggests potential continuation of the prior uptrend from 2022 to 2023
Descending Trendline Break:
- A major descending trendline resistance from the 2023 peak has been decisively broken
- This trendline acted as resistance throughout 2024-2025
- Break confirms shift in market sentiment from bearish to bullish
Key Support and Resistance Levels:
Major Support Zones:
- Immediate Support: ₹2,400-2,450 (breakout zone and recent consolidation)
- Secondary Support: ₹2,200-2,250 (previous resistance turned support)
- Strong Support: ₹1,900-2,000 (triangle mid-point and psychological level)
- Critical Support: ₹1,600-1,700 (triangle apex and long-term support)
Major Resistance Zones:
- Immediate Resistance: ₹2,750-2,800 (short-term supply zone)
- Major Resistance: ₹2,900-2,920 (all-time high zone)
- Psychological Resistance: ₹3,000 (round number psychological barrier)
Base Formation:
- Primary Base: The symmetrical triangle from mid-2024 to early 2026 represents a consolidation base
- This base formed after a significant decline from the 2023 highs
- Base width suggests potential for sustained upward movement
- The longer consolidation typically leads to stronger breakouts
Trend Analysis:
- Short-term Trend (Daily): Bullish with strong momentum
- Medium-term Trend (Weekly): Transitioning from consolidation to bullish
- Long-term Trend (Monthly): In recovery phase after 2023-2024 correction
- Price trading above key moving average levels post-breakout
Sectoral Backdrop:
Clean Energy and Nuclear Power Sector:
- India's nuclear power capacity expansion plans gaining momentum
- Government targeting 100 GW nuclear capacity by 2047
- Small Modular Reactors (SMRs) emerging as key focus area
- Global shift toward carbon-neutral energy boosting nuclear power demand
- MTAR is positioned as a key supplier to India's nuclear program
Defense Manufacturing Sector:
- India's defense budget increased to ₹6.21 lakh crore for FY25
- The government's 'Aatmanirbhar Bharat' initiative driving domestic defense manufacturing
- Capital outlay for defense modernization supporting equipment manufacturers
- Private sector participation in defense production expanding
- MTAR supplies critical components to defence applications, including missile systems
Space Technology Sector:
- ISRO's increasing launch frequency and ambitious missions
- Private space sector opening up with policy reforms
- Growing demand for satellite components and launch vehicle parts
- India positioning itself as a low-cost space launch provider globally
- MTAR manufactures precision components for space applications
Industrial and Clean Energy Equipment:
- India's renewable energy target of 500 GW by 2030
- Growing demand for precision-engineered components in various industries
- Export opportunities expanding in specialized manufacturing
- The government's PLI schemes supporting manufacturing competitiveness
Fundamental Backdrop:
Company Overview:
- MTAR Technologies is a precision engineering solutions company
- Specializes in manufacturing critical and precision components
- Serves diversified sectors: Nuclear, Defense, Space, and Clean Energy
- Established reputation with marquee clients including ISRO, BARC, DRDO
- Listed on NSE and BSE in March 2021
Recent Key Developments:
- BofA Securities (Bank of America) has reportedly acquired a stake in the company
- This institutional interest signals confidence in the company's growth prospects
- The timing of the stake acquisition coinciding with technical breakout is noteworthy
- Institutional buying often precedes sustained upward moves
Business Strengths:
- Strong order book visibility across multiple sectors
- High entry barriers due to specialized manufacturing capabilities
- Long-term relationships with government and PSU clients
- Diversified revenue streams reducing concentration risk
- Focus on high-margin precision engineering products
Growth Drivers:
- Expanding nuclear power program in India
- Increasing defense indigenization requirements
- Growing space sector opportunities with ISRO and private players
- Clean energy transition driving demand for specialized components
- Potential for export growth in precision engineering
Key Metrics to Watch:
- Order book growth and execution
- Revenue mix across different sectors
- Operating margins and profitability trends
- Capacity utilization and expansion plans
- Working capital management
Risk Factors:
- Failure to hold ₹2,400 support could trigger profit booking
- Market-wide correction could impact momentum
- Any negative news on key sectors (defence/nuclear) could affect sentiment
- Overbought conditions in the near term may lead to consolidation
Key Levels to Watch:
- Breakout Confirmation: Sustained trade above ₹2,700
- Momentum Acceleration: Break above ₹2,920 (all-time high)
- Support Test: How price behaves if it retests ₹2,400-2,450 zone
- Volume Sustenance: Whether high volumes continue or fade
My 2 Cents:
MTAR Technologies is showing a strong technical setup following a prior symmetrical triangle breakout and current trendline breakout with exceptional volumes. The combination of technical breakout, institutional interest from BofA Securities, and favorable sectoral tailwinds in nuclear, defense, and space sectors creates a compelling case. However, traders should watch for confirmation above the ₹2,700-2,750 levels and manage risk appropriately. The stock's positioning in high-growth strategic sectors provides a supportive fundamental backdrop for the technical rally.
Full Coverage on my Mid-Week Newsletter coming Wednesday.
Keep in the Watchlist and DOYR.
NO RECO. For Buy/Sell.
📌Thank you for exploring my idea! I hope you found it valuable.
🙏FOLLOW for more
👍BOOST if you found it useful.
✍️COMMENT below with your views.
Meanwhile, check out my other stock ideas on the right side until this trade is activated. I would love your feedback.
As per the Latest SEBI Mandate, this isn't a Trading/Investment RECOMMENDATION nor for Educational Purposes; it is just for Informational purposes only. The chart data used is 3 Months old, as Showing Live Chart Data is not allowed according to the New SEBI Mandate.
Disclaimer: "I am not a SEBI REGISTERED RESEARCH ANALYST AND INVESTMENT ADVISER."
This analysis is intended solely for informational purposes and should not be interpreted as financial advice. It is advisable to consult a qualified financial advisor or conduct thorough research before making investment decisions.
Higherhigh

Secret Observations That Made Me a Better TraderDiscover the hidden market manipulation techniques institutional traders use to control price action, plus my observations, these secret patterns helps make you a better trader and get more observant using trading view tools and charts
Data used is 3 months old . This content is for educational and entertainment purposes only.

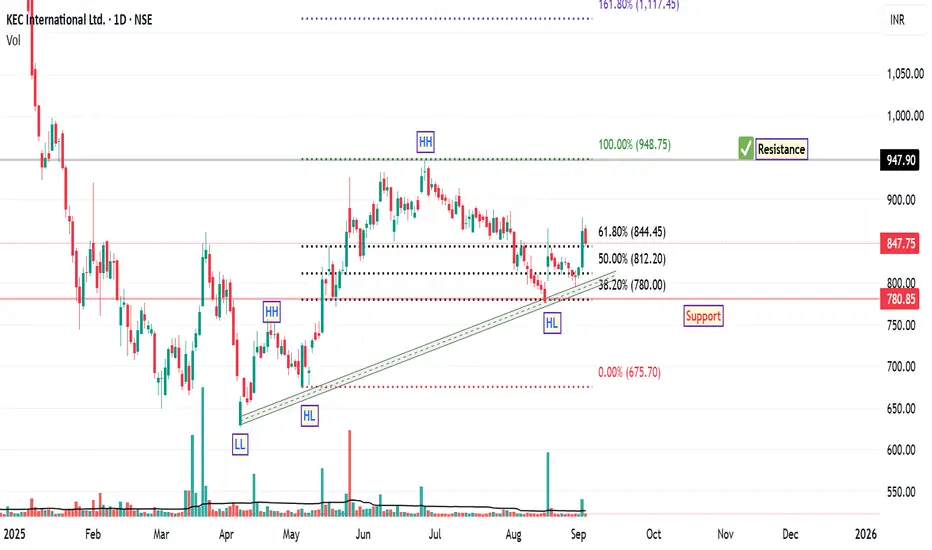
KEC International: Bullish Structure with StrengthSince April 7th, the price structure of KEC International has demonstrated a notable bullish trend reversal, characterized by the formation of higher highs and higher lows along an ascending trendline. This pattern is often interpreted by technical analysts as a sign of strengthening upward momentum.
A recent Fibonacci retracement, drawn from the swing low to the swing high of the current rally, revealed a pullback to the 38.2% level—a zone commonly viewed as a potential support area within a prevailing uptrend. The stock responded positively to this level, rebounding and subsequently closing above the 61.8% retracement level, which is another key technical threshold.
Interestingly, the price has retested the 61.8% level and held firm, suggesting that this area may be acting as a support base. Additionally, the stock has managed to close above its 200-day EMA, a long-term trend indicator that many market participants use to assess broader directional bias. A sustained position above the 200 EMA is generally considered constructive from a trend-following perspective.
From a structural standpoint, based on current chart dynamics, the next potential resistance zone appears to be near ₹948, while the suggested support level is around ₹780 . These levels are derived from historical price action and technical confluence zones, and may serve as reference points for monitoring future price behaviour.
Disclaimer: This analysis is intended solely for educational and informational purposes. It does not constitute investment advice or a recommendation to buy, sell, or hold any financial instrument. Market conditions are subject to change, and trading decisions should be made based on individual research, risk assessment, and consultation with a licensed financial advisor.
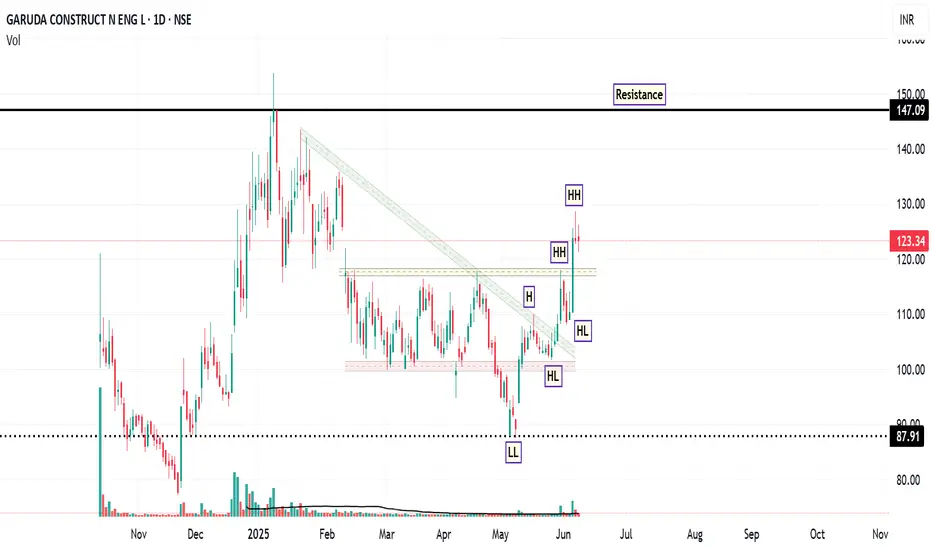
Garuda: Riding the Momentum WaveFrom February to late May 2025, the stock of GARUDA was trading in a sideways consolidation range, roughly between ₹100 (support) and ₹115-₹120 (resistance). The recent powerful green candles have shattered the upper boundary of this range. Also, the most significant event on the daily chart is the decisive breakout from a descending trendline that had capped prices. Also, LL and HH formation observed on daily chart.
The breakout was accompanied by a significant spike in volume ( 862.88K shares ), which is substantially higher than the average volume during the consolidation period. High volume on a breakout lends strong credibility to the move.
The RSI is at a strong 69.20 . It is in bullish territory and rising, indicating strong buying momentum. It is approaching the overbought region (>70), but is not there yet, leaving room for further upside before becoming extended.
If the stock consolidates above the ₹120-₹121 support level. Buyers step in on any minor dip till ₹118 , and the price then continues its upward trajectory towards the resistance targets of ₹129 and subsequently ₹149 .
Disclaimer: This technical analysis is for informational purposes only and should not be considered as financial advice. Trading in the stock market involves risk. Always conduct your own research and consult with a qualified financial advisor before making any investment decisions.
CANFINHOME - Higher Highs & Higher LowsCANFINHOME is making HH-HL formation.
Now giving breakout of resistance, moving above 20ema, RSI is also looking strong.
There is probability of an upside move, looks good above 759.
✅ If you like my analysis, please follow me as a token of appreciation :)
in.tradingview.com/u/SatpalS/
📌 For learning and educational purposes only, not a recommendation. Please consult your financial advisor before investing.

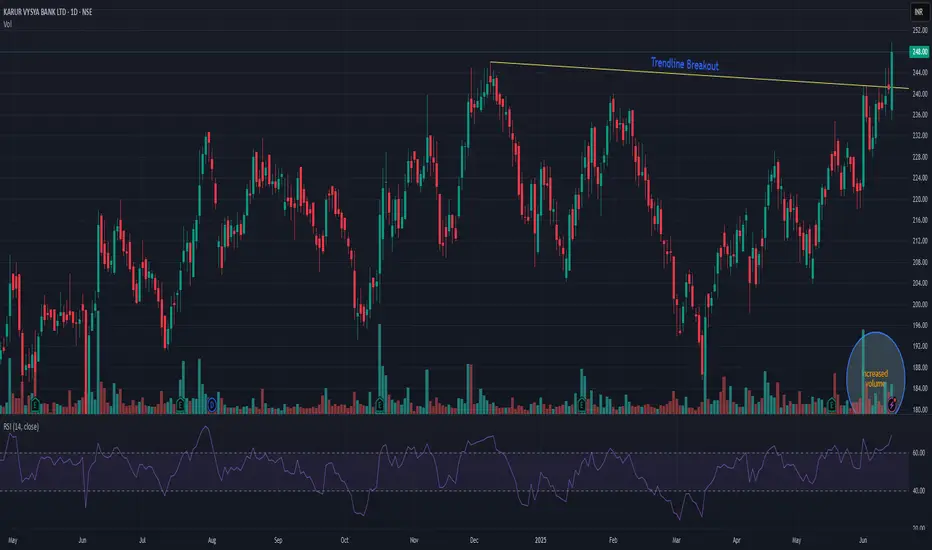
KARURVYASYAKARURVYSYA has given trend-line breakout. The stock is continuously making higher high and higher-low pattern with increased market participation. Also it crossed previous resistance level as well. It seems like it will continue its momentum ride. The stock is trading at ATH. Closing below 220 may change my view. It may face resistance nr 285 levels.
Vlegov resilient in this weak market. Keep on radar. ✅Stock is trading in a channel.
✅Taking support at the bottom of the channel and
50 DMA
✅HH-HL pattern is not violated yet.
✅Stock in stage 2 backed with good volume.
✅Low volume when stock is pulling back.
✅Showing resilience in this weak market.
✅Part of Digital theme which could be the next big
thing in India.
❗️Fundamentally not strong as of now.
❗️Showing resilience in a weak market doesn't mean
it will never fall.
❗️Ideal entry was when the stock reversed from the
channel bottom with a bullish Marabozu.
❗️Ideal SL from CMP is very steep.
❗️The market is still under the control of bears and
we are yet to get a strong reversal sign.
Keep this stock on your radar. Safe traders wait for Nifty to close above 25200 or let the stock break out of the current base. The breakout level is 181.26. Risky traders can try going long with limited quantity at CMP. Present market is FOMO inducing. Keep your FOMO under control.
Risk management is the key, so please do not trade based on anyone's analysis. The point of sharing this chart is educational, and this is not trading advice.

POLYCAB: Connection Profit KaPolycab is ready to move ahead and continue the momentum it has.
India is growing as a consumption market; the most basic consumption is home buying and home decoration.
Cables and wires are essential and aggressive industries.
So as per momentum right now Polycab is priced at 7050 target would be of 7700-7900
with SL of 6750.
It does not constitute and cannot replace investment advice. We therefore recommend that you contact your personal financial advisor before carrying out specific transactions and investments.

IOC stuck in consolidation zone & trying to take support.
Took support of small trendline.
Can go upto latest high which is near 192 in upcoming months.
After giving a breakout of 192 it can rise upto 228 as a price breakout calculation method.

Suntv-An amazing swing trade in this media sector stock!Suntv had a strong supply zone of 570-600 which was broken and retested successfully.
Stock has made higher high, higher low and broke its previous high.
An uptrend is confirmed and we can have bullish move continuing in this stock.
A relatively safe stock from risky media sector for investment as well.

RRR like AAA interesting chart and will interesting result AAA is very good chart pattern + high move with high risk
holding 2 flag that is sign of jackpot
high move in single day and achieved his goal of circuit
near by life time high and than actual grab the momentum of higher high prices.
now price is 68 TRG 82/98/108/120 and more than that
that is high risky high moveable stock not for safe investors
that i upload only for my study.

Higher Highs Higher Lows - Short Sell - VTL📊 Script: VTL
📊 Sector: Textiles
📊 Industry: Textiles - Cotton/Blended
Key highlights: 💡⚡
📈 Script is forming Higher Highs Higher Lows patterns on daily chart.
📈 We may see stock price at 422 on downwards.
📈 One can go for Short Swing Trade.
⏱️ C.M.P 📑💰- 438
🟢 Target 🎯🏆 - 422
⚠️ Important: Always maintain your Risk & Reward Ratio.
✅Like and follow to never miss a new idea!✅
Disclaimer: I am not SEBI Registered Advisor. My posts are purely for training and educational purposes.
Eat🍜 Sleep😴 TradingView📈 Repeat 🔁
Happy learning with trading. Cheers!🥂

NIFTY DAILY - 19/3/2024Nifty open with huge gap down and bear took control of it and made low of the day that is 21793 level.
Index has broke consolidation line and higher high higher low pattern.
Nifty has formed a big red body candle with upper and lower shadows.
Nifty has given closing below 22831 level which was its support level so, 21667 level will work as next support level and 21906 will work as resistance level.
Today’s Advance Decline ratio of NIFTY50
Advance - 9
Decline - 41
FII Buy + 1421.48 crore
DII Buy + 7449.48 crore.
⚠️ Important: Always maintain your Risk & Reward Ratio.
✅Like and follow to never miss a new idea!✅
Disclaimer: I am not SEBI Registered Advisor. My posts are purely for training and educational purposes.
Eat🍜 Sleep😴 TradingView📈 Repeat 🔁
Happy learning with trading. Cheers!🥂

Higher High Higher Lows - VARDHMAN ACRYLICS📊 Script: VARDHACRLC
📊 Sector: Textiles
📊 Industry: Textiles - Manmade
Key highlights: 💡⚡
📈 Script is trading at upper band of BB and giving breakout of it.
📈 MACD is giving crossover .
📈 Double Moving Averages giving crossover.
📈 Right now RSI is around 67.
📈 Script is making Higher High Higher Lows as shown in chart.
📈 One can go for Swing Trade.
⏱️ C.M.P 📑💰- 72
🟢 Target 🎯🏆 - 80
⚠️ Stoploss ☠️🚫 - 68
⚠️ Important: Always maintain your Risk & Reward Ratio.
✅Like and follow to never miss a new idea!✅
Disclaimer: I am not SEBI Registered Advisor. My posts are purely for training and educational purposes.
Eat🍜 Sleep😴 TradingView📈 Repeat 🔁
Happy learning with trading. Cheers!🥂

BHARAT FORGE TURNING INTO MISSILEBUY BHARAT FORGE 900 for 1000 to 1040. Perfect weekly rounding breakout at all time highs. Keep stop near 775 range on weekly closing basis. Bharat Forge has been awarded as defence license

Can Paytm reach 1000 with this breakout?The infamous stock of Paytm which was the largest IPO at the time of its listing has eroded IPO investor's wealth by more than 50%.
However, the strong has been consolidating from quite few months now. We have seen multiple buybacks from the founder and promoter in this stock during the same which was a positive sign.
However, near the release of Q4 2023 results, the stock had started its uptrend by forming higher highs, higher lows.
Now, the stock has given a breakout of inverted head and shoulders with heavy volumes last week whose neckline was 750. The stock has given weekly closing above 800 levels which is a big positive for the stock. The stock might face an immediate resistance near 840-850.
One can keep this stock on watchlist for buying near retest of 750-760 levels if there is a retracement for big targets of 990, 1125.
Note:- This idea is shared for educational purposes and should not be considered as a recommendation.

GODREJCP Possible tradeAnalysis in weekly time frame.
Took support nearly at 1000 . and making a neutral candlestick.
Now if crosses 1047, High possibility to reach near latest swing high at 1100 and 1150.
And if crosses 1000, then possibility to reach near horizontal support near 950 or trend line support.
And if it breaks or crosses the triangle the we can see the level of 1300 in coming few weeks.

EURUSD LONG IDEAHey before you trade #DYOR I’m sharing my idea which is based on technical analysis for more accuracy you can check news or event update.
EURUSD 1Hr Chart analysis current price is given breakout on 1hr chart, as per 4hr trend retesting is complete, for target and new retrace are you can check chart I share.
You need to wait for retrace area to break and create new HH.
Follow Like Share
Thank you

Jindal Saw swing tradeHH formation breakout on daily TF in Jindal saw chart, perfect for swing trade. Go long above 262 and keep stoploss 225 with a target of 1:2.
ENTRY:262
STOPLOSS:225
TARGET:1:2 OR 1:3

SPARC | SWING TRADE | BULLISH MOMENTUMSPARC | SWING TRADE | BULLISH MOMENTUM
Below are the indicators of bullish momentum
1) Market Structure Breakout
2) Stock taking support of 20 EMA for past 2 weeks
3) Triangle Pattern Breakout
Note: This Analysis is only for educational purpose

Titagarh Wagons Ltd swing tradeTitagarh Wagons Ltd is close to breakout level on daily timeframe, candle closing above 358.20 can be considered as an opportunity for swing trade. Wait for daily candle closing above 358.20 and Stoploss will be the swing low (320).
ENTRY:AFTER BREAKOUT (358.20)
STOP LOSS:320
TARGET=1:2 OR 1:3

Bullish Run in Tata Communications Ltd. An Investor's Delighthowdy Traders,
Much of the power of bullish investors is found in Tata Communications.
If seen inside the chart, higher high and lower low is shown in parallel channels.
1429 level was a strong resistance level but now it is a support.
If the market sustains above the 1429 level then a bullish market can be seen and 1480 is the target.

SBI LIFE INSURANCE Wedge Pattern Could Lead Significant MoveHowdy Traders,
I feel that the market may give a little negative I because the doji candlestick pattern is seen at the higher highs followed immediately by a black candlestick, indicating that the market may provide a little negative move.
Note = If the market stays below the level of 1249 then Target- 1231.90
