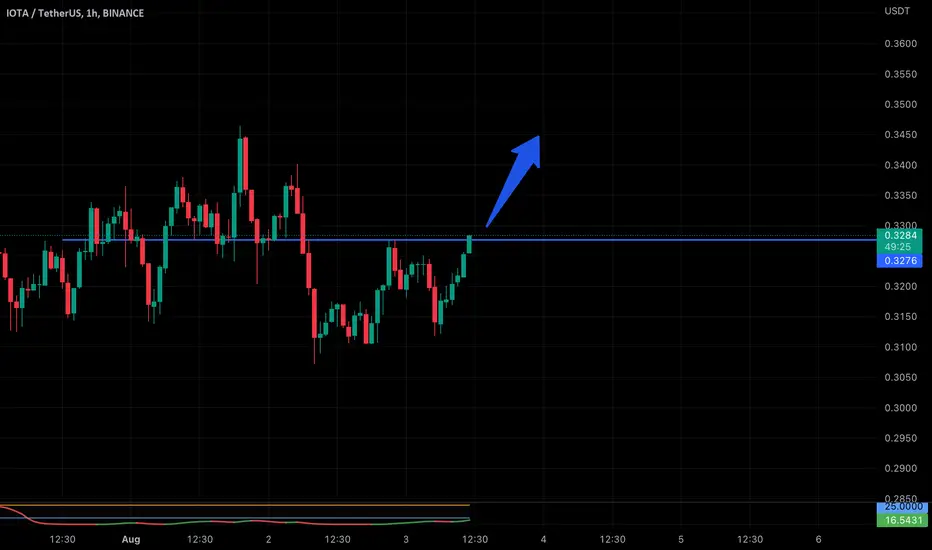
IOTA BREAKING OUT (small breakout)Keep eyes on iota, possible breakout from here
Use low funds #dyor
Iotausd
💡Don't miss the great buy opportunity in IOTAUSD @iota
Trading suggestion:
". There is a possibility of temporary retracement to the suggested support line (1.2663).
. if so, traders can set orders based on Price Action and expect to reach short-term targets."
Technical analysis:
. IOTAUSD is in a range bound, and the beginning of an uptrend is expected.
. The price is above the 21-Day WEMA, which acts as a dynamic support.
. The RSI is at 66.
Take Profits:
TP1= @ 1.5745
TP2= @ 1.8226
TP3= @ 2.1680
TP4= @ 2.3656
TP5= @ 2.6258
SL= Break below S2
❤️ If you find this helpful and want more FREE forecasts in TradingView
. . . . . Please show your support back,
. . . . . . . . Hit the 👍 LIKE button,
. . . . . . . . . . Drop some feedback below in the comment!
❤️ Your Support is very much 🙏 appreciated! ❤️
💎 Want us to help you become a better Forex / Crypto trader ?
Now, It's your turn !
Be sure to leave a comment; let us know how you see this opportunity and forecast.
Trade well, ❤️
ForecastCity English Support Team ❤️

IOTA/USDT Head & Shoulder Formation- IOTA/USDT after a good rally, now at the top its forming Head & Shoulder pattern.
- This kind of pattern is normally formed on the TOP of the market after a rally.
- Wait for the Price Action when it touches the NeckLine of the pattern.
- Breakdown with volume will confirm that the down move or correction started.
Target for downside = Height of Head

Don't miss the great buy opportunity in IOTUSDTrading suggestion:
. There is a possibility of temporary retracement to suggested support line (0.2118). if so, traders can set orders based on Price Action and expect to reach short-term targets.
Technical analysis:
. IOTUSD is in a range bound and the beginning of uptrend is expected.
.The price is above the 21-Day WEMA which acts as a dynamic support.
. The RSI is at 70.
Take Profits:
TP1= @ 0.2975
TP2= @ 0.3680
TP3= @ 0.5537
SL= Break below S2

Don't miss the great buy opportunity in IOTUSDTrading suggestion:
. There is a possibility of temporary retracement to suggested support line (0.2255). if so, traders can set orders based on Price Action and expect to reach short-term targets.
Technical analysis:
. IOTUSD is in a range bound and the beginning of uptrend is expected.
.The price is above the 21-Day WEMA which acts as a dynamic support.
. The RSI is at 43.
Take Profits:
TP1= @ 0.2570
TP2= @ 0.3675
TP3= @ 0.5532
SL= Break below S2

There is a possibility for the beginning of an uptrend in IOTUSDTechnical analysis:
. IOTA/DOLLAR is in a range bound and the beginning of uptrend is expected.
.The price is above the 21-Day WEMA which acts as a dynamic support.
. The RSI is at 70.
Trading suggestion:
. There is a possibility of temporary retracement to suggested support zone (0.2215 to 0.1895). if so, traders can set orders based on Price Action and expect to reach short-term targets.
Beginning of entry zone (0.2215)
Ending of entry zone (0.1895)
Entry signal:
Signal to enter the market occurs when the price comes to " Buy zone " then forms one of the reversal patterns, whether " Bullish Engulfing ", " Hammer " or " Valley " in other words, NO entry signal when the price comes to the zone BUT after any of reversal patterns is formed in the zone. To learn more about " Entry signal " and the special version of our " Price Action " strategy FOLLOW our lessons :
Take Profits:
TP1= @ 0.2880
TP2= @ 0.3510
TP3= @ 0.4535
TP4= @ 0.5550
TP5= @ 0.7450
TP6= @ 1.1145
TP7= @ 1.4130
TP8= @ 1.7110
TP9= @ 2.1945
TP10= @ 2.6775
TP11= Free

There is a trading opportunity to buy in IOTAUSDTechnical analysis:
. IOTA/DOLLAR is in a range bound and the beginning of uptrend is expected.
.The price is below the 21-Day WEMA which acts as a dynamic resistance.
. The RSI is at 40.
Trading suggestion:
. There is a possibility of temporary retracement to suggested support zone (0.2660 to 0.2045). if so, traders can set orders based on Price Action and expect to reach short-term targets.
Beginning of entry zone (0.2660)
Ending of entry zone (0.2045)
Entry signal:
Signal to enter the market occurs when the price comes to "Buy zone" then forms one of the reversal patterns, whether "Bullish Engulfing" , "Hammer" or "Valley" in other words,
NO entry signal when the price comes to the zone BUT after any of the reversal patterns is formed in the zone.
To learn more about "Entry signal" and the special version of our "Price Action" strategy FOLLOW our lessons:
Take Profits:
TP1= @ 0.3340
TP2= @ 0.4015
TP3= @ 0.4535
TP4= @ 0.5260
TP5= @ 0.6105
TP6= @ 0.7920
TP7= @ 0.9265
TP8= @ 1.1550
TP9= @ 1.4475
TP10= @ 1.7435
TP11= @ 2.2170
TP12= @ 2.6930
TP13= @ 3.3680
TP14= @ 4.2300
TP15= Free

A second Chance to Buy in IOTAUSDMidterm forecast:
0.4015 is a major support, while this level is not broken, the Midterm wave will be uptrend.
Technical analysis:
Price is above WEMA21, if price drops more, this line can act as dynamic support against more losses.
Relative strength index ( RSI ) is 55.
New trading suggestion:
*There is still a possibility of temporary retracement to suggested support line (0.4015). if so, traders can set orders based on Price Action and expect to reach short-term targets.
*If you missed our first HUNT, you have a second chance to buy above the suggested support line (0.4015).
Entry signal:
Signal to enter the market occurs when the price comes to " Buy zone " then forms one of the reversal patterns, whether " Bullish Engulfing ", " Hammer " or " Valley " in other words, NO entry signal when the price comes to the zone BUT after any of reversal patterns is formed in the zone. To learn more about " Entry signal " and the special version of our " Price Action " strategy FOLLOW our lessons :
Trade Setup:
We opened 15 BUY trade(s) @ 0.3196 based on 'Valley' entry method at 2019.04.29.
Total Profit: 19315 pip
Closed trade(s): 4366 pip Profit
Open trade(s): 14949 149pip Profit
Closed Profit:
TP1 @ 0.3340 touched at 2019.05.13 with 144 pip Profit.
TP2 @ 0.4015 touched at 2019.05.15 with 819 pip Profit.
TP3 @ 0.4535 touched at 2019.05.16 with 1339 pip Profit.
TP4 @ 0.5260 touched at 2019.05.29 with 2064 pip Profit.
144 + 819 + 1339 + 2064 = 4366
Open Profit:
Profit for one trade is 0.4555 (current price) - 0.3196 (open price) = 1359 pip
11 trade(s) still open, therefore total profit for open trade(s) is 1359 x 11 = 14949 pip
All SLs moved to Break-even point.
Take Profits:
TP5= @ 0.6105
TP6= @ 0.7920
TP7= @ 0.9265
TP8= @ 1.1550
TP9= @ 1.4475
TP10= @ 1.7435
TP11= @ 2.2170
TP12= @ 2.6930
TP13= @ 3.3680
TP14= @ 4.2300
TP15= Free

There is a possibility for the beginning of an uptrend in IOTUSDTechnical analysis:
. IOTA/DOLLAR is in a range bound and the beginning of uptrend is expected.
. The price is below the 21-Day WEMA which acts as a dynamic resistance.
. The RSI is at 39.
. While the RSI and the price downtrend in the Daily chart are not broken, bearish wave in price would continue .
Trading suggestion:
. Price is in the resistance zone (0.96 to 0.70), traders can set orders based on Daily-Trading-Opportunities and expect to reach short-term targets.
Beginning of entry zone (0.96)
Ending of entry zone (0.70)
Entry signal:
Signal to enter the market occurs when the price comes to "Buy zone" then forms one of the reversal patterns, whether "Bullish Engulfing" , "Hammer" or "Valley" in other words,
NO entry signal when the price comes to the zone BUT after any of the reversal patterns is formed in the zone.
To learn more about "Entry signal" and the special version of our "Price Action" strategy FOLLOW our lessons:
Take Profits:
TP1= @ 1.16
TP2= @ 1.33
TP3= @ 1.62
TP4= @ 2.04
TP5= @ 2.60
TP6= @ 3.10
TP7= @ 3.92
TP8= @ 4.75
TP9= @ 5.80
TP10= Free

A trading opportunity to buy in IOTUSDTechnical analysis:
. IOTA/DOLLAR is in a range bound and the beginning of uptrend is expected.
. The price is below the 21-Day WEMA which acts as a dynamic resistance.
. The RSI is at 43.
. While the RSI and the price downtrend in the Daily chart are not broken, bearish wave in price would continue .
Trading suggestion:
. There is still a possibility of temporary retracement to suggested support zone (0.96 to 0.70). if so, traders can set orders based on Price Action and expect to reach short-term targets.
Beginning of entry zone (0.96)
Ending of entry zone (0.70)
Entry signal:
Signal to enter the market occurs when the price comes to "Buy zone" then forms one of the reversal patterns, whether "Bullish Engulfing" , "Hammer" or "Valley" in other words,
NO entry signal when the price comes to the zone BUT after any of reversal patterns is formed in the zone.
To learn more about "Entry signal" and the special version of our "Price Action" strategy FOLLOW our lessons:
Take Profits:
TP1= @ 1.16
TP2= @ 1.33
TP3= @ 1.62
TP4= @ 2.04
TP5= @ 2.60
TP6= @ 3.10
TP7= @ 3.92
TP8= @ 4.75
TP9= @ 5.80
TP10= Free

long binance listed on iota/usdt so it has access to wider areai had a 12% didnt thought this surprise bought it when it was 19k satoshis its now 25k satoshi

IOTA/USD - 4 HOUR CHART EXTREMELY BULLISHFollow up of my yesterday's 1 hour chart based analysis where a long bias was given at around 4.
IOTA/USD
CMP 4.80
Target 5.50 plus
Right Wedge breakout observed with extremely high volumes.
Signifies great momentum based bullish pattern.
5.50 is a conservative target.
Can go further beyond 5.50 close to 7 plus if short term volatility is ignored.

IOTA/USD - Yet another bullish moveIOTA/USD
CMP 4.03
Target 5 plus
1) 30/200 ema crossover point.
2) price pierces past the trend resistance line with good volumes.

IOTA / USD - Nice bullish setupIOTA / USD CMP 1.91
Daily chart
Bias : Long
Rationale:
1) Price breaks upward trending resistance line with huge volumes.
2) Further complemented by penant breakout which resulted in the current spike.
3) Good one to go long with a target of 2.25 plus.
4) View not valid if price drops below 1.65.
