Daily Nifty, smallcaps and Banknifty TalkI made educational content videos for trading, I am a Full time trade and My name is Apoorv .
General index chart and price action was discussed in this video - no bias or directions .
MIDCAP

Lets Talk about Nifty, Midcaps, Smallcaps and Banknifty A very general talk on the charts and where they are - more of a awareness sort of video- to exactly know where we are trading in terms of index . I make educational content videos for trading

Midcap Multi-Bagger Moves in Trading1. Understanding Midcap Stocks
Midcap stocks generally refer to companies with a market capitalization ranging between ₹5,000 crore to ₹20,000 crore (or $500 million to $5 billion) depending on the market. They strike a balance between stability and growth potential:
Large-cap stocks are stable but slow-growing.
Small-cap stocks offer high growth but come with extreme volatility.
Midcap stocks combine growth potential with manageable risk, making them ideal candidates for multi-bagger moves.
Midcaps are often in the growth phase of their lifecycle. They have proven business models but are not yet fully recognized by institutional investors. This under-representation creates opportunities for early investors to gain extraordinary returns.
2. Characteristics of Midcap Multi-Bagger Stocks
Not all midcap stocks become multi-baggers. Successful midcap multi-baggers usually share some common characteristics:
Strong Revenue and Earnings Growth: Companies showing consistent growth in revenue and net profits, often higher than industry averages.
Scalable Business Model: Ability to expand operations, enter new markets, or increase product offerings without proportionally increasing costs.
Innovative Products/Services: Midcaps introducing unique products or services that create market disruption.
High Return Ratios: Consistently high ROE (Return on Equity) and ROCE (Return on Capital Employed) indicate efficient use of capital.
Low Debt Levels: Companies with manageable debt can reinvest profits into growth rather than servicing loans.
Institutional Recognition: Gradual interest from mutual funds and large investors often acts as a catalyst for price appreciation.
3. Factors Driving Multi-Bagger Moves
The movement of midcap stocks into multi-bagger territory is driven by a combination of fundamental, technical, and macroeconomic factors:
a) Fundamental Drivers
Profitability Expansion: Companies increasing margins due to operational efficiency, technology adoption, or scale benefits.
Sectoral Tailwinds: Industries experiencing high demand, regulatory support, or government incentives (like IT, renewable energy, pharmaceuticals).
Market Share Gains: Companies successfully capturing competitors’ market share through innovation or cost leadership.
b) Technical Drivers
Breakout Patterns: Price movements above historical resistance levels often attract momentum traders.
Volume Expansion: Rising volumes signal genuine investor interest and reduce liquidity concerns.
Institutional Accumulation: When large investors buy in gradually, it supports price stability and long-term uptrend.
c) Macroeconomic Factors
Economic Growth: Midcaps benefit more in a growing economy due to scalability and higher discretionary spending.
Policy Support: Favorable government policies like Make in India, tax incentives, or industry-specific reforms accelerate growth.
Liquidity Conditions: Low-interest rates and higher retail participation often drive up stock prices, including midcaps.
4. Strategies to Identify Midcap Multi-Baggers
Investors employ multiple strategies to identify potential midcap multi-baggers:
Fundamental Analysis:
Analyze balance sheets for revenue and profit growth.
Assess profitability ratios like ROE, ROCE, and profit margins.
Check debt-to-equity ratios and cash flows.
Sectoral Analysis:
Identify industries with high growth potential.
Look for midcaps within these sectors that are leaders or emerging leaders.
Technical Screening:
Use moving averages, trend lines, and volume indicators to spot breakout stocks.
Identify consolidation patterns that precede a rally.
Growth vs. Valuation Analysis:
A true multi-bagger is often undervalued relative to its growth potential.
Metrics like PEG ratio (Price/Earnings to Growth) can be useful.
Tracking Promoter Holding and Insider Buying:
Increasing promoter confidence is often a precursor to stock price appreciation.
Macro Awareness:
Be aware of government initiatives, economic cycles, and sector-specific reforms.
5. Risks Associated with Midcap Multi-Baggers
While midcap multi-baggers are enticing, they come with risks that every trader should be aware of:
Volatility: Prices can fluctuate dramatically due to low liquidity.
Market Sentiment: Negative news or global macro events can disproportionately impact midcaps.
Execution Risk: Companies may fail to scale operations efficiently, leading to missed expectations.
Overvaluation Risk: During bull markets, midcaps often get overvalued, leading to corrections.
Regulatory Risk: Policy changes can affect midcap companies more than established large-cap firms.
Risk management strategies like stop-loss orders, portfolio diversification, and position sizing are crucial to protect capital.
6. Trading Approaches for Midcap Multi-Baggers
There are multiple ways to approach midcap multi-bagger stocks in trading:
a) Long-Term Investment (Buy & Hold)
Buy fundamentally strong midcaps with multi-bagger potential.
Hold through market volatility to realize exponential gains over 3-5 years.
b) Momentum Trading
Focus on midcaps showing breakout patterns, high relative strength, and institutional buying.
Enter during upward trends and exit once momentum weakens.
c) Swing Trading
Identify short-term price oscillations in fundamentally strong midcaps.
Capitalize on price swings while limiting exposure to prolonged downturns.
d) Options Strategies
Use call options to leverage returns with limited capital in highly promising midcap stocks.
Protective puts can hedge against unexpected downtrends.
7. Case Studies of Midcap Multi-Baggers
Several midcap companies in India and globally have delivered exceptional returns:
Bajaj Finance (India) – Evolved from midcap to large-cap, delivering 10x+ returns over a decade.
Page Industries (India) – Niche player in textiles, achieved multi-bagger status due to consistent growth.
Eicher Motors (India) – Benefited from strong product positioning and market share gains.
Case studies highlight the importance of timely investment, research, and patience in reaping multi-bagger benefits.
8. Tips for Retail Traders
Diversify: Avoid putting all capital into one midcap stock.
Focus on Fundamentals: Short-term volatility may be high, but strong fundamentals increase multi-bagger chances.
Monitor Trends: Follow market news, sector growth, and macroeconomic indicators.
Patience is Key: Multi-bagger moves often take 3–7 years to materialize.
Avoid Herd Mentality: Don’t chase stocks just because they are trending; focus on research-based picks.
Conclusion
Midcap multi-baggers represent a unique opportunity for traders and investors willing to balance risk and reward. These stocks lie at the intersection of growth, innovation, and market inefficiencies. While identifying them requires a combination of fundamental research, technical analysis, and macroeconomic awareness, the potential rewards can be extraordinary. By understanding the drivers, risks, and strategies involved, traders can position themselves to benefit from the transformational wealth creation that midcap multi-baggers offer.
The world of midcap trading is not for the faint-hearted, but for disciplined investors with a growth mindset, it can be the playground of extraordinary returns.
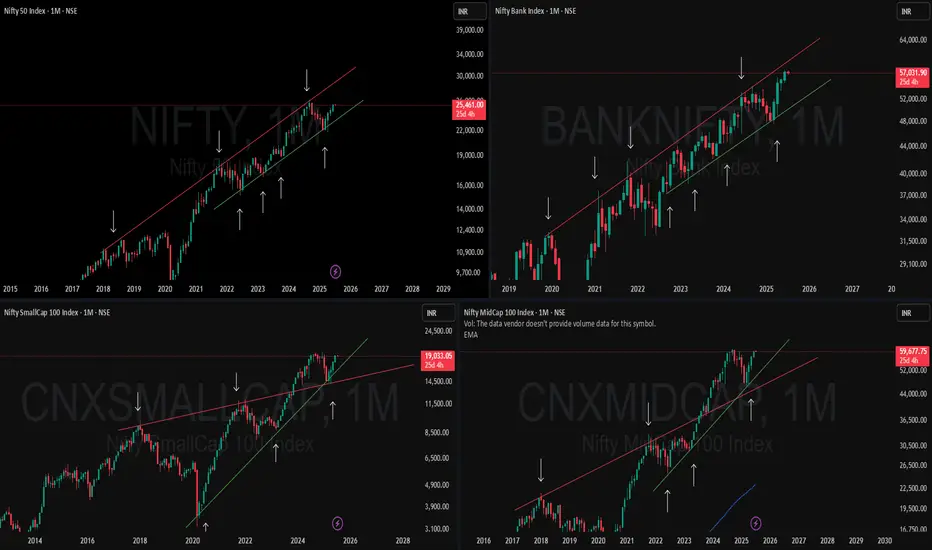
How These 2 Lines Caught Every Major Move in All 4 Indices! 📈 Keep It Simple, Keep It Powerful
When price action starts making sense, you’ll realize how far a single Support and Resistance line can take you.
🟥🟩 NIFTY & BANKNIFTY – Two clear examples of parallel channel trends, marching higher with clean Higher Highs and Higher Lows.
🟩🟥 MIDCAP & SMALLCAP – Not just catching up, but breaking out of Multi-Timeframe contraction patterns with strength — a sign of broader market participation.
They're now retesting and reclaiming previous highs after a much-needed breather.
💡What this chart tells us:
-Trendlines aren't just lines—they’re psychological guides to institutional and retail behavior.
-All four indices are moving in structured, rhythmic patterns.
-Simplicity works best. The markets speak clearly when you know what to listen for.

Nifty Midcap150 -At make or break level?Nifty Midcap is standing on a confluence of support of trendline as well as horizontal support.
22000 looks like a make or break level for Nifty Midcap.
If this support breaks, we might see a quick fall to 21650, 21480, 21300 levels.
If this support is sustained, we can expect a bounce to 22200, 22500+ levels
Keep this chart in focus for further swing trades. Fibonacci levels will be crucial now.

JUBLINGREA showing Inverted H&S patternJUBLINGREA showing Inverted H&S pattern. Pattern breakout with decent volume. Above 583 will be decisive.

#CNXMIDCAP100 INDEX ANALYSISIn line with CNXSMALLCAP 100 CNXMIDCAP100 Still have some upside at least till touch of RSI trendline at this point of time. Daily candle is bearish but looking at RSI trendline line , i can see some upside left.


RENUKA on important levelRENUKA trading near 51.5. Closing above 53.5 will be very important. This may decides upcoming trend. It will give breakout only above 53.5. One can keep it in a watchlist.

ORIENTPPR on v long term chartStock seems too good above 62.25
keep it in a watchlist. can be added even in pullback

KNR constructions longLong KNR constructions
CMP 265
Triangle breakout with good volume.
It can be fake breakout
So,
Buy Above 277
Stoploss 226
Swing Trade
Target 1 299
Target 2 310
Long Term
Target 1 317
Target 2 339

MIDCP NIFTY INDEX LEVELSMIDCP LEVELS for trading and positional based. Follow these for support/resistance and make your setup easy.
NOTE: I'm not a SEBI REG. Study before investing.

Midcap Nifty on Monday150-300 Point move on monday in midcap nifty.
enter breakout of previous day high, or break down of previous day low.
tgt for upside till 10950
tgt for downside til 10750

Quess Corp AnalysisAfter the recent fall in Mid Cap and Small Cap stocks across all counters in the Indian Stock Market, we're now anticipating a good reversal in the Mid-Small index as well as stock for the new financial year.
Thus, here's Quess Corp for April Month.
CMP- 527
Target- 600, 650 and 678 (Short, Mid and Long respectively)
Stoploss- 453 (Trailing)
Duration- Short term to Long term, based on your research, goals and advise from Financial Advisor.
let me know what you think :)

Small cap Mid cap Mayhem - Will it continue ? This week sell off was triggered by SEBI chairman's statement about a bubble in small caps and midcap . In this video , i discuss about the possible outlook for small caps and midcaps and should you stay invested ?
Cheers

13 Mar ’24 — Nifty breaks 2 support, goes bearish todayNifty Analysis - Stance Bearish⬇️
Recap from yesterday: “One thing is sure, the sudden price moves we are seeing right now are quite indicative of a massive shift in fundamentals. Technical Analysis cannot detect the directional impact this early, but it would be prudent to keep an eye out for any possible clues.”
4mts chart
We got some action today on Nifty but not on BankNifty. Nifty broke 2 support levels namely 22295 and 22051 and pulled back from the 3rd support @ 21913. Whereas BankNifty did not break down. Can you believe that Nifty closed with a loss of 338 points whereas BankNifty closed only 301 points lower? Our stance on Nifty goes from Bullish to Bearish directly whereas for BankNifty we are still maintaining the neutral stance.
The concept of support and resistance is so evident today, see the 3 encircled regions, the first one around the 22295 levels, 2nd one at the 22051 level, and then the 3rd one at 21913. The only time Nifty took a pause was at these marked zones. Today’s fall aligned with the news about the possible “froth” in the mid and small caps. If the BTFD people would be kind enough to pass on this opportunity, we could have a meaningful correction on our indices. In the long run, a correction is better and healthier.
Tomorrow is expiry, and we hope Nifty re-enters the 21913 to 21491 neutral band. This is the same flat zone that held nifty from 15th Dec 2023 to 15th Feb 2024. I wouldn't really mind spending another month in this zone. The challenge would be the aspect of momentum. Both of us know the market is shorted by weak hands, strong hands could enter this space and push down 800 to 1000 points in a week, if that happens Nifty could even fall below 21491 opening up avenues for further outflows. Coming back to the “froth” aspect of the market, the first to fall will be the small and midcaps, but those moves are contagious. Large caps will be the last to fall and last to recover.
63mts chart

Nifty Midcap Select Index Rising Channel BreakdownThe Nifty Midcap Select Index (NIFTY_MID_SELECT) is showing a rising channel breakdown, indicating potential bearish movement.
Breaching lower trendline - traders may consider this as a caution period until the next bullish confirmation forms.

28 Feb ’24 — Nifty takes out 22051 support, quite unexpected ➡️Nifty Analysis - Stance Neutral ➡️
Recap from yesterday: “They need to take out the 22051 and 21913 support levels, which is only possible if we have a macro level bad news. Banks are the only sector that could give away such an opportunity. Already the FIIs are not so happy with the future prospects of the financial sector in India. A small trigger could set the ball rolling and before long it could become an avalanche.”
4mts chart
Nifty did fall today and the trigger was a news/event. AMFI issued a circular to all the Trustees to “protect the interest of investors of small-cap and mid-cap schemes”. And then gave a 21 day window to disclose this instruction on the respective websites. Ideally, this shouldn't impact the large-cap companies, but since it did - we may have to reassess the total risk to SIP inflows and outflows.
Coming back to technicals, Nifty50 fell 314 points today ~ 1.42%. The first pause Nifty50 had today was at the 22051 support level, from 10.59 to 14.15 this level was at play. Even though we got the 2nd leg of fall from 12.51 to 13.11 - the pullback ensured we retraced up to the 22051 erstwhile resistance. And guess what, Nifty had its next halt right at the 21913 support level. Literally saved by the bell.
On the higher timeframe, today’s move negates the flag pattern and instead, we have a double top (M pattern). Since this M pattern’s both legs are sitting at 21913 - the priority should be higher than the bullish flag set earlier. If Nifty50 had broken the 21913 today, we would have changed the stance from bullish to bearish right away. Hence we are going with a neutral stance tomorrow and would immediately go bearish if we have a gap down opening or sustained trades below the 21913 after the opening hour. Since we have the monthly expiry tomorrow - there is no better day to go bearish. The options premium will go up and it should be an option sellers day tomorrow.
63mts chart

MIDCAP NIFTY (Demand & Supply zones)MIDCAP NIFTY looks neutral. Levels are based on supply and demand zones. This is my personal view
NOTE: I'm not a SEBI REG. Study before investing.

PAYTM Swing Trade Update - #Paytm is currently a complete catalyst-based stock
- Catalysts, positive, and negative news are driving its prices up and down
- logically you shouldn't attempt a trade in Paytm if your Portfolio is small
- Allocate 2-5% of your 100k here only if you are ready to risk 10%
- Paytm has a wide stop-loss trade due to lower Circuits
- I think a dead cat bounce looks inevitable in Paytm now
