Sbilifeinsurance
SBI Life cmp 1589.85 by Daily Chart views*SBI Life cmp 1589.85 by Daily Chart views*
- Support Zone 1566 to 1593 Price Band
- Stock Price testing retesting Support Zone since 28-October-2024
- Volumes stable since 28-October-2024 indicates probable accumulation
- Support at 1530 > 1470 > 1390 with the Resistance at 1645 > 1710 >1780
SBILIFE Rally, Breakout. With Full details. Previous Long term resistance of 1380 has now become the support level for SBI LIFE.
When a resistance turns into a support it adds more confidence to the upcoming trend.
Currently we can see a breakout from a descending triangle pattern in the daily Time Frame.
Currently a good HH and HL is observed in Daily Candles there fore we can expect further movement towards the higher side unless observed otherwise.
Happy Trading,
Yamini Prabu
NSE, NISM Certified TA,
Indepedent Trader/Trainer
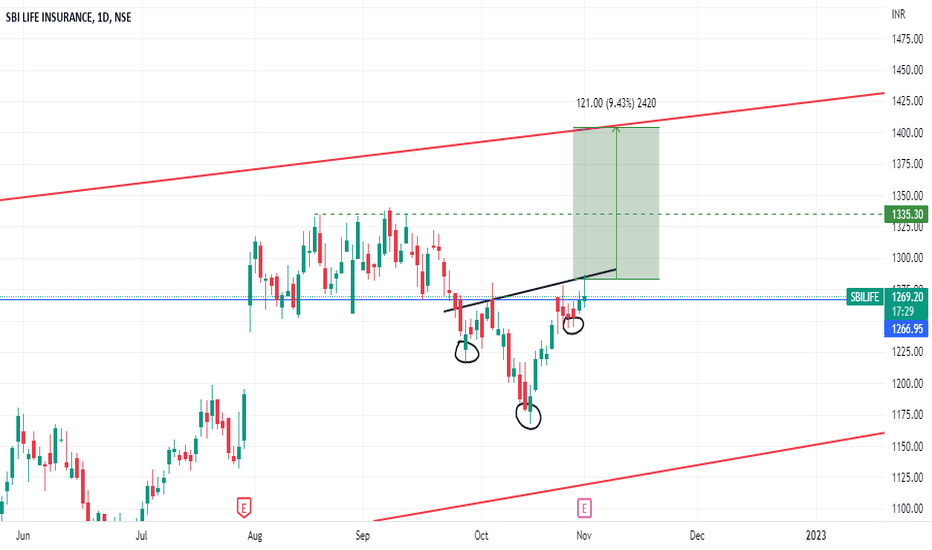
SBILife ATH breakout with IHNS patternSBILife has given ATH breakout with good volumes.
It is a Inverted head and shoulder pattern breakout.
Minimum target can be 1600. SL can be below 1225 DCB. Try to enter at retest in 1300-1325 zone.
Please note that swing trade of ATH breakouts in an FNO stock is always risky.
Idea shared for educational purposes only.
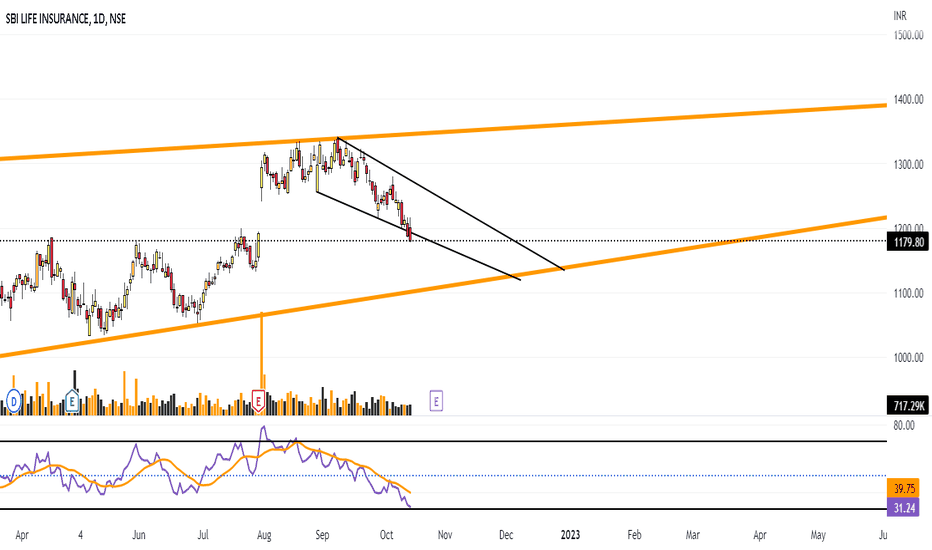
SBI LIFE INSURANCE Wedge Pattern Could Lead Significant MoveHowdy Traders,
I feel that the market may give a little negative I because the doji candlestick pattern is seen at the higher highs followed immediately by a black candlestick, indicating that the market may provide a little negative move.
Note = If the market stays below the level of 1249 then Target- 1231.90
SBI Life Double Bottom RSI Divergence SBI Life has formed double bottom pattern on daily chart. while the RSI is making higher lows which is sign of RSI Bullish Divergence.
Entry:
We can go long after close of strong bullish candle near support zone.
Stoploss:
We can keep stoploss below the support zone.
Target:
We can keep target near the next resistance zone which will be also the neckline of W pattern in future, as marked on chart.
Please Like and Follow me.
@SBILIFE #SBILIFE : Almost 40% downside MOvement expected.@SBILIFE #SBILIFE
SBILIFE : Almost 40% MOvement expected.
almost 40% Profit
Breakdown Happened on lower timeframe, so first target is 1072, if it crosses 1072 and acts as resistance, the we can expect a huge downward movement upto 750 i.e 40% profit.
NOTE: Published Ideas are for ‘’EDUCATIONAL PURPOSE ONLY’’ trade at your own risk.
NOTE: RESPECT The risk. SL should not be more than 2% of the capital.
Happy Trading
SBI Life Chart Analysis !!📈 SBI Life 📉
My Findings :-
1. Breakout from resistance zone which was support also earlier.
2. Strong Candle at breakout.
3. Close Above March 2022 High.
Bias- Long
Target- 1205, 1234 and 1288
SL- 1099
RR- 1: 2
All Important Supports and Resistances are drawn in chart. All levels are on closing basis.
Please have a look and revert back if you need some more study on it.
Disclaimer : Consult Your Financial Advisor Before Taking Any Decision On This Analysis.


