LAURUS LABS FORMED A MORNING STAR CANDLESTICK PATTERN LAURUS LABS FORMED A MORNING STAR CANDLESTICK PATTERN
Search in ideas for "CANDLESTICK"

Surya Roshni Formed a morning star Candlestick patternSurya Roshni Formed a morning star Candlestick pattern and seems it is ready to throw some "Roshni" of money on us as well.

Action/Reaction Multiple Support/Candlestick Matching Low/RSICurrently price is at multiple support. Action/Reaction set is also suggesting a reversal at this level. RSI is coming out of Oversold Zone. It has formed a reversal Matching low candlestick yesterday. All these are suggesting to buy the stock at current level and expect minimum target of 280.
Disclaimer : All ideas and comments are my personnel view. Please take financial consultancy for trading decision.

TITAN - BULLISH MARUBOZU CANDLESTICK FORMATION It is been observed on the daily chart that the price action forms a bullish Marubozu candlestick pattern with a breakout from a downward trend line indicating buyers dominance over the price action and control over prices. It shall move further up to next resistance levels.
Target 1: 332
Target 2: 340
Stoploss: 312

Long Lower Shadow candlestick on CEAT - LONGLong Lower Shadow candlestick pattern and OI analysis also positive sign for Long.
OI Analysis:
Price - UP
Volume - UP ( +17 lks volume high compared with previous day traded volume)
OI - UP (+30 %)
Market - ** will update on trade day**
Trade:
Buy abv - 1147
Target - 1167
Stop Loss - 1130
Reward Points - 20
Risk Points - 17

Dow Jones - Marubozu CandlestickWill Dow Jones witness short term reversal?
*Marubozu Candlestick
* Overbought RSI

Very rare candlestick pattern formed : Short TatasteelTri Star candlestick is an extremely rare pattern . In my 10 years of trading experience i found only one in EOD stock charts nifty stocks allowed in Future. Since it happened to me only once I have no prior experience of its performance however one can short the stock with very small stop loss of the 432.50 on closing basis.

candlestick pattern with flag contrary)Tweezer Bottom
god knows if it will blast on upside than please shorter keep your clothes saved.
such a small stop worth risk taking.
Gratify if you appreciate the practice then you can like it, share it and
If you want me to investigate any chart for you then would cherish doing that for you.
Thank you for your time and support.
Stay safe.

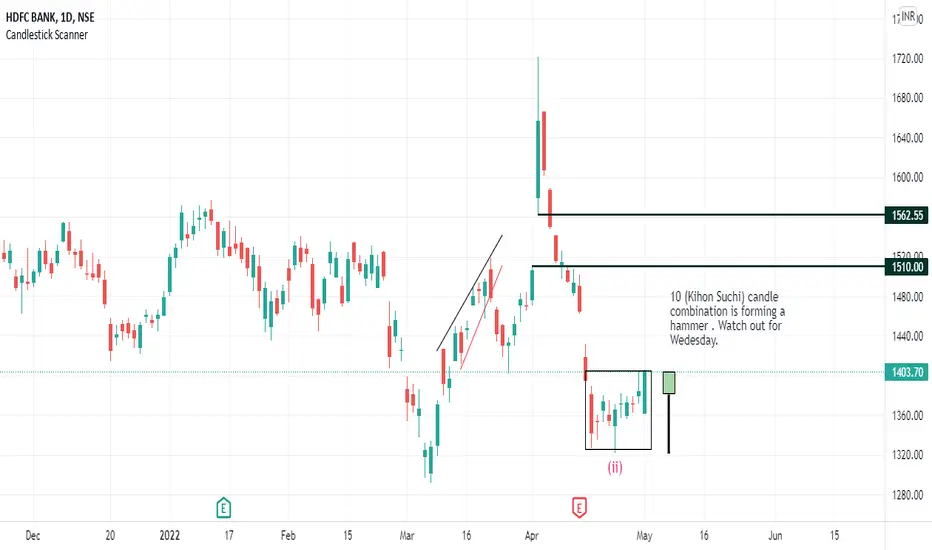
Candlestick combination - Dragon HammerDragon fly doji / Best Hammer .Will it be confirmed on Wednesday . Regards

EDELWEISS FIN SERVE LTD - BUY/LONG TRADEThere is bullish head and shoulder formation on edelweiss fin serve ltd. given breakout on daily time frame with supporting volume . one can look to buy if next candle hold above breakout candle high with mention target and without stoploss as i will update when to exit.

V GUARD - BULLISH ENGULFING PATRON CANDLE FORMED V GUARD LTP - 218.45/-RS
ON DAILY CHART BULLISH ENGULFING CANDLE PATRON FORMED ON 20TH MARCH
BULLISH ENGULFING PATRON -
A bullish engulfing pattern occurs in the candlestick chart of a security when a large white candlestick fully engulfs the smaller black candlestick from the period before. This pattern usually occurs during a down trend and is thought to signal the beginning of a bullish trend in the security.

YES BANK create Shooting StarShooting Star
The Shooting Star candlestick formation is viewed as a bearish reversal candlestick pattern that typically occurs at the top of uptrends.
The Shooting formation is created when the open, low, and close are roughly the same price. Also, there is a long upper shadow, generally defined as at least twice the length of the real body.
When the low and the close are the same, a bearish Shooting Star candlestick is formed and it is considered a stronger formation because the bears were able to reject the bulls completely plus the bears were able to push prices even more by closing below the opening price.
The Shooting Star formation is considered less bearish, but nevertheless bearish when the open and low are roughly the same. The bears were able to counteract the bulls, but were not able to bring the price back to the price at the open.
The long upper shadow of the Shooting Star implies that the market tested to find where resistance and supply was located. When the market found the area of resistance, the highs of the day, bears began to push prices lower, ending the day near the opening price. Thus, the bullish advance upward was rejected by the bears.

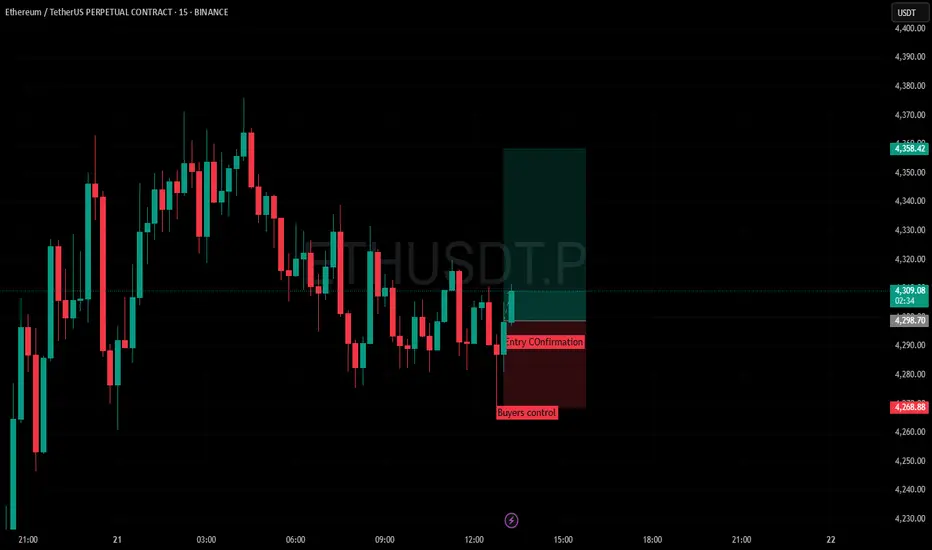
Simple Candlestick pattern Long tradeSimply wait for Buyers control and wait for confirmation candle that gives you volume and strength then entry and target for 1:2
IRFC bullish engulfing: trend reversal.Try paper trading for candlestick patterns.
Buy above 145.00.
Maintain strict stoploss 120
I'm not a sebi registered analyst, just for educational purpose.

Nifty 50 is repeating patternFrom past 5 trading sessions nifty is repeating its candlestick pattern, formed in October 2021. I have copied data from 13 oct to 20 dec 2021. Pasted it on 28 oct 2022. So far it is perfectly telling whether the high or low of the previous day will be broken.

PEL Bullish candlestick pattern formationStong volumes coming onto this counter indicating the presence of some institutional players, bullish volumes seen and a piercing bullish candle pattern.

INDIGO : Hammer Pattern , Positional trade availableIndigo is taking support at 44 EMA , also observing Hammer candlestick which indicate reversal in trend .Buy now and sell at 1800.

Bullish marubuzo at btc zerodha. com/varsity/chapter/single-candlestick-patterns-part-1/
Bascially no matter the price everyone is buying

Shooting star - Bank NiftyShooting star candlestick formation - Bank Nifty
Buy above today's high
Sell below today's low

What is price action Trading ??One of these days i see that retail traders get an advertisement of Price action trading trainer , well most of them even dont know what is going on with in the
Market , i asked many of them to take up Live Trading challenge if they are so sure of the price action trading , Most never replied to my message
but what they are doing is they continue to collect fees form innocent retail to tune of 30000 Per training , and retail after losing the money in stock market they end up
paying the heavy fees yet the success is not even close to their investments
My point is Price action is not candlestick trading , it requires meaningful understanding of trend/ Momentum and the direction of the trend ,
Many time the trend is making an Continuation pattern but the so called these pandits suggest to book profits or go short sell
They even dont know where to begin and where the trend is end ,
Let me tell you what is price action in short message
Its an Movement of price based on market participants interpretation , its theme of moves in trend and counter trend moves , its an indication of progressive moves in the direction of least resistance , overall its an tool that gives you the past data in order to asses future direction ,
its easy to be fooled by these people who try to teach you in the name of price action but they them self dont have a complete knowledge
I love to post about it but it takes lots of time ,
One can Ping me in case you want to know more after Friday i will reply
Goodluck


COAL INDIA - HAMMER REVERSAL CANDLESTICK - LONG POSITIONIf price crosses 225, then go long
Also supported by double bottom in RSI
