Nifty on Daily chart has a chance of 200 ema playUsually 200 ema plays as a strong Support or resistance level, considering where it is positioned from current price levels.
If further downside has to be seen on charts, prices may take a pause or a bounce back from 200 ema on Daily.
Search in ideas for "EMA"

Unilever : Wedge Breakout + Support of EMA 200Earlier Unilever has given the Head & Shoulder breakout and after the breakout, the price moved upward by 10% and retrenched to level of Rs 2440 i.e. that was a H&S neckline & EMA 200 resistance level earlier, now acting as support.
Today's candle given a wedge breakout and price closed above EMA 21, opportunity to enter into trade with risk and reward of 1:2
The entry, target mentioned in chart and stop loss as per R&R ratio.
Thanks
-AJ

50 and 200 EMA crossover in 1 hourHello All,
Please find the related idea below where it breached 39700 level.
We have a triangle pattern forming and 50, 200 EMA crossover. Usually EMA crossover in larger timeframe works effectively if you refer previous crossovers.
Expecting to breach 40400 tomorrow
Always trade carefully with proper SL because it’s your hard earned money.
Please note this is just my observation and purely for educational purposes only. Consult with your financial advisor before taking any trade

Tata Steel: Trading below 200 day EMATata Steel
- stock is trading below 200 day EMA
- trading near 20 day EMA
-gap resistance at 109-114
Given the set up one may consider to sell 27 Oct 2022 expiry 120 Call option currently around 2.3
Profit potential 9-10%.
Be cautious if Tata Steel goes above 110. Exit if closing is above 114 in Spot.
Take care and safe trading...!!!
Disclaimer
- The view expressed here is my personal view
- Past performance is not a guarantee for future predictions
- Use this for educational purpose
- Any decision you take, you need to take responsibility for the same
- It's your hard earned money. Treat it wisely
- Trade / Invest keeping in mind your trading style, goals and objectives, time horizon & risk tolerance
- if trading in F&O, understand that F&O trading involves risk
- Do take proper risk management measures
- Do your own analysis and consult your financial adviser if need be

Weekly Time Frame Analysis
**Near the demand zone or flip zone(5850-6000)
**under 200 ema ( a little bearish zone)But if it take support from demand zone(5700-6000) then there is a higher probability
that it will be above 200 EMA in upcoming weeks.
**2nd time near demand zone( perfect time for add more quantity)That is how you play ur investment.
If you find any doubt, do comment

Powergrid Long opportunityNSE:POWERGRID
Stock -> Powergrid
TimeFrame -> Weekly
Hello all!
Powergrid has been moving in a channel since November 2020. It's now back on its lower channel trendline and has shown a good bounceback, making it a good opportunity to go long!
There are multiple confluences that strengthen my conviction:
-Support from both 50-week EMA and 50-daily EMA.
-Support from 200-day EMA
-Stock trading above its support zone
*NOT A CALL*

Powergrid at major 200 ema support on daily candlePowergrid daily maximum time took support of 200 ema on daily TF
Currently see the false BD of 200 ema level, so can go long with half qty at 209-210 and remaining half qty after TLBO i.e. at 215
Target of 248 and SL is too small i.e. 205

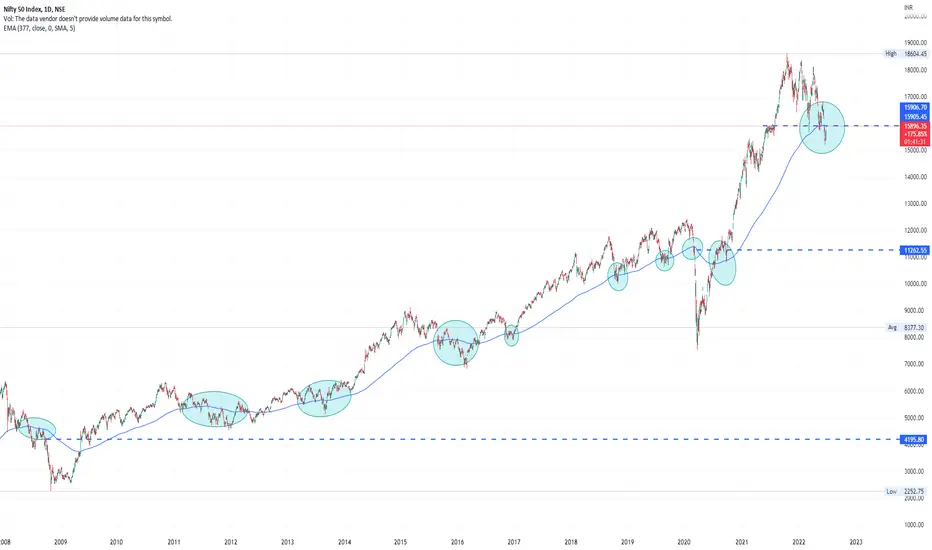
Nifty at 377 EMAHi Everyone
If we look at the daily chart opf Nifty and include 377 EMA then we can see that this is a very strong moving average.
2008 / 2020 crisis happened when this EMA was broken.
Today Nifty is perfectly sitting at this EMA.
It can consolidate or we can now expect a huge fall which has not been witnessed till now. For that it will have to break its previous lows and check my other analysis which tells that Nifty might hit 13000 level by Sep this year.
EURCHF on 4Hr TimeframeEURCHF is consolidating right now in a box. Along with that, it's taking support from the trend line. Our first target is 200 EMA on 1D Time frame, Which would be around 100 pips. If it breaks 200 EMA on 1D, then we can aim for 1.05010 and that would be around 60-70 more pips.

MRF long opportunityNSE:MRF
Stock ->MRF
TimeFrame -> Weekly
Hello all!
MRF has been moving in a channel since June 2016. It came back to its lower trendline in March 2022, bounced back, and is now trading near an important supply zone. If it breaks above the supply zone with good enough volumes, it'll make for a good opportunity to go long.
MRF is already getting support from its 200-week EMA. If it breaks above the supply zone, then there will be multiple factors that will strengthen my conviction to go long:
1) It'll start trading well above the 50-week EMA which is a good sign
2) The nearest swing high will be taken out
*NOT A CALL*
#mrf #swingtrading #ema #technicalanalysis

3 EMA with Visible ANGLEHello Friends, I observed that on lower timeframes, traders find it hard to visualize the angle of Multi plotted EMAs due to fast moving value. To overcome the problem, EMA’s emerging angles have been plotted on the chart by extending the lines to defined points. Further, MTF, Source, Offset points, Deviation by %, Plotting on/off, Repainting on/off, Extension Line on/off options have also been included in the script.
I find it useful, so hopes, it will be useful to others too. Thanks

RSI + EMA Crossover+Adx strategy RSi above 60 EMA 13 >EMA 21 ADX above 20 ADX Positive above Adx Adx Negative below ADX

Key EMAs defend USDCAD bulls ahead of BOC rate-hikeBank of Canada (BOC) is up for the first rate-hike since 2017 but the markets are have already priced in a 0.25% lift to the benchmark rate, which in turn may not entertain the USDCAD bears until forward guidance appears hawkish. Technically, 100-EMA and 200-EMA offer strong supports near 1.2660 and 1.2640 to limit the quote’s short-term downside. If the pair bears conquer the 1.2640 support, a downward trajectory towards the 61.8% Fibonacci retracement of October-December 2021 upside, near 1.2550, can’t be ruled out. However, an upward sloping trend line from October 2021, near 1.2520, will be a tough nut to crack for the sellers afterward.
Alternatively, a disappointment, or negative surprise, from the forward guidance could trigger the quote’s recovery moves towards the mid-December 2021 low near 1.2760. Following that, the 1.2800 threshold and 1.2850 levels may entertain USDCAD bulls before directing them to February’s peak of 1.2877.
Overall, BOC may not please USDCAD bears until doing more than what is already expected. Other than the BOC, OPEC+ meeting and geopolitics also keep the spotlight on the Loonie pair as prices of Canada’s key export WTI crude oil rally of late.

Btc Bullish EMA 200 As resistance Btc Bullish EMA 200 As resistance
In 4hour chart EMA 200 React like a resistance.
if Break This BTC Gone
41000
42000
42500

Strategy : Buy in Dips using Support Zone & EMAIEX is an Indian Company in Power Sector.
Recently after forming a Bearish Bat, Share price fell by almost 20% from 303 to 235
The RSI of the company also reached 30 level - Key level for bounce back
After taking support at its previous low that is the W pattern low 1 at 236- 232 zone ( purple rectangle in chart ),
The share has shown a healthy bounce led by the Bullish Kicker and is trading at 254 now.
If it follows the trend of bouncing from EMA 100, one can look for targets at previous Highs of 300 and 317
In a rising market, EMA is a good tool to catch the Dip if price shows a healthy initial bounce.
Stop loss at 230 that is previous low will warrant a reward risk ratio of 5:2
The share fundamentals are strong and has a PEG Ratio of 1.8.
PEG ratio above 1 is generally considered good.
The EPS of the company has been on a rising trend and can be a good long term pick as well.
Thanks for reading!
I am pretty much self taught in Harmonics, so in case I missed something, let me know in the comments.
Note : This is purely for Educational purposes and not to be considered as an Investment Advice.

SRTRANSFIN BELOW 200-EMA AND SUSTAINING SUMMARY
*stock broke below its head and shoulder pattern neckline
*below the neckline we had 200-ema
*price has started sustaining below 200-ema
*financial expected to remain weak
SRTRANSFIN SPOT INTRADAY
SHORT@1350(BELOW)
STOP@1370
TARGET@1320-1300-1280
NOTE*
*one can trade in future with adjustments
*once in profit and first target is achieved
*trail your trade to short price so it becomes no profit no loss trade
*do not overtrade
*for more index and stock updates check the link in the signature box below
👇👇👇👇👇👇👇👇👇

Reliance Industries : Head & Shoulder + EMA + FIB LevelIf sell off continue , there is shorting opportunity in RIL. The analysis based on following factors and assumption:
a) Trend : Continuous of sell in the market.
b) EMA : 21, 50 and 100 broken in chart daily frame.
c) MACD : Crossover signal selling opportunity.
d) Fibonacci : Level of 0.618 violated
d) Support & Resistance : If crucial support level broken, enter of short trade.
Entry below Rs 2330 , Stop Loss at EMA Rs 2370 and Target mentioned in chart.
Thanks

Technical Analysis: Brent oil fades bounce off 100-day EMAAlthough supply crunch talks trigger Brent oil’s bounce off a two-month low the previous day, the black gold remains pressured towards re-testing the 100-day EMA level amid US push for more output and fresh covid woes from Eurozone. It should be noted, however, that the quote’s weakness past $77.85, comprising the stated EMA, won’t hesitate to challenge the 50% Fibonacci retracement level of August-October upside near $76.00. In a case where the oil sellers keep reins past $76.00, the $73.40 mark comprising the 61.8% Fibonacci retracement will be in focus.
Meanwhile, corrective pullback needs to cross a two-week-old resistance line close to $80.35 to convince the British oil buyers. Also challenging the Brent oil bulls are the levels marked during early November and the monthly high, respectively around $80.85 and $86.00. During the quote’s run-up past $86.00, the multi-month peak marked in October surrounding $86.70 and the $87.00 may offer an intermediate halt during the rally targeting the $90.00 threshold.

SBIN took support at 20 EMA…SBIN took support at 20 EMA…
Reasons/Traits :
• Took support at 0.382 fib retracement level
• Above 20 EMA
• Strong up move, force index 3 is less than 0 and force index 13 is greater than 0
• ADX 20 is greater than ADX 30 as well ADX DI + > ADX DI -
• Force index 3 is greater than 0 and Force index 13 is less than 0
• VWMA is greater than 100
What can happen next :
Scenario 1 : Price sustaining above 492 levels can take it to 500/510/520/530/540 levels (3.618 fib retracement of last high high)
Scenario 2 : Price break down below 490 can take it down to 480/468/452/442/432/425/410 levels
Important levels are mentioned above and it doesn’t mean it will achieve all one by one … price can hover along these prices and due course of time will tell us the price movement between these levels. 468 is important level and breaking it can take the price down or it can bounce back.
Disclaimer : This analysis is only for educational purpose and not be considered as any trading idea/tip. Please consult your financial advisor before you take any trade and we are no way responsible for your profits/losses. Thank you!

Intraday set up 1 - Hindustan UNi EMAs + S/R + Divergence 30 MINS 100 EMA @ 2680
1hr 50 EMA @ 2680
Resistance level at 2680-2670
SELL IF THE ZONE IS RESPECTED WITH SELLING DIVERGENCE CANDLE.
If 2625 is broken with volume, we will see more downside.
The Indicator Used:
1) Support/Resistance Levels are marked on the charts
2) Valuation band
KEYS: Red Faded Cloud: Over Valuation.
Grey Faded Cloud: Proper Valuation.
Green Faded Cloud: Under Valuation.
3) TE-REKAB - Proprietary Indicator
KEYS:
PB: Pullback
Blue Candle: Selling Divergence
Yellow Candle: Buying Divergence
If you like the analysis, do leave a like and follow for more such content coming up.
The analysis is my POV , hope you got bucks in your pocket to consult a financial advisor before investing :P :)
HAPPY TRADING!!!

Previous All Time High Retested & bounce1. Previous All Time High Retested & bounce
2. 50 EMA act as Support in weekly Chart
3. Falling Wedge Pattern
4. Volume Increased
5. Buy Above 760 on End of day closing is Good
Caution : 50 EMA Act as Resistance in Daily Chart

USDCAD bears eye another battle with 100-day EMAUSDCAD drops to the lowest level since September 10 during the six-day downtrend on early Tuesday. The Loonie pair’s failure to stay past the key resistances above 1.2800 joins a downward sloping RSI line to direct USDCAD towards a 100-day EMA level near 1.2540. However, the quote’s further weakness will be challenged by the 50% Fibonacci retracement level near 1.2475 and the late July lows close to 1.2420.
Meanwhile, recovery moves may find multiple upside hurdles around 1.2700, a break of which will enable USDCAD buyers to re-confront the two crucial horizontal resistances near 1.2810 and 1.2830. While the pair bulls are likely to step back from 1.2830, their dominance past the same will not hesitate to challenge the yearly peak surrounding 1.2950. Overall, USDCAD remains bearish but the important EMA support questions the sellers.
