$BTC #BTC Latest Update ( 1DAY ) by CryptoHeroTA$BTC Latest Update 🚨 ( ZOOM - OUT ) 1 DAY
BITSTAMP:BTCUSD
As we mentioned Before when $BTC was at 7000$ that will Go around 9200$ for sure
& We touched Nearly around 9200$ & bears havely dumped it for around 8550$ ( formed Rising Wedge Pattern in 4 hrs )
If not be able to holds above 8600$ than we expected to comer down around 8000$ - 8200$ in any cost for sure before making a huge pump
let’s see & concentrate on our Short & Don't forget to Join us on TG - @CryptoHeroTA ( Search in the search bar on TG)
Regards
CryptoHeroTA ( Admin Stivee)
Search in ideas for "Zoom"


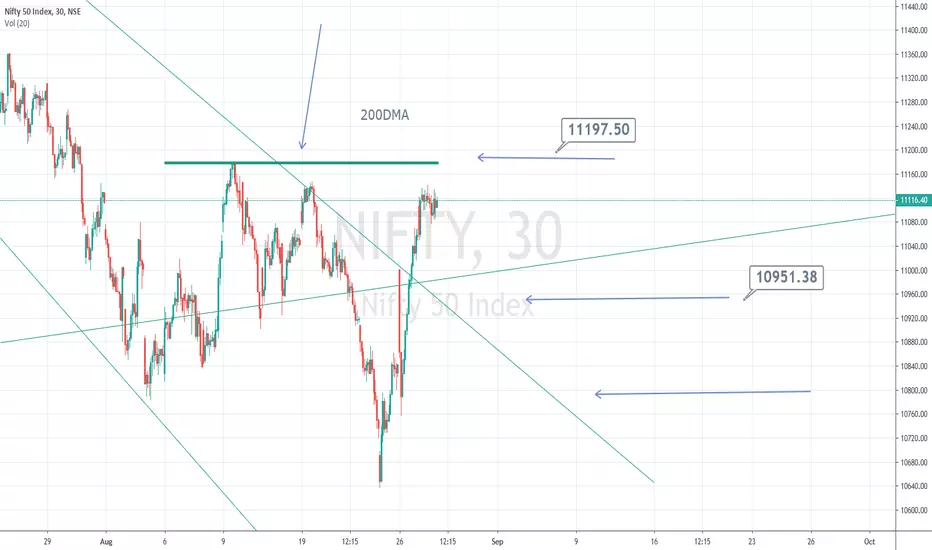
NIFTY FOR 28 AUGUST 2019THIS IS A ZOOM IN INTO A 30 MIN CHART..
SHORTING ONLY:
SHORT WHEN NIFTY TOUCHES 11180..STOP OF 60 POINTS....AND EXPECT IT TO GO TO 10950....
BTC Analysis on 18-07-2019Here is the BTC Update.
BTC was in a channel which got broken with some decent volume. And we saw pump of more than 1200 dollars in one hour.
So i have mentioned some possible resistance and some decent supports on Graph.
10900 dollars seems to be the first actual resistance on 4H followed by 11800 dollars.
Whereas 9700 can give some decent support followed by 9200 area.
BTC dominance is again increasing and its almost around 69%,so stay away from alts.
P.S - There are some groups which are copy pasting our analysis. Just zoom at their graphs and you will know the reality by quality of the graph,
Stay safe from those group.
Cheers!!!

Parabolic SAR Strategy 100% accurate! Zoom OutI am not going to predict what will happen or what is happening... I'll let stats and algorithms show results.
-I am using SAR Parabolic strategy. It automatically recommends long and short entry based on stats.
Here we see a monthly $BTCUSD chart. By using SAR Strategy tool it shows us that It's Long entry (Upwards trend) and Short entry (Downward) trend has been 100% accurate.
On Monthly it only has 2 long entries.
1) First one at $350, that was back in November 2015. After that it hit $19,000 mark in December 2017. That is a 55X return in 2years. No other asset can give this much return in 2years. It also gave short entry in Feb 2018 $10-$11k
2) Second Long entry indication was in June 2019. Around $9000. Lets see how long can we go. Maybe $25K - 100k might actually become a reality in next 2 years?
If you havent invested yet, I would recommend to keep investing some amount whenever you see a crash(15%-20%). And only Invest as much as you are willing to loose.
I am posting Weekly and Daily on my profile, have a look. They are very accurate as well. Give this a like and comment what you have to say.

CUP & HANDLE FORMATION ON WEEKLY CHARTS ABOVE 160 RECLTD WILL ZOOM TO 170 AND AND 180 IS RESISTANCE WE CAN SEE CONSOLIDATION TARGETS BIG WITH STOP LOSS 140 AND PRIMARY TREND IS ALSO BULLISH SO HOLD IN CASH AND BUY IN DIPS FOR LONG TERM ONLY A MARKET CRASH CAN DESTROY THE CHART OTHERWISE THE STOCK IS GOOD TO GO.... MYSELF INVESTED INC ASH SINCE MANY YEARS HAS DIVIDEND PAYOUT IS GOOD..
PLEASE CONSULT FINANCIAL ADVISER...I AM JUST A LEARNER

GRASIM.. strong upmove likely..GRASIM has closed just below the long term downward trendline..above 920 it can zoom to 970 and 1000 in real quick time..
RSI is rising which can aid the upmove... Nifty is holding in higher levels which is a +ve sign.

nifty 50nifty may zoom towards 13000 this month like roket speed and consolidate 13000 mark till 2021

#YESBANK CASH : STRONG SUPPORT 257-260#YESBANK CASH
08 APRIL 2019
STRONG SUPPORT 257-260..
IF HOLDS THEN WILL ZOOM UP TO 280-285 ALSO
STOPLOSS 250-252

#AJANTAPHARMA CASH : MAKE OR BREAK LEVEL IS 1000 IN CASH#AJANTA PHARMA CASH
13 MARCH 2019
MAKE OR BREAK LEVEL 1000
IF ABLE TO HOLD IT WILL ZOOM UP
ELSE WILL C SHARP SELL OFF
CMP 1010

Shriram Transport short , mid term and long term.Doesn't look that good. I have my primary count for Shriram Transport finance doing a WXY down on the weekly frame and its safe to say so as its clearly visible if you zoom out that it completed 5 waves up on the weekly. Although wave structures as big as this don't fulfil their targets 100% but i'll still be keeping my long term targets near INR 2400-2700 ranges , after completion of this large WXY ofc. There's always a possible scenario where it can go for extended correction phase which can then be counted as WXYXZ but i'm not too confident about that , too early to comment on such move down. My primary is WXY as gradually increasing buy volume during the whole movement points towards that.
My short term target for this X up is indicated by that pink line where 5 of C of this larger X ends. Mid term , I'm looking for a Y wave down to 78.6% (INR 300-450 ranges) retracement level of this impulse 1 up on weekly . Taking 5th wave of this hyperwave 1 elongated , we get this target which generally lands around the 4th.
There's another count with elongated 3rd of this larger 1 instead of the elongated 5th, which will then give us our targets around 61.8% (INR 600-700 ranges) retracement level of the whole up movement.
Both the counts are valid down to 99.99% retracement level.
This is not a financial advice and just my view of the market atm . Don't trade on other people's opinions , get on your own and make a plan and trade on them.
Thank You.

Reliance Industries expiry around 1150Since, it has tested its support at 1100 and have zoom passed 1120 levels, next resistance is @ 1132 and crossed that it can move quickly to 1150 level. The level of 1150 is expected by Thursday expiry.
My trading strategy - Buy two calls of 1140 priced currently around 4.20 with lot size of 500 each. Total investment 4200 with expiry date of Nov 29, 2018. Expiry price 1150 the call value will reach 10. This will result in profit of 6000 which is return of more than 100%. Stop loss 2 which means loss of 2100. The risk reward ratio is 1:3. Quite a profitable trade go for this.

L&T FH : This Stock in such dreaded sector looks decent. immediate resistance around 136-140 ! once taken , it can zoom towards the circle.
good support around blue line. a stock worth looking at.

GOT REKT ?! When confused simply Zoom Out , XBTUSD Long LONG : 4600-4700
TARGET 1 : 5800 (TAKE PROFIT 60%)
TARGET 2 : 6400 (TAKE PROFIT 40%)
Just observe the chart for pictorial representation .

Nifty 50 Elliot Wave Theory Detailed Study And PredictionAnalysis and detailed study of corrective Wave B on Weekly chart. Please refer weekly chart Elliot Wave counting from my ideas posted 2 days ago or from the below link.
The above analysis is done in 180 min chart. Details already mentioned on the chart. Zoom in/out to see the clear analysis.
This is a breakdown of wave B to complete the same wave and to start Wave C. This will help you to take off position and or re-enter a upmove.
PLEASE NOTE, each wave of each degree is counted with relation to Fibonacci numbers, trend line and horizontal SAR. All the rules/guidelines of EWT are followed for the analysis. The waves may or may not show exact movement as predicted. Please be cautious while taking a position. Always analysis using multiple time frame before taking a position.
Any suggestion/feedback/criticism/healthy debate are welcome. Appreciation, support and few likes are most welcome. :)

Powergrid BullishPowergrid is at few month old resistance, and broke out of downward sloping trend line which wasn't a great signal though. But it broke out with the confirmation of Gartley Pattern.
Price has kind of retested the support and it is now signalling upward move.
If we zoom into 15 min chart we'll see that price may come down to retest the support again and that would even be a more better place to get in.
For now, on the hourly chart we can see the series of Indecision candles, A break above them, will be a good signal to buy and break below them will signal us to wait, but even if we don't wait and get in right now, we have a good Reward to risk Ratio.
Sl: Below 186.4
Target 1: 191.4
Target 2: 192.5

BITCOIN - LONG TERM CHANNEL STILL IN PLAYThis is my first chart, please be gentle!
In the chart above I have tried to show how all past cycles have have played out in very similar and (hopefully) predicable patterns.
When you zoom right out to the 1 month candles and look at the whole picture from 2011 to 2018 things look a lot more positive. The price is still sitting within a long term channel and I've drawn some ellipses to highlight previous market cycles and the patterns they form. The longer I'm in this game the more I realise that the patterns that form over the longer timeframes are not shaped by any individual news events, rather it would appear that the news cycle is following the long term price pattern - the cart is pulling the horse.
The final ellipse I have drawn covering 2018 - 2019 is only in play if we have found the bottom which is still not confirmed. If a break down does occur and bitcoin price moves under $6k then I will have to adjust the length and depth of the ellipse but if the chart above plays out and we are currently on the bottom then I would expect a return to the all time highs of $20k by September 2019 and at that point the beginning of a new bull run/hype cycle up to around $100k - $150k.
This is my first attempt at technical analysis so constructive feedback would be appreciated!

Powergrid BullishPowergrid 1.48% is at few month old resistance, and broke out of downward sloping trend line which wasn't a great signal though. But it broke out with the confirmation of Gartley Pattern .
Price has kind of retested the support and it is now signalling upward move.
If we zoom into 15 min chart we'll see that price may come down to retest the support again and that would even be a more better place to get in.
For now, on the hourly chart we can see the series of Indecision candles, A break above them, will be a good signal to buy and break below them will signal us to wait, but even if we don't wait and get in right now, we have a good Reward to risk Ratio.
Sl: Below 186.4
Target 1: 191.4
Target 2: 192.5

Ultratech LONGultratech cement made narrow range 4 as well as narrow range 7 with insider candle on daily chart as well.Also we can see that there is flag pattern on daily chart so Above 3800 it can zoom to 4100 level with stop of 3700..

#RELIANCE CASH : SUPPORT AT 1225-1230 #RELIANCE CASH
04 SEPT 2018
LOOKS AT GOOD SUPPORT 1224-1230
IF HOLDS WILL ZOOM UP
GOOD ABOVE 1260 CLOSE FOR 1290-1300
(RISK FREE ABOVE 1300 CLOSE FOR 1325-1350-1400)
CMP 1242

Cup and Handle shape will serve you nice tea.Typical Cup and handle shape formed after
good consolidation stock ready to zoom on upside.
good risk and reward ratio.

