Search in ideas for "macd"

MACD CROSSOVER - Double Digit Stock - SARLAPOLY📊 Script: SARLAPOLY
📊 Sector: Textiles
📊 Industry: Textiles - Spinning - Synthetic / Blended
Key highlights: 💡⚡
📈 Script is trading at upper band of BB and giving breakout of it.
📈 MACD is giving crossover .
📈 Right now RSI is around 67.
📈 One can go for Swing Trade.
⏱️ C.M.P 📑💰- 98.50
🟢 Target 🎯🏆 - 111
⚠️ Stoploss ☠️🚫 - 92
⚠️ Important: Always maintain your Risk & Reward Ratio.
✅Like and follow to never miss a new idea!✅
Disclaimer: I am not SEBI Registered Advisor. My posts are purely for training and educational purposes.
Eat🍜 Sleep😴 TradingView📈 Repeat 🔁
Happy learning with trading. Cheers!🥂

MACD Crossover - MTARTECH📊 Script: MTARTECH
📊 Sector: Aerospace & Defense
📊 Industry: Engineering
Key highlights: 💡⚡
📈 Script is trading at middle band of BB.
📈 MACD is giving crossover.
📈 Script may fill the gap.
📈 Right now RSI is around 50.
📈 One can go for Swing Trade.
⏱️ C.M.P 📑💰- 1911
🟢 Target 🎯🏆 - 2071
⚠️ Stoploss ☠️🚫 - 1828
⚠️ Important: Always maintain your Risk & Reward Ratio.
✅Like and follow to never miss a new idea!✅
Disclaimer: I am not SEBI Registered Advisor. My posts are purely for training and educational purposes.
Eat🍜 Sleep😴 TradingView📈 Repeat 🔁
Happy learning with trading. Cheers!🥂

MACD Crossover - BIOCON📊 Script: BIOCON
📊 Sector: Pharmaceuticals
📊 Industry: Pharmaceuticals - Indian - Bulk Drugs
Key highlights: 💡⚡
📈 Script is trading at upper band of BB.
📈 MACD is giving crossover .
📈 Already Crossover in Double Moving Averages.
📈 Right now RSI is around 66.
📈 One can go for Swing Trade.
⏱️ C.M.P 📑💰- 323
🟢 Target 🎯🏆 - 350
⚠️ Stoploss ☠️🚫 - 311
⚠️ Important: Always maintain your Risk & Reward Ratio.
✅Like and follow to never miss a new idea!✅
Disclaimer: I am not SEBI Registered Advisor. My posts are purely for training and educational purposes.
Eat🍜 Sleep😴 TradingView📈 Repeat 🔁
Happy learning with trading. Cheers!🥂

MACD Crossover - INDIGO📊 Script: INDIGO
📊 Sector: Air Transport Service
📊 Industry: Transport - Airlines
Key highlights: 💡⚡
📈 Script is trading near upper band of BB.
📈 MACD is giving crossover .
📈 Already Crossover in Double Moving Averages.
📈 Right now RSI is around 62.
📈 One can go for Swing Trade.
⏱️ C.M.P 📑💰- 3179
🟢 Target 🎯🏆 - 3385
⚠️ Stoploss ☠️🚫 - 3072
⚠️ Important: Always maintain your Risk & Reward Ratio.
✅Like and follow to never miss a new idea!✅
Disclaimer: I am not SEBI Registered Advisor. My posts are purely for training and educational purposes.
Eat🍜 Sleep😴 TradingView📈 Repeat 🔁
Happy learning with trading. Cheers!🥂

MACD Crossover - HINDCOPPER📊 Script: HINDCOPPER
📊 Sector: Non Ferrous Metals
📊 Industry: Mining / Minerals / Metals
Key highlights: 💡⚡
📈 Script is trading near at middle band of BB.
📈 MACD is giving crossover .
📈 Double Moving Averages will give crossover.
📈 Right now RSI is around 59.
📈 One can go for Swing Trade.
⏱️ C.M.P 📑💰- 281
🟢 Target 🎯🏆 - 306
⚠️ Stoploss ☠️🚫 - 269
⚠️ Important: Always maintain your Risk & Reward Ratio.
✅Like and follow to never miss a new idea!✅
Disclaimer: I am not SEBI Registered Advisor. My posts are purely for training and educational purposes.
Eat🍜 Sleep😴 TradingView📈 Repeat 🔁
Happy learning with trading. Cheers!🥂

MACD Crossover - SUNTECK📊 Script: SUNTECK
📊 Sector: Realty
📊 Industry: Construction
Key highlights: 💡⚡
📈 Script is trading at upper band of BB.
📈 MACD is giving crossover .
📈 Double Moving Averages giving crossover.
📈 Right now RSI is around 61.
📈 There is Formation of Symmetrical Triangle breakout soon.
📈 One can go for Swing Trade.
⏱️ C.M.P 📑💰- 483
🟢 Target 🎯🏆 - 532
⚠️ Stoploss ☠️🚫 - 462
⚠️ Important: Always maintain your Risk & Reward Ratio.
✅Like and follow to never miss a new idea!✅
Disclaimer: I am not SEBI Registered Advisor. My posts are purely for training and educational purposes.
Eat🍜 Sleep😴 TradingView📈 Repeat 🔁
Happy learning with trading. Cheers!🥂

#CARBORUNIV #CARBORUNDUM MACD Bullish Divergence tgt 870
MACD Bullish Divergence
buy/hold for target 822/870
stop loss 750

MACD bullish crossover in CUMMINSIND CUMMINSIND trading in downtrend channel since last 1 month trading session. Yesterday it reached near the resistance level of downtrend channel in same its also shows MACD bullish crossover. This indicates that more chances it will give breakout of this downtrend channel and give projected target upto 935+.


MACD , RSI ,BB BREAKOUTNSE:HINDALCO It gives good idea to buy. tomorrow MACD crosses SIGNAL line and RSI is above 60. As well as it breaks the bollinger band with big green candle .


ABFRL - Understanding MACD for buying and sellingMoving Average Convergence Divergence (MACD) is a technical indicator that helps investors identify price trends and potential trade reversals. It's calculated by subtracting a security's 26-day exponential moving average (EMA) from its 12-day EMA
Components of MACD:
- MACD Line - the fastest moving average (short-term EMA) : Blue line
- Signal Line - the slowest moving average (long-term EMA) : Orange line
- MACD Histogram - swings above and below a zero line, allowing bullish and bearish momentum readings to be distinguished.
- Dashed line is Zero line
From the above chart we can see:
1) On 28-03-2024 blue line crossed orange line below the zero line indicating trend reversal from bearish to bullish
2) On 22-04-2024 blue line was just above orange line and both are above zero line indicating bullish momentum
3) On 20-06-2024 blue line crossing orange line from above indicating end of bullish momentum
Price on 22-04-2024 : 231
Price on 20-06-2024 : 333
It gave 44% returns in less than 2 month
Please do hit like if you learnt from this post.

Exide- Positive MACD crossover & EMA Crossover expectedOn daily chart MACD is about to make positive cross over & EMAs are also likely to do so. Watch it.

Nifty: Price Action Macd Strategy: RevisitedFree stuff -- something which we ignore in haste. Unfortunately, whatever education I have been doling out is absolutely free. So please bear with me.
Rules:
-------
Only Long trades when price > 55 EMA
Only short trades when price < 55 EMA
-------------------------------------------------------------------------------------------------------------------------------
Time Frame 1H
-------------------------------------------------------------------------------------------------------------------------------
Long Entry Preconditions:
a) Price above 55 EMA
b) MACD histogram above zero line
--Positive Divergence seen on MACD signal line (a complementary condition for High probability Entries)
Long Entry Trigger:
Price break above Significant peak fractal of previous downwave OR the break above prior peak fractal high.
Exit Strategy or Stop:
Type 1 Exit
Precondition: Negative Divergence seen on MACD signal line; and
Trigger: Break below a consolidation level or the prior minor swing low
Type 2 Exit
Hourly close below 55 EMA
Exit type I or type II whichever comes earlier
-----------------------------------------------------------------------------------------------------------------------------
Short Entry Preconditions:
a) Price below 55 EMA
b) MACD histogram below zero line
--Negative Divergence seen on MACD signal line (a complementary condition for High probability Entries)
Short Entry Trigger:
Price break below Significant fractal of previous upwave OR the break below prior swing fractal low.
Exit Strategy or Stop:
Type 1 Exit
Precondition: Positive Divergence seen on MACD signal line; and
Trigger: Break above a consolidation level or the prior minor swing high
Type 2 Exit
Hourly close above 55 EMA
Exit type I or type II whichever comes earlier
------------------------------------------------------------------------------------------------------------------------------------
# If trade exited but price shoots back piercing out of 55 EMA or is already above/below 55 EMA , a break of previous peak fractal with MACD histogram above/below zero line triggers entry again.
# Exit Strategy discussed above works well in long trades but chops in short trades. Tweaking a little by taking 1:1 or smaller targets (to previous support zones) instead of the Exit strategy may help in this issue.
Backtesting 10/2017 to 2/2018:
--------------------------------------
9896/10413 = +517
*10331/10255 = +76
*10254/10130 = +124
10344/10355 = +11
*10211/10130 = +81
*10095/10148 = -53
10323/10210 = -113
*10210/10255 = -45
10374/10469 = +95
*10409/10504 = -95
10504/11009 = +505
*10878/10781 = +97
*10511/10411 = +100
*10379/10330 = +49
10475/10478 = +3
Profit points = +1352
What I have noticed is that this strategy works very well in a trending market. It help to ride the trend to this full potential.
On short trades, we have to take profits at previous supports or else it will chop the profits. May be this is because we have been in a bull market.
I sideways market there are hits and misses.
I will try to further fine tune but keep in mind that no strategy works all the time, as visible from backtesting results.
Do hit the like button for appreciation.
Regards
Bravetotrade

Intra Day - Analysis - Bitcoin - MACDHi,
This chart with help from Macd , one is 15 mins Macd and the other is 1 Hour Macd.
1 Hour Macd is above Zero line & hence we will look out for Buy only.
Currently the price is above Pivot Level.
And the 15 mins chart will give a clue along with EMA when to go Long.

KEI INDUSTRIES LTD. reversal in MACD.This stock shows a reversal in price as well as MACD.
Buy at 4635-4650.
1st Target- 5048
2nd Target- 5355
3rd Target- Exit immediately after price touches the upper trend-line.
Exit as per the trader's risk appetite. However, 3rd target is only for the risky traders.
Note:- This is only for educational purpose and not a recommendation.

NIfty showing Bullish Divergence wrt RSI & MACD. Trend reversal?BUllish divergence on Nifty w.r.t RSI and MACD.
Double divergence gives strength to it.
Short term bullish reversal can play out here.

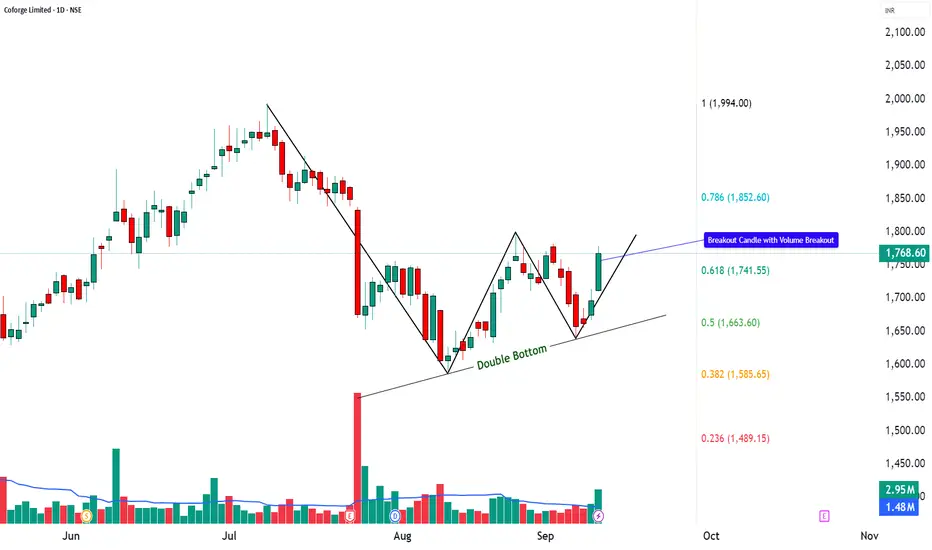
Coforge | Double Bottom Reversal with RSI + MACD Breakout📌 Coforge Ltd. – Closing Price: ₹1,768.60
📊 Technical Indicators Explained
Coforge is showing strong technical signals. A Double Bottom pattern 📉➡️📈 suggests a possible bullish reversal, while a strong bullish candle 🔥 confirms momentum. The RSI breakout ⚡, MACD crossover 📊, and volume surge 🚀 all indicate growing trader participation. With supports holding firm and resistances nearby, the stock is entering a decisive zone.
________________________________________
📈 Bullish Case – Why the stock could go up
Double Bottom signals potential trend reversal.
Strong bullish candle with volume validates buying interest.
RSI breakout + MACD crossover = bullish confirmation.
Fibonacci retracement levels open upside zones towards ₹1,852 – ₹1,994+.
📉 Bearish Case – Potential downside risks
If price fails to sustain above ₹1,726, weakness may return.
Broader market corrections could weigh on momentum.
A breakdown below ₹1,657 would weaken the bullish outlook.
⚡ Momentum Case – Short-term Trading Edge
Strong bullish candle + RSI breakout = near-term strength.
Sustaining above ₹1,780–₹1,800 could push towards higher Fibonacci levels.
Heavy volume indicates short-term traders are active.
📊 Support & Resistance Levels
Support Zones: ₹1,657 | ₹1,683.67 | ₹1,726.13
Resistance Zones: ₹1,794.93 | ₹1,821.27 | ₹1,863.73
📅 Short-term vs. Long-term Perspective
Short-term: Stock may test resistance levels between ₹1,795 – ₹1,860 if momentum sustains.
Long-term: Formation of a double bottom indicates potential for a structural trend reversal if higher levels hold.
✅ Conclusion: Coforge is showing a technical reversal pattern with strong momentum signals.
👉 The stock is at a key breakout zone — short-term traders may track resistances closely, while long-term investors can monitor the double bottom for confirmation of sustained trend change.
⚠️ Disclaimer – Please Read Carefully
The information shared here is meant purely for learning and awareness. It is not a buy or sell recommendation and should not be taken as investment advice. I am not a SEBI-registered investment advisor, and all views expressed are based on personal study, chart patterns, and publicly available market data.
Trading — whether in stocks or options — carries risk. Markets can move unexpectedly, and losses can sometimes exceed the money you have invested. Past performance or past setups do not guarantee future results.
If you are a beginner, treat this as a guide to understand how the market works — practice on paper trades before risking real money. If you are experienced, always assess your own risk, position sizing, and strategy suitability before entering trades.
Consult a SEBI-registered financial advisor before making any real trading decision. By engaging with this content, you acknowledge full responsibility for your trades and investments.
💬 Found this useful?
🔼 Give this post a Boost to help more traders discover clean, structured learning.
✍️ Drop your thoughts, questions, or setups in the comments — let’s grow together!
🔁 Share with fellow traders and beginners to spread awareness.
👉 “If you liked this breakdown, follow for more clean, structured setups with discipline at the core.”
🚀 Stay Calm. Stay Clean. Trade With Patience.
Trade Smart | Learn Zones | Be Self-Reliant 📊
Torrent Power MACD crossoverThe price has given a reversal signal from the lower trendline of the channel with MACD Crossover Above Signal Line. Below are some possitive points for a possible bullish move:
=> There is a strong momentum as price is above short, medium and long term moving average(MA).
=> There is a strong growth in QoQ EPS in recent results.
=> Good quarterly growth in the recent results.
=> Growth in Net Profit with increasing Profit Margin (QoQ)
=> Increasing profits every quarter for the past 2 quarters.
Buy between 1763-1800.
Target 1- 1911, Target 2- 1990 and T3- 2090
SL- 1690. Safe traders can exit on Target 2.
Note- This is not a recommendation but only for educational purpose.

Moving Averages + MACD Crossover - DEVYANI📊 Script: DEVYANI
📊 Sector: Quick Service Restaurant
📊 Industry: Hotels
Key highlights: 💡⚡
📈 Script is trading at upper band of BB and giving Breakout of it.
📈 MACD is giving crossover .
📈 Double Moving Averages are giving crossover.
📈 Right now RSI is around 70.
📈 One can go for Swing Trade.
⏱️ C.M.P 📑💰- 170
🟢 Target 🎯🏆 - 191
⚠️ Stoploss ☠️🚫 - 160
⚠️ Important: Always maintain your Risk & Reward Ratio.
✅Like and follow to never miss a new idea!✅
Disclaimer: I am not SEBI Registered Advisor. My posts are purely for training and educational purposes.
Eat🍜 Sleep😴 TradingView📈 Repeat 🔁
Happy learning with trading. Cheers!🥂

Thomas Cook India Ltd - Double Digit + MACD Crossover📊 Script: THOMASCOOK (THOMAS COOK (INDIA) LIMITED)
📊 Nifty50 Stock: NO
📊 Sectoral Index: NIFTY 500
📊 Sector: Consumer Services
📊 Industry: Tour Travel Related Services
Key highlights: 💡⚡
📈 Script is trading at upper band of Bollinger Bands (BB) and giving breakout of it.
📈 MACD is giving crossover.
📈 Double Moving Averages may give crossover in next trading session.
📈 Volume is increasing along with price which is volume breakout.
📈 Current RSI is around 67.
📈 One can go for Swing Trade.
⏱️ C.M.P 📑💰- 81
🟢 Target 🎯🏆 - 91
⚠️ Stoploss ☠️🚫 - 75
⚠️ Important: Always maintain your Risk & Reward Ratio.
⚠️ Purely technical based pick.
✅Like and follow to never miss a new idea!✅
Disclaimer: I am not SEBI Registered Advisor. My posts are purely for training and educational purposes.
Eat🍜 Sleep😴 TradingView📈 Repeat🔁
Happy learning with trading. Cheers!🥂
