L&T on 1W TimeframeStuck in zone for quit a while, now looks like it may show good momentum in upcoming weeks.
Disclaimer: This is just an a price action analysis of stock Tata Motors. Don't consider this as an stock tip or advice. Invest/Trade at your own risk.
Support and Resistance

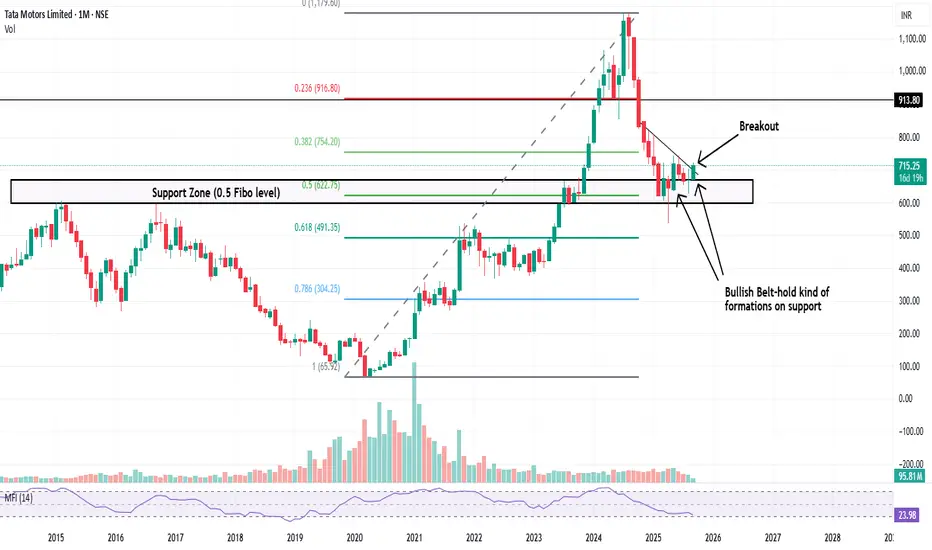
Bullish Setup in Tata Motors on 1M TFHello Everyone,
Here I have analysed the Tata Motors chart and it looks bullish for long term.
It has took Support on previous strong support.
And that zone is also 0.50 fibonacci level which is an healthly retracement considered in price action analysis.
Stock has also given breakout recently which looks good on 1W Timeframe.
So this stock looks good on 1M and 1W TF, hence this can be considered as bullish setup.
Disclaimer: This is just an a price action analysis of stock Tata Motors. Don't consider this as an stock tip or advice. Invest/Trade at your own risk.
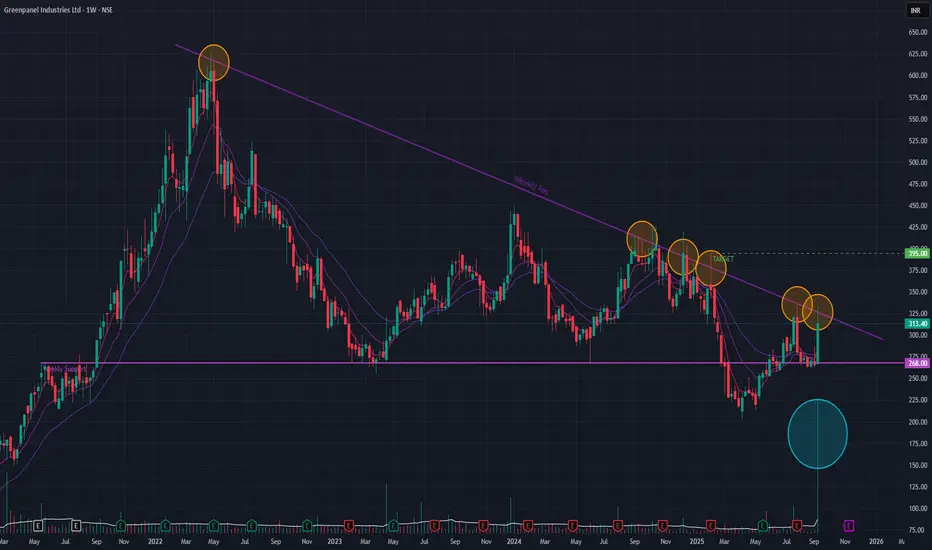
Greenpanel Ind (Weekly Timeframe) - Can it Breakout??After a prolonged downtrend since its peak in April 2022, Greenpanel is exhibiting noteworthy behavior. The stock has repeatedly faced rejection at a critical long-term angular trendline, a key resistance level. However, this past week marked a significant departure from that pattern, with the stock climbing +17.86% accompanied by a massive surge in volume.
This powerful move indicates strong accumulation and a potential exhaustion of sellers. Should the buying interest persist, a realistic near-term objective for Greenpanel would be the ₹395 price level.
Watchout for the price-action !!
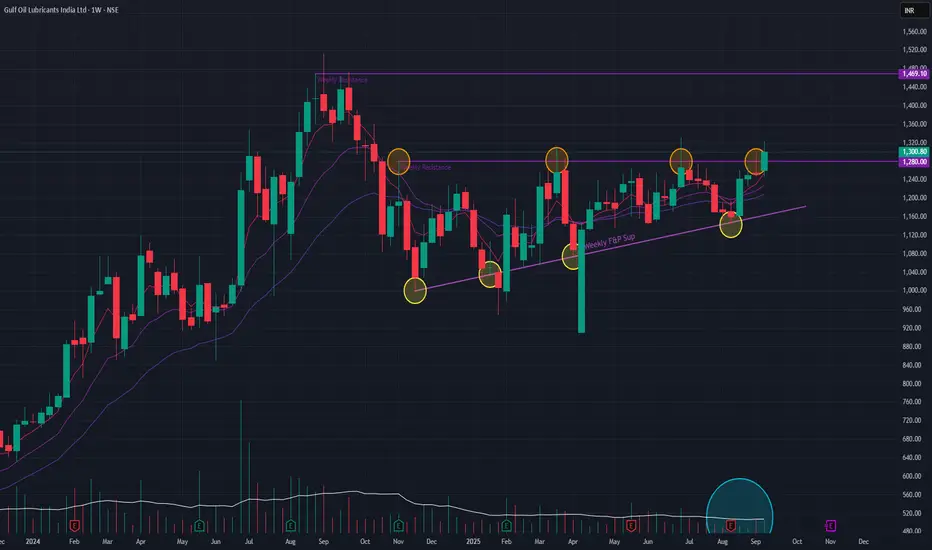
Gulf Oil (Weekly Timeframe) - Potential BreakOut & ContinuationTechnical analysis of Gulf Oil reveals a promising setup. The stock has formed a classic triangle pattern , indicating a period of consolidation before a likely continuation of its preceding uptrend. This week, we've observed a significant breakout attempt, which is notable as it follows multiple rejections from the pattern's upper trendline.
For this breakout to be considered valid, it must be accompanied by a surge in trading volume , confirming buyer conviction. If these conditions are met, the stock could challenge its all-time high of ₹1469 . Further reinforcing this positive sentiment, the short-term EMAs are in a bullish configuration, signaling that momentum is currently in favor of an upward move.
Mazagaon Dock Cmp 2925 Rectangle BOMazagaon Dock Cmp 2925 dated 12-9-2025
1. Rectangle BO done @ 2910
2. Rise in Volume
Buy above 2930 SL 2840 target 2950-2970-2985-
3000-3025-3040-3065-3095-3125-3140-3175-3200-
3225
It is just a view, please trade at your own risk.

BAJAJ AUTOLiquidity Sweeps (Highlighted Circles)
Multiple highs were created earlier, which acted as liquidity pools. These were swept before price reversed lower, showing institutional activity.
This suggests smart money collected liquidity before pushing the price down.
Monthly FVG (Fair Value Gap) Discount Zone
Around ₹6,800 – ₹7,600, this is a major higher-timeframe support zone.
Price previously reacted strongly from this area (sharp bullish move after March-April 2025), confirming demand.
Weekly FVG (Fair Value Gap)
Around ₹11,000 – ₹11,400, this is a strong supply zone where price may eventually gravitate if bullish momentum sustains.
But currently, price is still far below this zoneTrading View
Bullish Case
If price holds above ₹8,200 – ₹8,400, buyers could step in again.
Upside targets:
Short-term: ₹9,600 (previous swing high).
Medium-term: ₹10,122 (marked resistance level).
Long-term: Potential move towards weekly FVG zone ~₹11,000+.
Bearish Case
If price breaks below ₹8,200, weakness may extend.
Downside targets:
First: ₹8,000 – ₹7,800.
Stronger support: Monthly FVG discount zone ₹7,600 – ₹6,800.

BANKNIFTY: POSSIBILITY OF RISING WEDGE BREAK DOWN• BN have formed a lower low on higher time timeframe
• There are multiple fundamental good news (GST + Strong global market) hits the market, but the upside is limited
• A clear rising wedge has formed in BN in lower timeframe
• Market is halted near day candle EMA 21.
• Any breakdown of wedge in hour candle could trigger a massive down move.
• T1 : 53500 and T2: 52086
• T1 is tested multiple time hence the support is weak and chance of breakdown of T1 is extremely high.
• Opportunity to short below bottom trendline of the wedge at closer of 1 hour candle below 54656 keeping sl above the candle.
• A possible 1: 9.1 RR.
• Educational purpose only. Enjoy the market.

Sensex - Expiry day analysis Sep 11Today's price moved in a descending channel pattern, and the range was small. Trend direction deciding level is 81500.
Buy above 81520 with the stop loss of 81400 for the targets 81600, 81720, 81800, 81920, 82040, and 82200.
Sell below 81260 with the stop loss of 81380 for the targets 81180, 81060, 80980, 80860 and 80720.
The daily chart shows the price is at the trendline resistance. It can make the price volatile.
Always do your analysis before taking any trade.

XAUUSD | FED leaning toward 50bps cut? | Buy strategy at support🟡 XAU/USD – 12/09 | Captain Vincent ⚓
🔎 Captain’s Log – Market Context
The probability of a FED -50bps cut next week has risen to 10.9% (from 8%), while a -25bps scenario is almost certain.
US jobless claims rose sharply → reflecting a weakening labor market, reinforcing expectations of FED easing.
Tonight (21:00): release of Consumer Sentiment & 1Y–5Y Inflation Outlook (University of Michigan) – data that could further impact the Dollar.
⏩ Captain’s Summary: Dollar weakness + falling bond yields = Gold remains supported to rise. However, short-term pullbacks may appear before breaking higher levels.
📈 Captain’s Chart – Technical Analysis
Storm Breaker (Resistance / Sell Zone):
Weak High: 3675 – 3677 (psychological barrier)
Peak Zone: 3676 – 3680 (high test, short-term reversal risk)
Golden Harbor (Support / Buy Zone):
FVG: 3603 – 3601
Deep Harbor: 3621 – 3623
Price Structure:
On H1, Gold has repeatedly formed BoS and Equal High (EqH) around 3645 – 3650.
An FVG appears → sign that price may need to fill the liquidity gap before continuing.
Priority scenario: Pullback to 3636 or deeper 3621, then rebound towards 3675 – 3680.
If 3680 breaks successfully → opens the way for new ATH above 3700.
🎯 Captain’s Map – Trading Plan
✅ Buy (trend-follow priority)
Buy FVG: 3601 – 3603 | SL: 3591 | TP: 3605 – 3610 – 3615 – 3620 – 36xx
Buy Zone: 3621 – 3623 | SL: 3612 | TP: 3640 – 3655 – 3665 – 3675 – 368x
⚡ Sell (short-term scalp at resistance)
Sell Zone: 3675 – 3680 | SL: 3684 | TP: 3665 – 3655 – 3645 – 36xx
⚓ Captain’s Note
“The dovish wind from the FED continues to push the golden sails forward. Golden Harbor 🏝️ (3636 – 3621) is the safe docking zone for sailors to gather strength before the new voyage. Storm Breaker 🌊 (3675 – 3680) may create big waves for short Quick Boarding 🚤 , but the main course is still heading North. If the 3680 wave breaks, the golden ship will extend its journey to new peaks above 3700.”

Trading Analysis for Gold Spot / U.S. Dollar (15-Minute Chart)Sorry I am late in giving the signal but I will say that manipulation in XAU/USD is at extreme level. Keep portfolio at least $1000.
Take buy position in XAU/USD as much as possible.
Not more than $3630.00.
Target 1 3353.00
Target 2 3358.00
Target 3 3365.00
Target 4 3372.00
SL 3630.00
Based on the provided 15-minute chart for Gold Spot / U.S. Dollar (XAU/USD), published by NaviPips on TradingView.com on June 30, 2025, at 17:53 UTC, here’s a suggested trading setup for a buy position:
Current Price and Trend: The current price is 3,241.875, with a slight increase of +0.250 (+0.01%). The chart shows a recent downtrend that appears to be stabilizing near the current level, suggesting a potential reversal point.
Buy Entry: Enter a buy position at 3,312.875 (current price), as it aligns with a support zone where the price has found a base, indicated by the horizontal dashed line and recent consolidation.
Stop Loss: Place a stop loss at 3,295.250, below the recent low, to protect against further downside. This level is approximately 10.625 points below the entry, defining the risk.
Take Profit Levels:
Take Profit 1: 3,317.875, a conservative target about 20.000 points above the entry, aligning with a minor resistance zone.
Take Profit 2: 3,324.750, a mid-range target approximately 31.875 points above the entry.
Take Profit 3: 3,332.500, a deeper target about 45.625 points above the entry, indicating a potential trend reversal.
Price Action: The chart indicates a downtrend with a possible bottoming pattern near the current level. The support zone and upward candlestick suggest a buy opportunity if the price holds.
Risk-Reward Ratio: The distance to the stop loss (10.625 points) compared to the take profit levels (20.000 to 45.625 points) offers a favorable risk-reward ratio, ranging from approximately 1:1.9 to 1:4.3.
Conclusion
Enter a buy at 3,241.875, with a stop loss at 3,295.250 and take profit levels at 3,317.875, 3,324.750, and 3,332.500. Monitor the price action for confirmation of an upward move, and be cautious of a potential continued downtrend if the price breaks below the stop loss level. (Note: I assume "take profot" was a typo for "take profit" and have corrected it accordingly.)

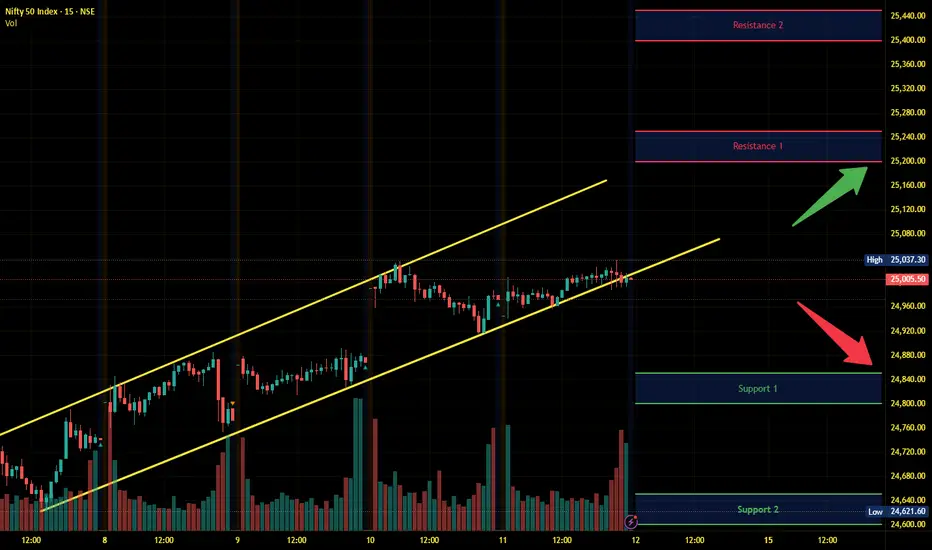
Nifty Intraday Analysis for 12th September 2025NSE:NIFTY
Index has resistance near 25200 – 25250 range and if index crosses and sustains above this level then may reach near 25400 – 25450 range.
Nifty has immediate support near 24850 – 24800 range and if this support is broken then index may tank near 24650 – 24600 range.
Banknifty Intraday Analysis for 12th September 2025NSE:BANKNIFTY
Index has resistance near 55100 – 55200 range and if index crosses and sustains above this level then may reach near 55600– 55700 range.
Banknifty has immediate support near 54200 - 54100 range and if this support is broken then index may tank near 53700 - 53600 range.

Finnifty Intraday Analysis for 12th September 2025NSE:CNXFINANCE
Index has resistance near 26350 - 26400 range and if index crosses and sustains above this level then may reach near 26550 - 26600 range.
Finnifty has immediate support near 26000 – 25950 range and if this support is broken then index may tank near 25800 – 25750 range.

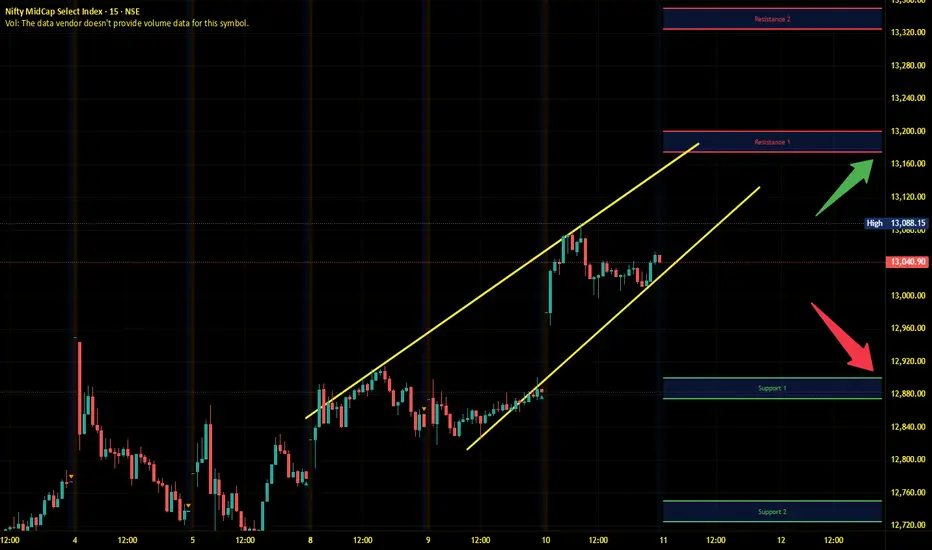
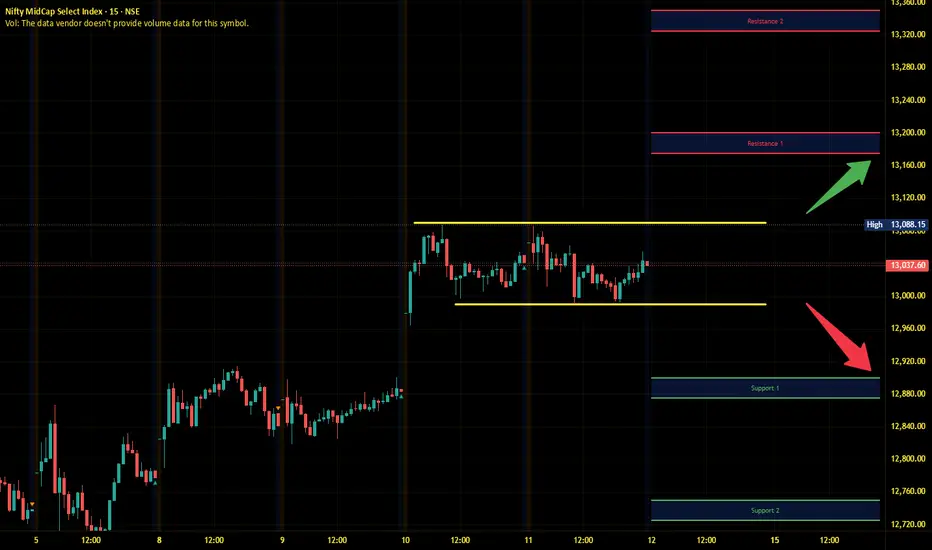
Midnifty Intraday Analysis for 12th September 2025NSE:NIFTY_MID_SELECT
Index has immediate resistance near 13175 – 13200 range and if index crosses and sustains above this level then may reach 13325 – 13350 range.
Midnifty has immediate support near 12900 – 12875 range and if this support is broken then index may tank near 12750 – 12725 range.
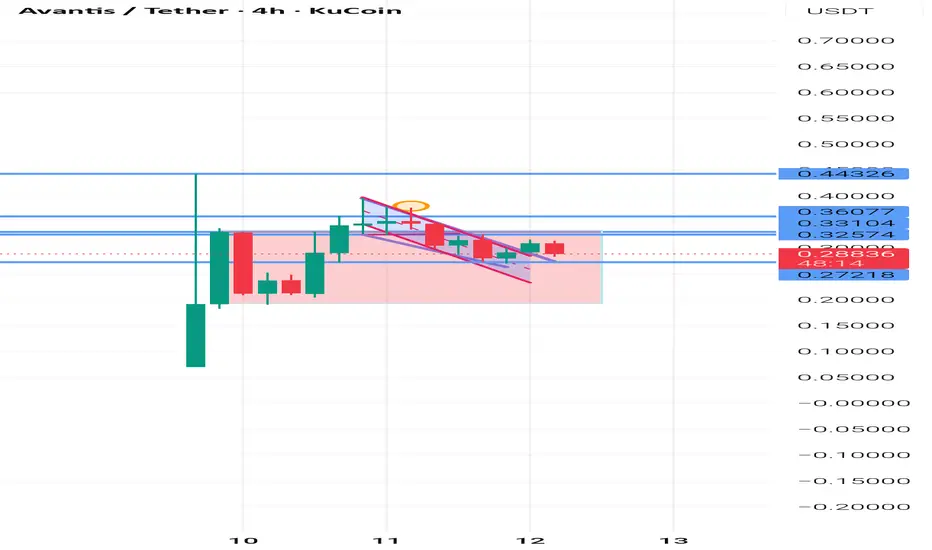
Avantis fi did a nice bullrun and ath is still pending Avantis fi did a nice bull run and looking for liquidity sweep near the 0.27 level and we moon
Expecting a nice ath pump form avantis fi
One of the bet on avantis fi can be done at 0.27 with small stop loss
Waiting for CPI & FED rate cut | Priority Buy at support🟡 XAU/USD – 11/09 | Captain Vincent ⚓
🔎 Captain’s Log – News Context
US PPI yesterday : Wholesale prices dropped sharply, below forecasts → strengthening expectations of a FED rate cut.
FED probabilities : 100% odds for a -25bps cut next week, and even 16% of investors bet on -50bps.
Today : US CPI & Jobless Claims – key data to assess inflation & labor, determining the specific cut.
⏩ Captain’s Summary : FED will certainly cut rates, so Gold remains supported in its bullish trend. Short-term fluctuations may occur due to sentiment or surprises (e.g., tariff news from Trump).
📈 Captain’s Chart – Technical Analysis
Storm Breaker (Resistance) :
Bearish OB: 3645 – 3650 (near-term resistance)
Weak High: 3674 (target if breakout succeeds)
Golden Harbor (Support) :
Near support: 3622
FVG Dock: 3603
Bullish OB: 3581 – 3585 (strong mid-term support)
Market Structure :
H1 shows a short-term bearish BoS, retesting support.
Main trend remains bullish → possible pullback to 3622 or 3603 before rallying toward 3670+.
🎯 Captain’s Map – Trade Plan
✅ Buy (priority with trend)
Entry 1 (FVG): 3603 – 3605
SL: 3592
TP: 3610 – 3615 – 3625 – 365x
Entry 2 (Bullish OB): 3581 – 3585
SL: 3572
TP: 3600 – 3620 – 3640
⚡ Sell (only short scalp at resistance)
Sell Zone: 3645 – 3650
SL: 3658
TP: 3635 – 3628 – 3622
⚓ Captain’s Note
“The Golden sails remain full of wind as the FED is almost certain to cut rates. Golden Harbor 🏝️ (3622 – 3603) and the deeper OB 3581 – 3585 are safe havens to follow the bullish tide. If the ship touches Storm Breaker 🌊 (3645 – 3650) , only Quick Boarding 🚤 short scalps are recommended. The larger voyage still heads north, steering Gold toward new highs at 367x.”

GreenPly Ind (Daily Timeframe) - Will it BreakOut?Greenply was in a downtrend since Aug 2024 and the trend reversed since Mar 2025. A Long-Term angular resistance that had formed since Aug 2024 has not been breached even after multiple tries. Today the stock made a positive BreakOut with exceptionally huge volume. At the same time, a Long-Term resistance from Dec 2017 is more significant. Short-term EMAs are yet to form PCO state, but we can already see Golden Cross-over since few days.
Will this BreakOut sustain? Let's watchout.

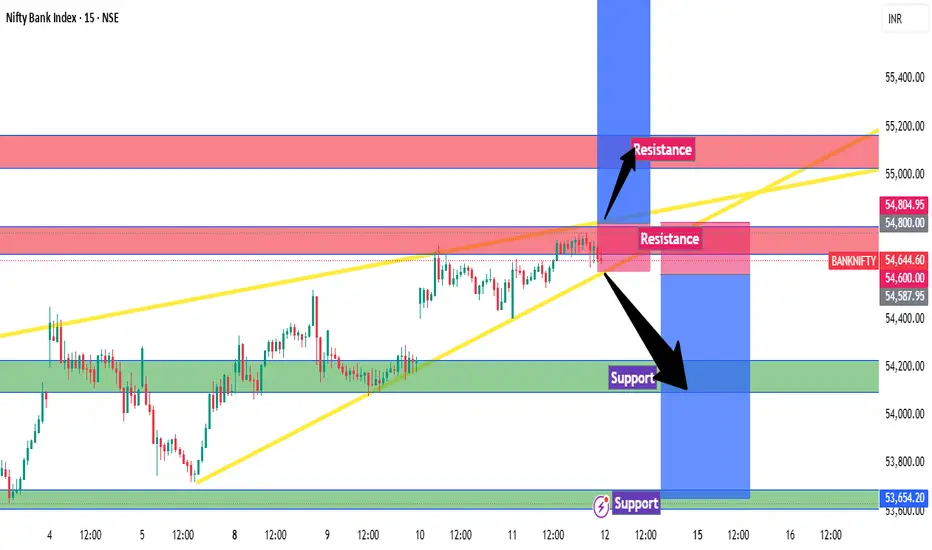
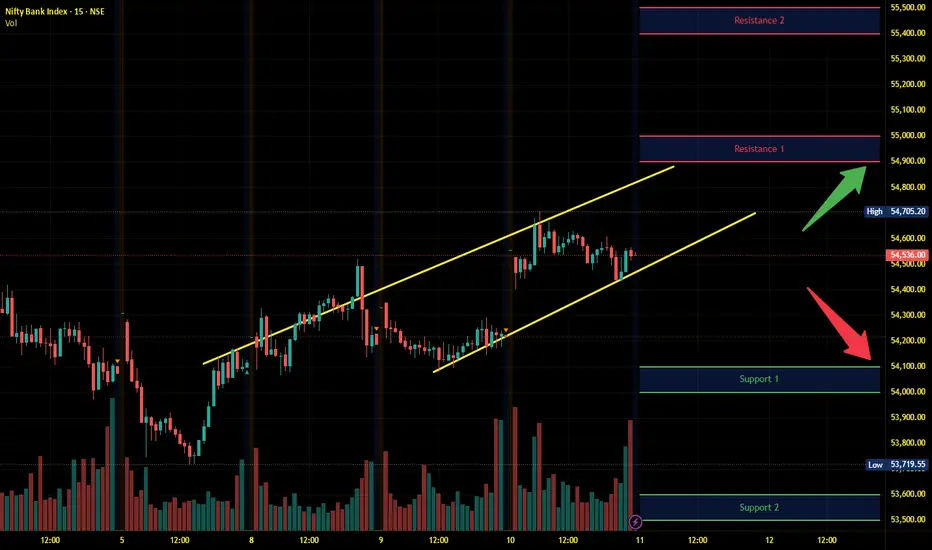
Banknifty Intraday Levels : 12-Sep-25Banknifty near the resistance level and formed ascending wedge pattern breakout above resistance upside move and if break Wedge in downside and reject from resitance zone may see downfall
Bearish < 54600
Bullish > 54800
Wait for Proper Rejection/Pattern :
Support : Bullish
Resistance : Bearish
Use Sl Trailing to reduce Risk
*All views for educational purpose only
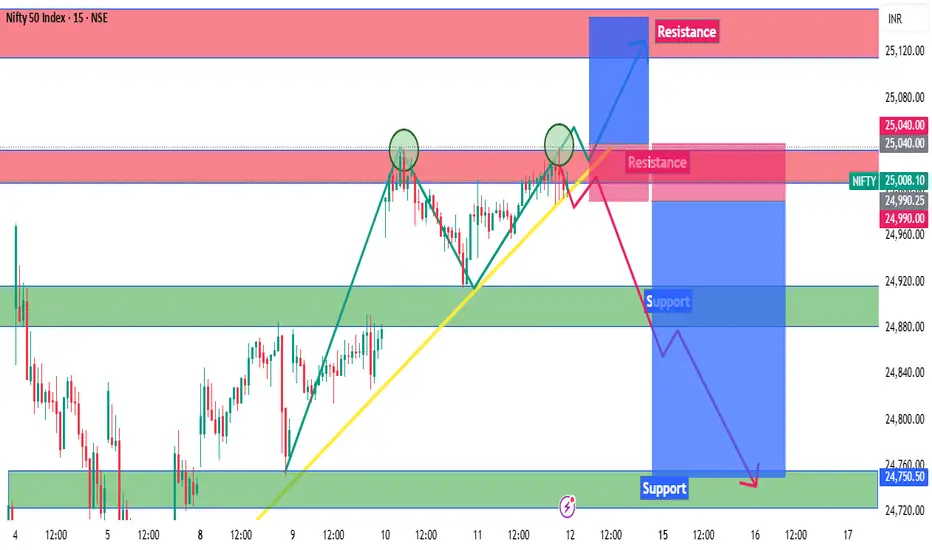
Nifty Intraday Levels : 12-Sep-25Nifty near the resistance level and formed double top and taken trend line support breakout above resistance up side move and if break trendline and reject from resistance zone may see downfall
Bearish < 24990
Bullish > 25040
Wait for Proper Rejection/Pattern :
Support : Bullish
Resistance : Bearish
Use Sl Trailing to reduce Risk
*All views for educational purpose only
Nifty Intraday Analysis for 11th September 2025NSE:NIFTY
Index has resistance near 25200 – 25250 range and if index crosses and sustains above this level then may reach near 25400 – 25450 range.
Nifty has immediate support near 24825 – 24775 range and if this support is broken then index may tank near 24625 – 24575 range.

Banknifty Intraday Analysis for 11th September 2025NSE:BANKNIFTY
Index has resistance near 54900 – 55000 range and if index crosses and sustains above this level then may reach near 55400– 55500 range.
Banknifty has immediate support near 54100 - 54000 range and if this support is broken then index may tank near 53600 - 53500 range.
Finnifty Intraday Analysis for 11th September 2025NSE:CNXFINANCE
Index has resistance near 26300 - 26350 range and if index crosses and sustains above this level then may reach near 26500 - 26550 range.
Finnifty has immediate support near 25950 – 25900 range and if this support is broken then index may tank near 25750 – 25700 range.

Midnifty Intraday Analysis for 11th September 2025NSE:NIFTY_MID_SELECT
Index has immediate resistance near 13175 – 13200 range and if index crosses and sustains above this level then may reach 13325 – 13350 range.
Midnifty has immediate support near 12900 – 12875 range and if this support is broken then index may tank near 12750 – 12725 range.