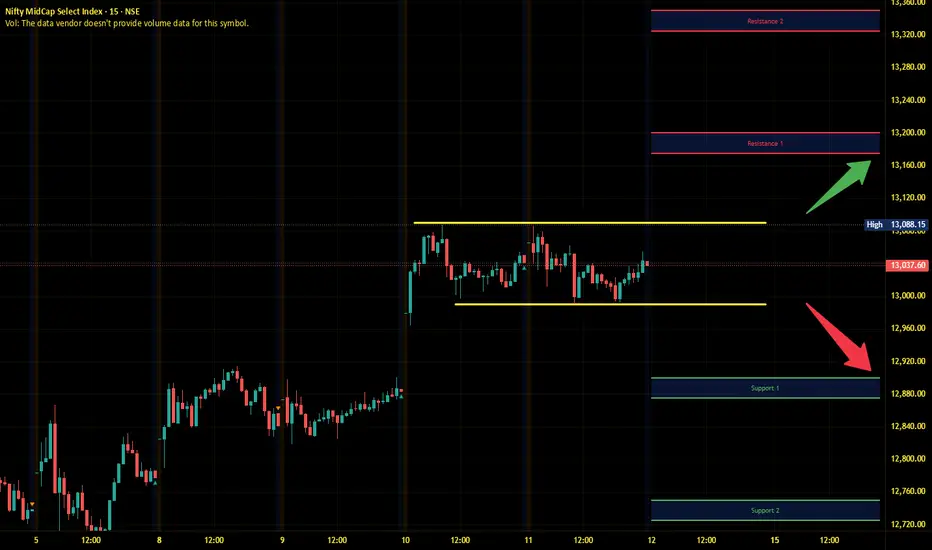
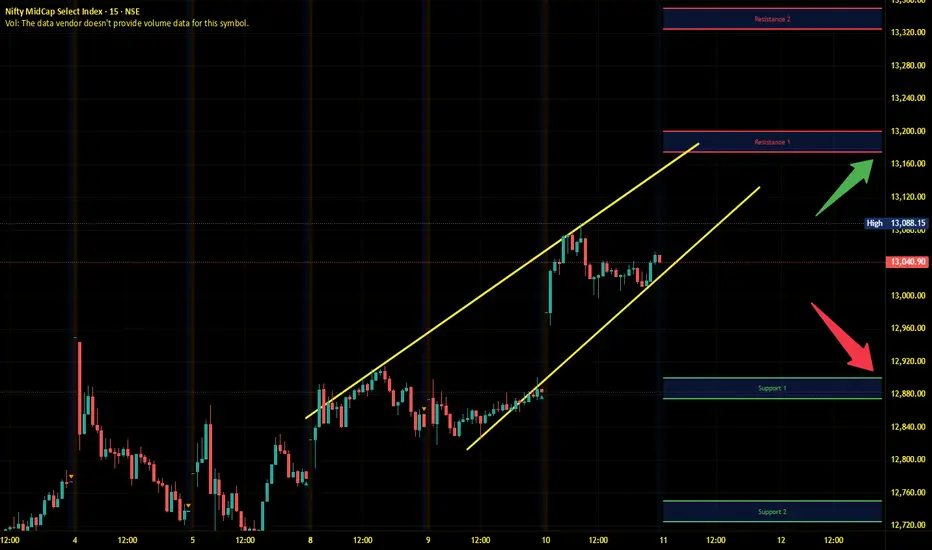
Midnifty Intraday Analysis for 12th September 2025NSE:NIFTY_MID_SELECT
Index has immediate resistance near 13175 – 13200 range and if index crosses and sustains above this level then may reach 13325 – 13350 range.
Midnifty has immediate support near 12900 – 12875 range and if this support is broken then index may tank near 12750 – 12725 range.
Support and Resistance
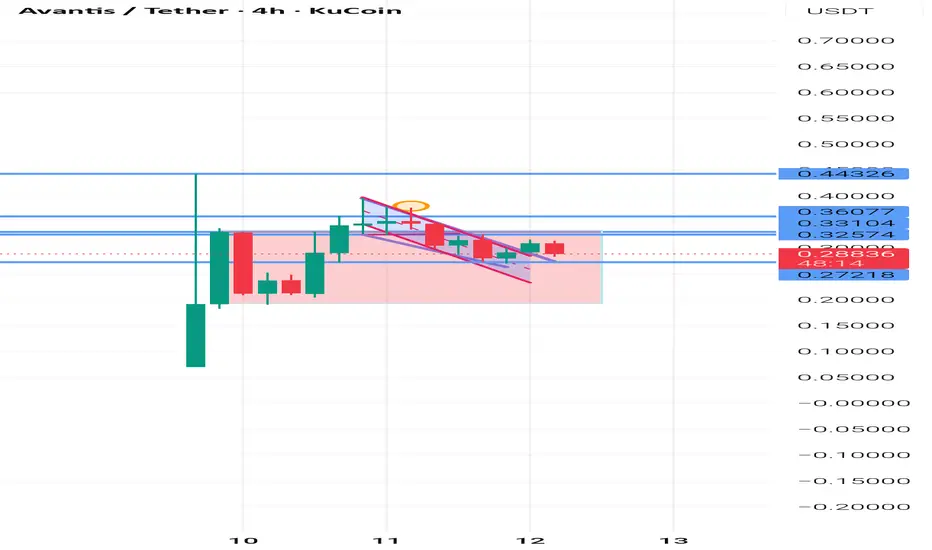
Avantis fi did a nice bullrun and ath is still pending Avantis fi did a nice bull run and looking for liquidity sweep near the 0.27 level and we moon
Expecting a nice ath pump form avantis fi
One of the bet on avantis fi can be done at 0.27 with small stop loss
Waiting for CPI & FED rate cut | Priority Buy at support🟡 XAU/USD – 11/09 | Captain Vincent ⚓
🔎 Captain’s Log – News Context
US PPI yesterday : Wholesale prices dropped sharply, below forecasts → strengthening expectations of a FED rate cut.
FED probabilities : 100% odds for a -25bps cut next week, and even 16% of investors bet on -50bps.
Today : US CPI & Jobless Claims – key data to assess inflation & labor, determining the specific cut.
⏩ Captain’s Summary : FED will certainly cut rates, so Gold remains supported in its bullish trend. Short-term fluctuations may occur due to sentiment or surprises (e.g., tariff news from Trump).
📈 Captain’s Chart – Technical Analysis
Storm Breaker (Resistance) :
Bearish OB: 3645 – 3650 (near-term resistance)
Weak High: 3674 (target if breakout succeeds)
Golden Harbor (Support) :
Near support: 3622
FVG Dock: 3603
Bullish OB: 3581 – 3585 (strong mid-term support)
Market Structure :
H1 shows a short-term bearish BoS, retesting support.
Main trend remains bullish → possible pullback to 3622 or 3603 before rallying toward 3670+.
🎯 Captain’s Map – Trade Plan
✅ Buy (priority with trend)
Entry 1 (FVG): 3603 – 3605
SL: 3592
TP: 3610 – 3615 – 3625 – 365x
Entry 2 (Bullish OB): 3581 – 3585
SL: 3572
TP: 3600 – 3620 – 3640
⚡ Sell (only short scalp at resistance)
Sell Zone: 3645 – 3650
SL: 3658
TP: 3635 – 3628 – 3622
⚓ Captain’s Note
“The Golden sails remain full of wind as the FED is almost certain to cut rates. Golden Harbor 🏝️ (3622 – 3603) and the deeper OB 3581 – 3585 are safe havens to follow the bullish tide. If the ship touches Storm Breaker 🌊 (3645 – 3650) , only Quick Boarding 🚤 short scalps are recommended. The larger voyage still heads north, steering Gold toward new highs at 367x.”

GreenPly Ind (Daily Timeframe) - Will it BreakOut?Greenply was in a downtrend since Aug 2024 and the trend reversed since Mar 2025. A Long-Term angular resistance that had formed since Aug 2024 has not been breached even after multiple tries. Today the stock made a positive BreakOut with exceptionally huge volume. At the same time, a Long-Term resistance from Dec 2017 is more significant. Short-term EMAs are yet to form PCO state, but we can already see Golden Cross-over since few days.
Will this BreakOut sustain? Let's watchout.

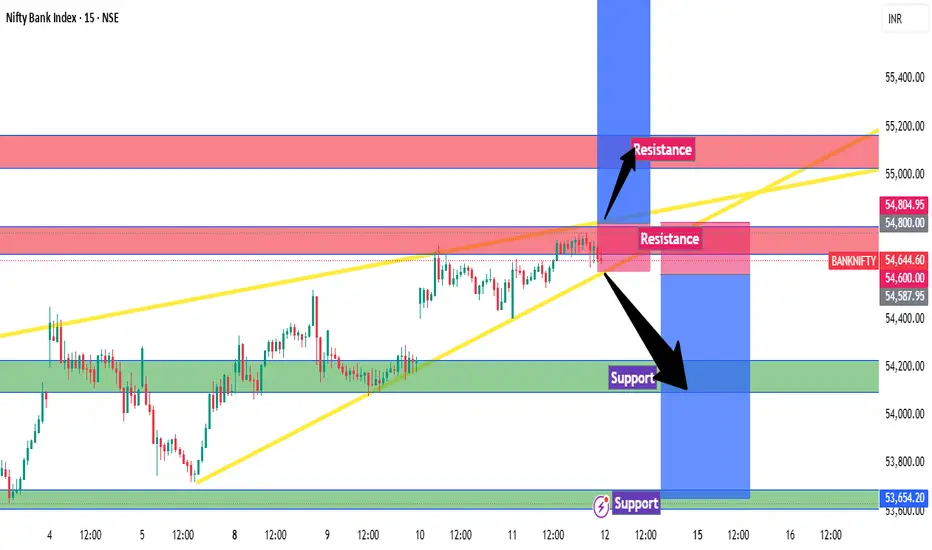
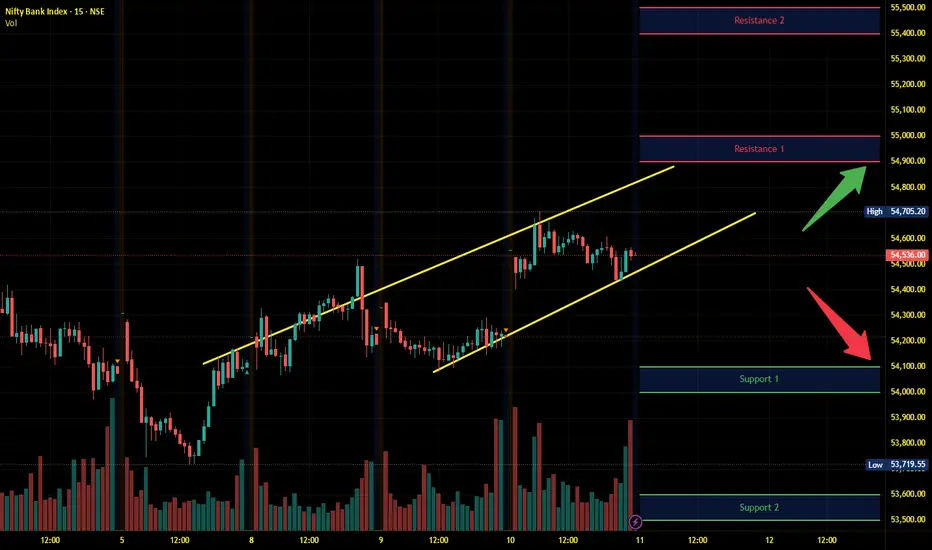
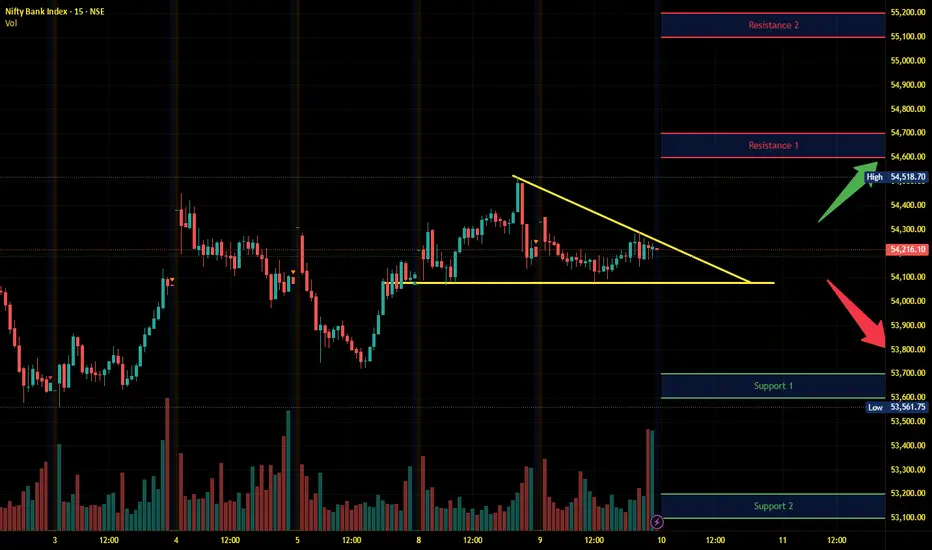
Banknifty Intraday Levels : 12-Sep-25Banknifty near the resistance level and formed ascending wedge pattern breakout above resistance upside move and if break Wedge in downside and reject from resitance zone may see downfall
Bearish < 54600
Bullish > 54800
Wait for Proper Rejection/Pattern :
Support : Bullish
Resistance : Bearish
Use Sl Trailing to reduce Risk
*All views for educational purpose only
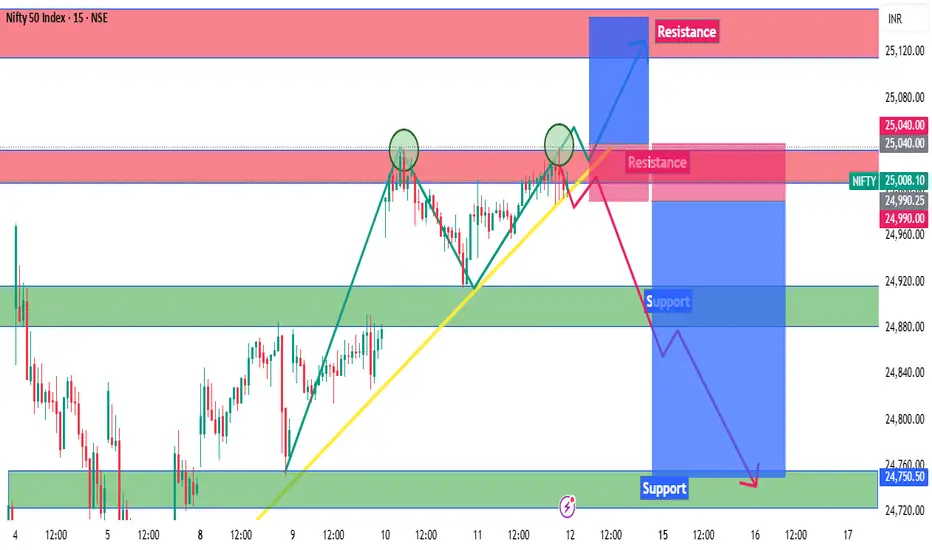
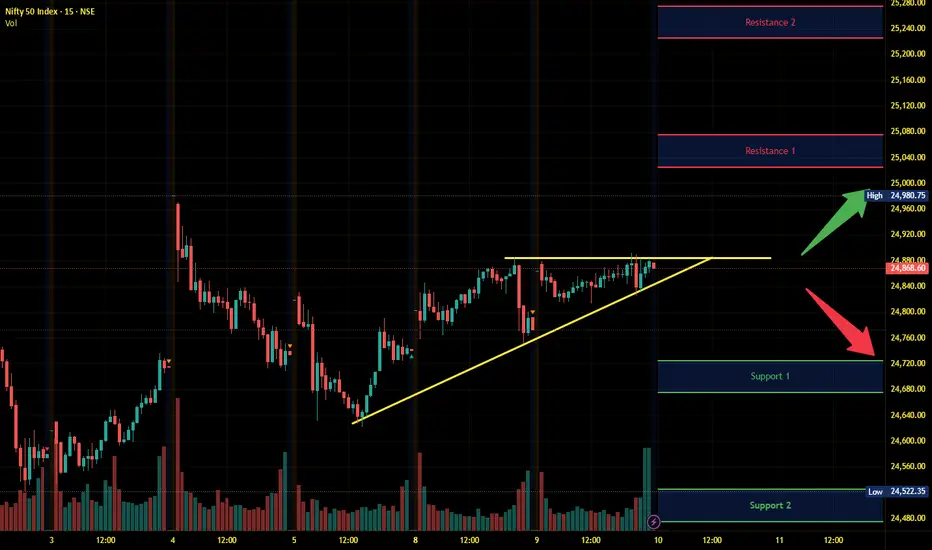
Nifty Intraday Levels : 12-Sep-25Nifty near the resistance level and formed double top and taken trend line support breakout above resistance up side move and if break trendline and reject from resistance zone may see downfall
Bearish < 24990
Bullish > 25040
Wait for Proper Rejection/Pattern :
Support : Bullish
Resistance : Bearish
Use Sl Trailing to reduce Risk
*All views for educational purpose only
Nifty Intraday Analysis for 11th September 2025NSE:NIFTY
Index has resistance near 25200 – 25250 range and if index crosses and sustains above this level then may reach near 25400 – 25450 range.
Nifty has immediate support near 24825 – 24775 range and if this support is broken then index may tank near 24625 – 24575 range.

Banknifty Intraday Analysis for 11th September 2025NSE:BANKNIFTY
Index has resistance near 54900 – 55000 range and if index crosses and sustains above this level then may reach near 55400– 55500 range.
Banknifty has immediate support near 54100 - 54000 range and if this support is broken then index may tank near 53600 - 53500 range.
Finnifty Intraday Analysis for 11th September 2025NSE:CNXFINANCE
Index has resistance near 26300 - 26350 range and if index crosses and sustains above this level then may reach near 26500 - 26550 range.
Finnifty has immediate support near 25950 – 25900 range and if this support is broken then index may tank near 25750 – 25700 range.

Midnifty Intraday Analysis for 11th September 2025NSE:NIFTY_MID_SELECT
Index has immediate resistance near 13175 – 13200 range and if index crosses and sustains above this level then may reach 13325 – 13350 range.
Midnifty has immediate support near 12900 – 12875 range and if this support is broken then index may tank near 12750 – 12725 range.
XAU/USD | 1H | CPI Setup in PlayGold just swept the previous low around 3615 and is showing signs of accumulation. Liquidity below has been taken, and the market structure hints at a bullish delivery if CPI comes in line with expectations.
Key levels:
Demand Zone 3610–3620 where buyers stepped in
First Target 3650 area (mid supply)
Final Target 3685–3690 (major supply/liquidity pool)
Bias: Waiting for a clean internal break of structure and retest before the impulsive move up. CPI data could be the catalyst for this push toward the upper liquidity zones.

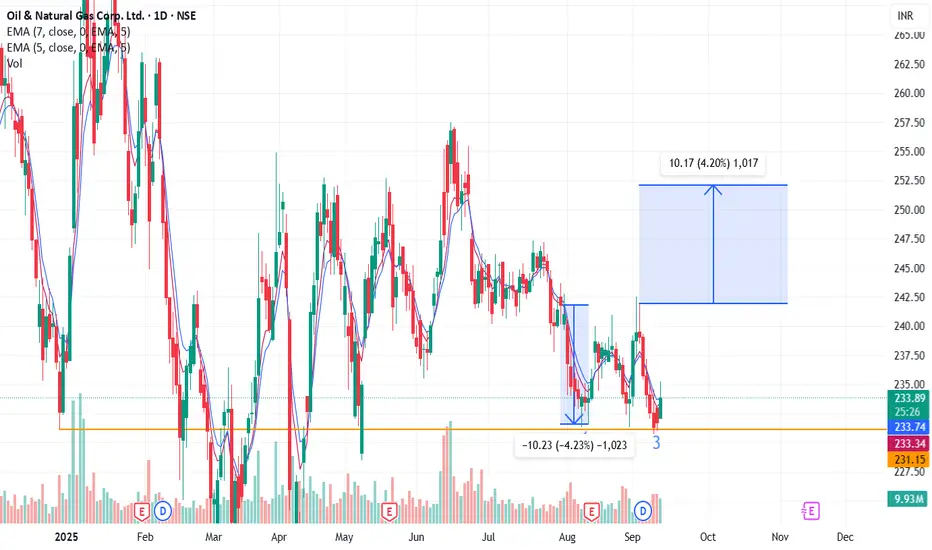
Triple bottom setup on weekly supportNSE:ONGC
Triple bottom setup on weekly support, price started moving upward slowly, with some big spikes in volume. This is very good setup. If this continues, one can expect first tartget at 242 and second target on 252.
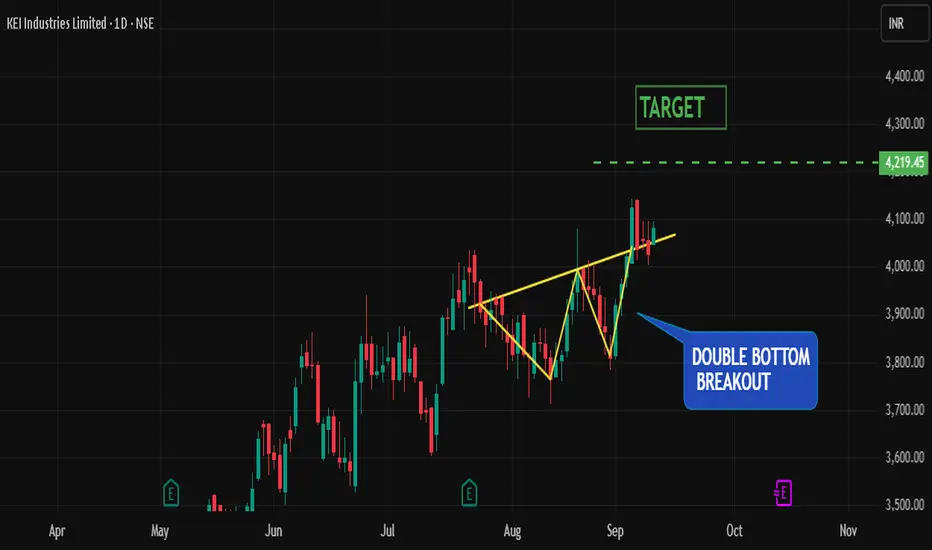
Double-Bottom Breakout → Bulls in Control | Target ₹4219The stock has recently completed a double-bottom reversal pattern . A double bottom forms when price tests the same support level twice and fails to break lower, creating a “W-shaped” structure. This indicates that sellers tried twice to push the stock lower but were unable to, while buyers stepped in to defend the level. Once price breaks above the neckline (the midpoint of the “W”), the pattern is confirmed, often signaling the start of a bullish trend.
Adding further strength to this setup, price is holding firmly above the 50D, 100D, and 200D SMA . Here’s why this matters:
50-Day SMA : Represents short-term trend. Interestingly, the stock has now tested the 50D SMA thrice and held each time , showing strong buyer interest and reinforcing bullish momentum.
100-Day SMA : Reflects medium-term structure; price above this confirms that buyers dominate the broader swing.
200-Day SMA : The long-term benchmark; trading above this signals the stock is firmly in an uptrend.
When price stays above all three moving averages, it shows alignment across short, medium, and long-term trends — a powerful confirmation that bulls are in control.
Trade Plan :
Entry : On breakout above neckline or on a pullback retest of neckline as support.
Target : ₹4219 (measured move objective from the double bottom pattern).
Risk Management : Stick to disciplined sizing; risk no more than 1–2% of trading capital.
HUDCO: Bounce or Just a Pause Before More Pain?After topping near ₹353.70, HUDCO has been working its way lower in what looks like a complex W–X–Y corrective structure on the weekly timeframe.
Wave W ended at ₹158.85, completing a sharp three-wave decline.
The subsequent rebound into ₹253.75 unfolded as Wave X, forming a triangle-like structure and stalling right at the resistance zone.
From there, price started its Wave Y decline.
At the current stage:
Price has found temporary support near the 100-week SMA.
Last week’s candle printed a Bullish Engulfing pattern, hinting at a possible Wave (b) bounce in progress.
However, as long as HUDCO trades below the invalidation level of ₹253.75, the broader expectation still favors another leg lower into Wave (c) of Y.
In short, the bounce could provide some relief, but the larger corrective structure may not be complete yet.
Invalidation: Above ₹253.75.
Bias: Bearish until proven otherwise.
Disclaimer: This analysis is for educational purposes only and does not constitute investment advice. Please do your own research (DYOR) before making any trading decisions.

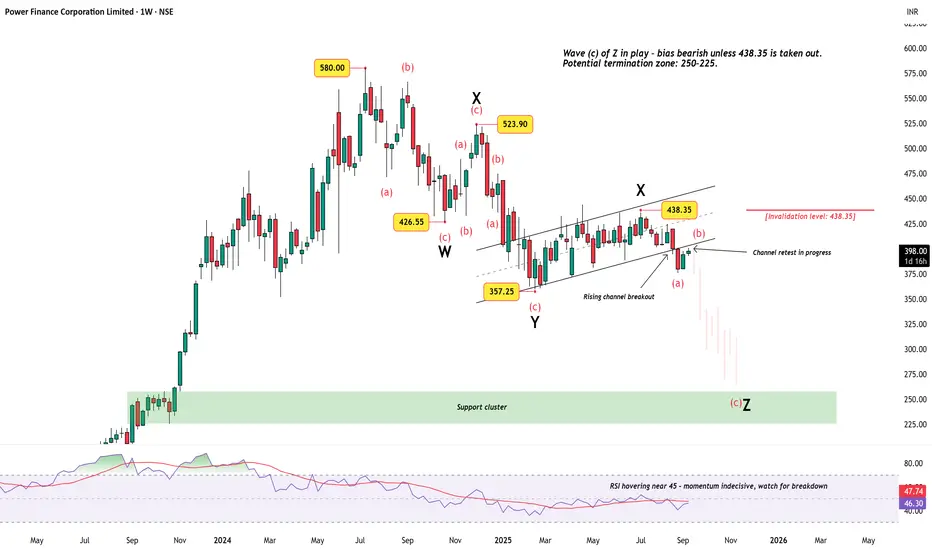
Power Finance Corporation – Complex Correction Still in PlayAfter topping out near ₹580, Power Finance Corporation (PFC) has been locked in a prolonged corrective structure. The price action since mid-2023 suggests a triple correction (W-X-Y-X-Z) , with the final leg (Wave Z) now unfolding.
Technical View
Price broke down from a rising channel and is currently retesting the underside of that channel – a classic setup to watch for continuation.
Wave (c) of Z appears to be in progress, keeping the near-term bias tilted bearish unless price crosses above ₹438.35 (invalidation level).
A potential termination zone lies around ₹250–225, aligning with the highlighted support cluster.
RSI is hovering in the mid-40s, showing lack of upside strength and leaning toward further weakness.
Summary
Bias remains bearish while below ₹438.35. A deeper leg into the ₹250–225 support cluster cannot be ruled out before this complex correction completes.
Disclaimer: This analysis is for educational purposes only and does not constitute investment advice. Please do your own research (DYOR) before making any trading decisions.
Sobha LimitedPrice Retracement at 50% of Privious Impulsive Move on Daily Time Frame
Again Price Comes To Support ,Sweep Liquidity of Last Support
Today Proce Shift Market Structure (MSS)
Break Trndline.

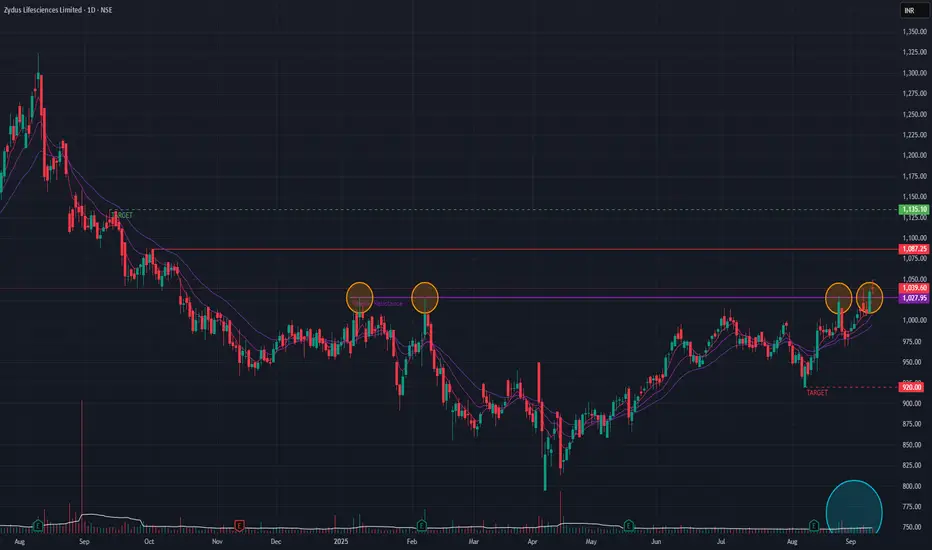
Zydus Life (Daily Timeframe) - Potential BreakOut candidate ??Zydus Lifesciences BrokeOut of a major resistance zone (since Oct 2024) couple of days back and it re-tested the zone again today. The volume is above average though. Short-term EMA's are in PCO state which indicates bullishness.
If the BreakOut sustains then we may see the stock reaching levels of 1135. We may see levels of 920 if the BreakOut does not sustain.
Price-action is to be monitored !!
Caution ahead of US PPI report | Priority on Sell setups🟡 XAU/USD – 10/09 | Captain Vincent ⚓
🔎 Captain’s Log – Market Context
US 10-year bond yields rebound, signaling the market is awaiting key inflation data.
At 07:30, US PPI report will be released – a crucial figure that could strongly influence FED rate expectations.
Investors are also eyeing US CPI in the coming days to assess the inflation outlook.
The US Supreme Court accepted Trump’s appeal, but this news has not yet had a notable impact on Gold.
⏩ Captain’s Summary: Ahead of inflation data, Gold often tends to correct lower due to cautious sentiment.
📈 Captain’s Chart – Technical Analysis
Storm Breaker (Key Resistance):
Bearish OB: 3654 – 3660 (short-term upper cap)
ATH Watchtower: 3700 – 3702 (Sell Zone – possible new ATH test)
Golden Harbor (Strong Support):
Buy Zone: 3601 – 3602
OB Dock: 3582 – 3585
Currently, price is around 3640 – 3645, after a technical rebound from support. High probability that Gold will retest nearby resistance before a downward correction.
🎯 Captain’s Map – Trade Scenarios
⚡ Quick Boarding (SELL – Daily Priority)
Entry 1: 3654 – 3660
SL: 3668
TP: 3654 → 3650 → 3618 → 3610
Entry 2 – ATH Test: 3701 – 3703
SL: 3711
TP: 3688 → 3675 → 3665 → 365x
✅ Golden Harbor (BUY – Only at deep support)
Buy Zone: 3601 – 3603
SL: 3592
TP: 3610 → 3620 → 3630
⚓ Captain’s Note
“The golden ship faces turbulent seas today as it sails near Storm Breaker 🌊 (3654 – 3660) . Before the fierce winds called US PPI , sailors should prioritize dropping anchor with short-term SELL positions at resistance. Golden Harbor 🏝️ (3601 – 3603) remains a safe haven below, but only when the ship corrects deeply should it dock. On this voyage, Quick Boarding 🚤 is for scalp maneuvers, while the main current is still steered by the stormy waves of inflation.”

TVS Holdings (Daily Timeframe) - Can we expect new ATH ??TVSHLTD BrokeOut of a major resistance that formed since Nov 2024. On a daily basis, the stock did retest the trendline and moved up today which is a positive indication. This was accompanied with good volume. In the Weekly timeframe the stock is indicating bullish momentum as well as Short-term EMAs are in PCO state.
On the upside, we may see the stock reaching 14,495 levels if the momentum continues. While on the downside, it may reach 11,667 levels as well if there is a trend reversal.
Keep watching the price-action !!

XAU/USD – Captain Vincent Update | 15m Outlook🔎 Captain’s Log – Market Structure
On the 15-minute timeframe (M15) , price just formed a Break of Structure (BoS) above the previous accumulation zone → confirming temporary control by the Buy side.
However, the Bearish Order Block (H1 Zone) around 3655 is being tested, marking a key resistance area.
📈 Captain’s Chart – Bullish Scenario
If price holds above the OB zone 3644 – 3655 , buying pressure may continue to push the ship toward the Weak High 3674 .
Further ahead, the next destination is Storm Breaker Peak (3701 – 3708) – where strong selling reactions are expected.
📉 Captain’s Chart – Bearish Scenario
After sweeping liquidity and touching the Storm Breaker (Sell Zone) , Gold may reverse lower.
Key level to monitor: OB 3644 . If this area breaks, the market could open a deeper bearish leg.
🎯 Captain’s Map – Key Levels
Golden Harbor (Support) : 3644 – 3655 (OB retest zone)
Target (Bullish) : 3674 → 3701 – 3708
Storm Breaker (Sell Zone) : 3701 – 3708
Invalidation : Break below 3644 opens a new bearish journey
⚓ Captain’s Note
“The Golden sails have just caught new wind after a BoS , showing that the captain and crew still hold a short-term advantage. Golden Harbor 🏝️ (3644 – 3655) is the key dock to sustain the bullish trend. If Gold clears the Weak High 3674 , the ship may head straight to Storm Breaker 🌊 (3701 – 3708) , where reversal waves are likely to rise. While the short-term tide remains bullish, Storm Breaker still hides major risks – sailors must sail with strict risk management discipline.”

Nifty Intraday Analysis for 10th September 2025NSE:NIFTY
Index has resistance near 25025 – 25075 range and if index crosses and sustains above this level then may reach near 25225 – 25250 range.
Nifty has immediate support near 24725 – 24675 range and if this support is broken then index may tank near 24525 – 24475 range.
Banknifty Intraday Analysis for 10th September 2025NSE:BANKNIFTY
Index has resistance near 54600 – 54700 range and if index crosses and sustains above this level then may reach near 55100– 55200 range.
Banknifty has immediate support near 53700 - 53600 range and if this support is broken then index may tank near 53200 - 53100 range.
Finnifty Intraday Analysis for 10th September 2025NSE:CNXFINANCE
Index has resistance near 26125 - 26175 range and if index crosses and sustains above this level then may reach near 26350 - 26400 range.
Finnifty has immediate support near 25800 – 25750 range and if this support is broken then index may tank near 25600 – 25550 range.
