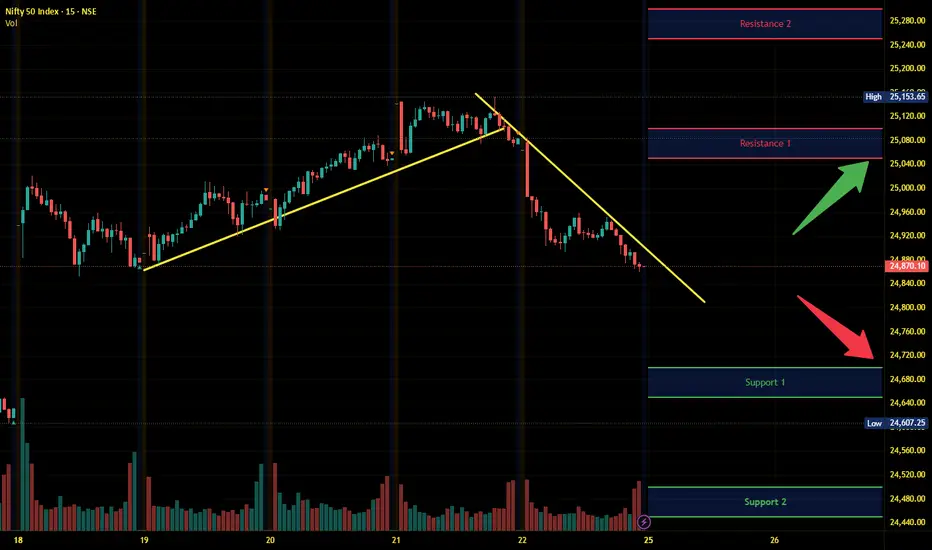
Nifty Intraday Analysis for 25th August 2025NSE:NIFTY
Index has resistance near 25050 – 25100 range and if index crosses and sustains above this level then may reach near 25250 – 25300 range.
Nifty has immediate support near 24700 – 24650 range and if this support is broken then index may tank near 24500 – 24450 range.
Support and Resistance
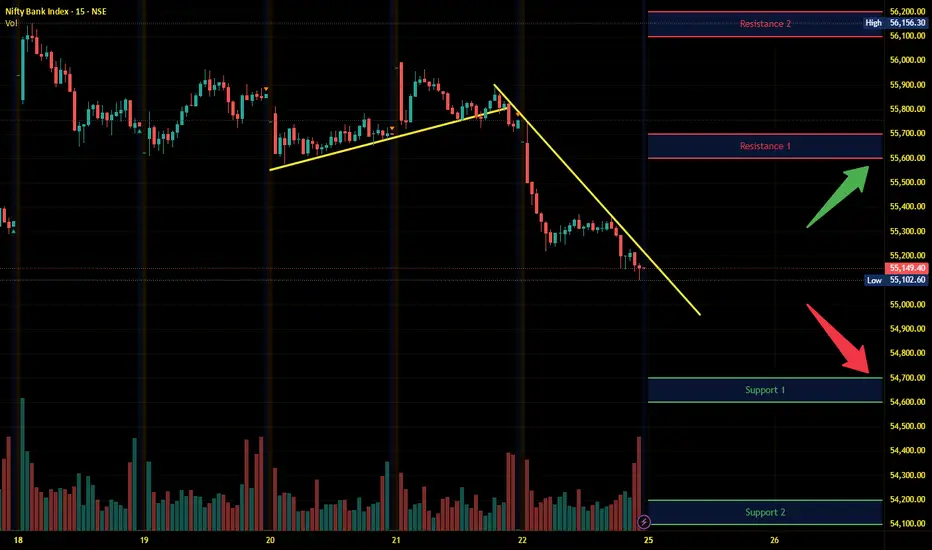
Banknifty Intraday Analysis for 25th August 2025NSE:BANKNIFTY
Index has resistance near 55600 – 55700 range and if index crosses and sustains above this level then may reach near 56100– 56200 range.
Banknifty has immediate support near 54700 - 54600 range and if this support is broken then index may tank near 54200 - 54100 range.
Finnifty Intraday Analysis for 25th August 2025NSE:CNXFINANCE
Index has resistance near 26550 - 26600 range and if index crosses and sustains above this level then may reach near 26775 - 26825 range.
Finnifty has immediate support near 26150 – 26100 range and if this support is broken then index may tank near 25950 – 25900 range.

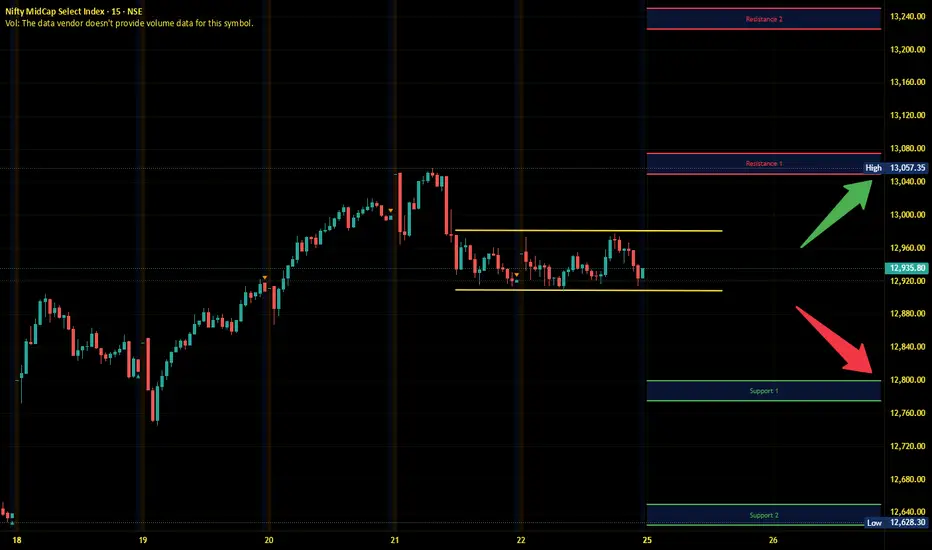
Midnifty Intraday Analysis for 25th August 2025NSE:NIFTY_MID_SELECT
Index has immediate resistance near 13050 – 13075 range and if index crosses and sustains above this level then may reach 13225 – 13250 range.
Midnifty has immediate support near 12800 – 12775 range and if this support is broken then index may tank near 12650 – 12625 range.
Technical analysis projection for XAU/USD 25.08.25Chart Overview
Type: Daily candlestick chart of XAU/USD.
Current Price: Around 3,369 USD/oz.
Bias: Bullish (Buy projection).
📊 Key Technical Highlights
Trendline & Pattern
A major ascending triangle pattern is visible.
Price is respecting a major upward trendline (Day Uptrend Line).
Recently, a Double Bullish Engulfing candle formed near the trendline support – a strong bullish reversal signal.
Support & Resistance Levels
Support S1: Around 3,360 – 3,370 (close to current price).
Support S2: Around 3,330 – 3,340 (stronger downside support).
Resistance R1: Around 3,410 – 3,420.
Resistance R2: Around 3,450 – 3,460.
A Flat Resistance Zone exists between 3,400 – 3,420.
Bullish Signals
Bullish Momentum Formed: Price has bounced from support, forming upward momentum.
Major Trendline Obeyed: Price tested the uptrend line and respected it, confirming bullish structure.
Double Bullish Engulfing Pattern: Reinforces buying strength.
🟢 Projection Path (Bullish Scenario)
From the current price (3,369):
Expect a move toward Support S1 confirmation.
Break above Flat Resistance Zone (3,400 – 3,420).
Target Resistance R2 at 3,450 – 3,460.
🔴 Risk (Bearish Scenario)
If price fails to hold Support S1, it may retest Support S2 (~3,340).
A break below 3,330 would invalidate this bullish outlook and may push gold further down.
✅ Summary:
This chart shows a bullish projection for gold with price expected to rise from the current level 3,369 → 3,450, supported by an ascending triangle pattern, bullish engulfing signals, and strong trendline support.

Gold preparing for correction under FED & geopolitic - Vincent🟡 Gold Plan 25/08 – Captain Vincent ⚓
1. Market Context 🌍
Russia – Ukraine: Trump puts pressure on Putin to negotiate within 2 weeks. This looks positive for peace, but also carries escalation risks → Gold keeps its safe-haven role .
FED – Powell at Jackson Hole: Hawkish tone reduced expectations of a September rate cut from 3 to 2. USD strengthened → short-term downside pressure on Gold .
👉 Mix of political support vs FED pressure → Sideways market, Gold may need a pullback to absorb liquidity before showing clear direction.
2. Technical Outlook ⚙️
H4 candle closed bearish → Buying momentum weakens , sellers may return.
Recent FVG created after sharp bounce → Likely pullback for liquidity grab .
Bias of the day: Prioritise Sell, but short Buy Scalp setups possible at support.
3. Key Levels – Captain Vincent’s Map 🪙
Resistance:
Storm Breaker 🌊 (Sell Zone 3398 – 3400)
3376 (intermediate resistance – watch reaction)
Support:
Quick Boarding 🚤 (Buy Scalp 3340 – 3342)
SL: 3333
TP: 3345 → 3349 → 3353 → 3357 → 33xx
Golden Harbor 🏝️ (Buy Zone 3328 – 3326)
SL: 3318
TP: 3332 → 3336 → 3339 → 33xx
Higher Low – 3323
Anchor point of the trend → If broken, need to reassess all Buy setups.
4. Trade Scenarios 📌
🔻 Sell at Storm Breaker 🌊
Entry: 3398 – 3400
SL: 3408
TP: 3395 → 3390 → 3387 → 3384 → 33xx
🚤 Buy Scalp at Quick Boarding
Entry: 3340 – 3342
SL: 3333
TP: 3345 → 3349 → 3353 → 3357 → 33xx
🏝️ Buy at Golden Harbor (3328 – 3326)
SL: 3318
TP: 3332 → 3336 → 3339 → 33xx
5. Captain’s Note ⚓
"Today, the golden sea is full of undercurrents: FED winds blow against, politics push along. Those who pick Storm Breaker 🌊 may ride the wave safely; those who patiently wait at Golden Harbor 🏝️ will find peace. Quick Boarding 🚤 is for sailors seeking fast scalps in narrow waters."

Bank Nifty Weekly Insights: Key Levels & TrendsThe Bank Nifty ended the week at 55,149.40, slipping -0.35%.
🔹 Key Levels for the Upcoming Week
📌 Price Action Pivot Zone:
55,032 to 55,267 – This blue-shaded range is the key area to watch. A breakout on either side could decide next week’s trend direction.
🔻 Support Levels
S1: 54,679
S2: 54,207
S3: 53,739
🔺 Resistance Levels (From Chart):
R1: 55,621
R2: 56,093
R3: 56,564
📊 Candle Observation:
The weekly candle was a strong bearish red candle with both upper and lower shadows. This shows that while bulls attempted a recovery early in the week, sellers overpowered them, pushing the index lower. Buyers did step in at the bottom, but overall the sentiment remains bearish-to-neutral, with resistance pressure visible near the pivot zone.
📰 Sentiment Check (Last Week):
Market sentiment was hit by global uncertainty despite the optimism around the Trump–Putin meeting, which initially gave a positive gap-up.
Profit booking dominated midweek, particularly in banking stocks, dragging Bank Nifty into the red.
The candle reflects caution among traders, with the index struggling to find bullish momentum above resistance levels.
📈 Market Outlook
✅ Bullish Scenario:
If Bank Nifty sustains above 55,267, buyers may gain control, pushing the index toward R1 (55,621), followed by R2 (56,093) and R3 (56,564).
❌ Bearish Scenario:
If the index falls below 55,032, sellers could dominate, leading the index toward S1 (54,679), and potentially to S2 (54,207) and S3 (53,739).
📌 Sentiment Outlook:
The strong bearish candle signals that sellers are still in command. Unless Bank Nifty reclaims and sustains above 55,267, the index may remain under pressure. Supports at 54,679 and below will be critical to watch in the coming week.
Disclaimer: lnkd.in

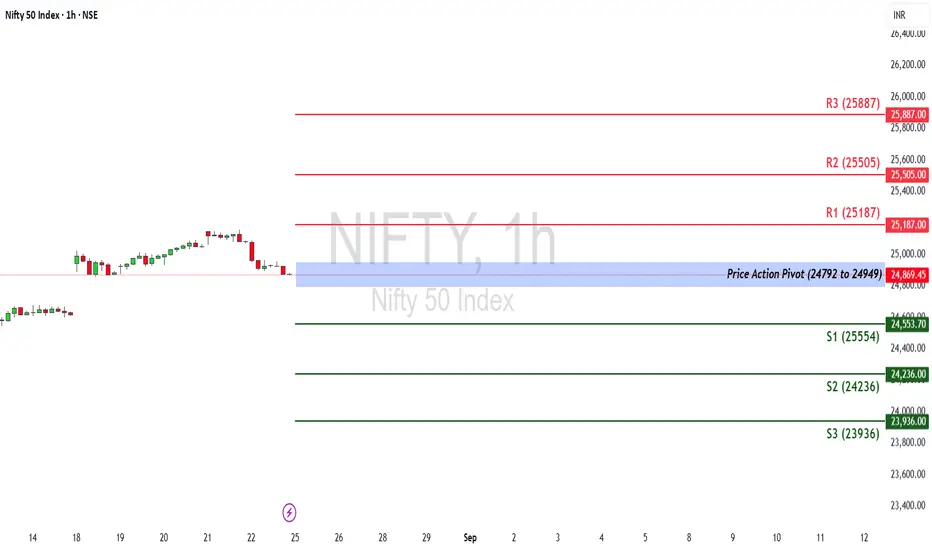
Nifty Weekly Outlook: Holding the Line or Breaking Below?The Nifty 50 ended the week at 24,870.10, gaining +0.97%.
🔹 Key Levels for the Upcoming Week
📌 Price Action Pivot Zone:
24,792 to 24,949 – This is the critical zone to watch. A decisive move beyond either side may dictate next week’s trend.
🔻 Support Levels
S1: 24,553
S2: 24,236
S3: 23,936
🔺 Resistance Levels
R1: 25,187
R2: 25,505
R3: 25,887
📊 Candle Observation:
The last weekly candle formed a red body with a long lower shadow, showing that although bears dominated early in the week, strong buying support emerged near the lows. This wick-based recovery signals demand at lower levels, keeping the support zones (24,553–24,236) important for the coming sessions.
📰 Sentiment Check (Last Week):
The Nifty opened the week with a gap-up, supported by global cues and positive sentiment around the Trump–Putin meeting, which was seen as a potential step toward easing geopolitical tensions.
However, mid-week profit booking dragged the index down, before buyers stepped back in from lower supports, leaving a long lower wick on the weekly candle.
This shows underlying resilience, though the market remains sensitive to global political developments.
📈 Market Outlook
✅ Bullish Scenario:
If Nifty sustains above 24,949, buying momentum could build, aiming for R1 (25,187). A strong breakout above this may push prices towards R2 (25,505) and R3 (25,887).
❌ Bearish Scenario:
If the index breaks below 24,792, selling pressure may return. This could drag Nifty towards S1 (24,553), and further down to S2 (24,236) and S3 (23,936).
📌 Sentiment Outlook:
Nifty is showing resilience with support at lower levels, but for a strong bullish confirmation, it needs to sustain above the 24,949 pivot zone. Global cues, especially political events, may continue to influence short-term moves.
Disclaimer: lnkd.in
HUL - Support & Resistance AnalysisHUL - Daily Chart Analysis (Support & Resistance)
Key Factors to Reach 2810 & 3000 level
=> Support Level (Double Bottom) created on 04.03.25 & 07.04.25
=> Broken the Strong Resistance Level (Between 2458.20 & 2529.85)
=> Uptrend in intact
=> Next, the price will move to the next Resistance levels of 2810 & 3025 (Targets)
=> Last traded Price - 2629.90
=> Stop Loss - 2395 on closing Basis
In Addition,
=> US Tariff will have minimal impact
=> Expect that the coming GST revision will have benefit

Observing Charts Smarter: Learning Price Action Made EasyIn this video, I share how simple trading observations and “talking to the charts” can improve your understanding of price action and trade movements. By reviewing Apollo’s chart, we explore how breakout patterns, retracements, and higher highs unfold in real time. The goal is not prediction, but sharpening your ability to read market structure, avoid wrong entries, and reduce big drawdowns—ultimately helping you become a more disciplined trader.

Nifty - Weekly Review Aug 25 to Aug 29Price is at the double bottom support now. Breaking it can make the price fill the gap. Filling the gap will make the price more bearish. 24850 is the trend direction deciding zone now.
Buy above 24920 with the stop loss of 24870 for the targets 24960, 25000, 25060, 25120, and 25200.
Sell below 24800 with the stop loss of 24850 for the targets 24760, 24700, 24660, 24600 and 24540.
Always do your analysis before taking any trade.

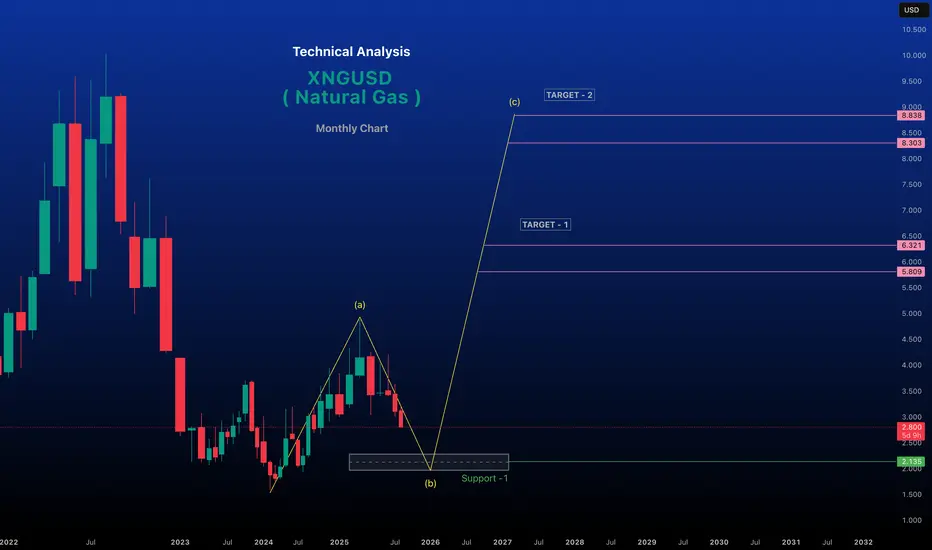
Natural gas analysis Monthly Time frameNatural gas markets are influenced by a complex interplay of supply, demand, weather, geopolitical events, and technical factors. Below is a concise analysis based on recent trends and data as of August 24, 2025, covering key aspects of the natural gas market
Price Trends and Market Dynamics
Spot and Futures Prices: The Henry Hub spot price recently fell from $2.92/MMBtu to $2.81/MMBtu, and the September 2025 NYMEX futures contract dropped from $2.828/MMBtu to $2.752/MMBtu. The 12-month futures strip (September 2025–August 2026) averaged $3.501/MMBtu, reflecting a bearish near-term outlook but expectations of tighter balances later.
Supply and DemandSupply: U.S. natural gas production has risen, with a 3% increase in marketed production in 2025, particularly from the Permian (2 Bcf/d), Haynesville, and Appalachia (0.9 Bcf/d each). However, production is expected to stabilize in 2026 as associated gas from oil declines.
Storage: U.S. storage inventories are projected to reach 3,927 Bcf by October 31, 2025, 174 Bcf above the five-year average, due to higher-than-average injections (20% above the five-year average). This surplus is pressuring prices downward.
Demand: Cool weather forecasts for August 2025, potentially the coolest in 50 years, have reduced demand, contributing to bearish price sentiment. However, LNG exports are rebounding, with Freeport LNG operations resuming, providing some support.
LNG Exports: Maintenance at U.S. LNG terminals earlier in 2025 reduced exports, but recovery and new contracts (e.g., ConocoPhillips’ 4 Mt/y from Port Arthur LNG Phase 2) signal growing export potential.
Technical AnalysisBearish Signals: Technical indicators suggest a "strong sell" for Natural Gas Futures across multiple timeframes (daily, weekly, monthly), driven by a head-and-shoulders pattern with prices breaking below the $3.050 neckline, targeting $2.220–$2.000.
Indicators: RSI, MACD, and stochastic oscillators indicate oversold conditions, but negative momentum persists below key resistance levels like $3.100–$3.320. Pivot points and moving averages reinforce bearish trends, with potential support at $2.200.
Geopolitical and Structural FactorsEurope: The 2022–2023 Russian supply shock shifted Europe to rely on LNG, increasing price volatility. Market reforms have boosted trading volumes (7,300 bcm in 2024, 15x demand), but derivatives trading by physical players dominates, limiting speculative impacts.
Weather Impact: Cooling in the Midwest and Northeast (highs of 60s–80s°F) contrasts with hotter conditions elsewhere (80s–100s°F), driving regional demand differences. Weather models (ECMWF, GFS) forecast continued impacts on heating and cooling degree days, affecting prices.
Energy Transition: Natural gas is increasingly vital for electricity generation as coal phases out, linking gas and power markets and amplifying price sensitivity to weather and demand.
Forecast and OutlookShort-Term (1–6 Weeks): Bearish due to high storage, weak demand from cool weather, and technical indicators. Prices may test support at $2.220–$2.080,
Long-Term: Growing U.S. electricity demand (31% over 15 years) and constrained global supply (e.g., limited OPEC spare capacity) suggest bullish prospects for natural gas as a reliable fuel.
Trading ConsiderationsRisks: High volatility, weather-driven demand shifts, and geopolitical uncertainties (e.g., Russia-Ukraine tensions) pose risks.
Strategies: Traders may consider short positions targeting $2.80, but oversold conditions suggest caution for potential reversals. Long-term investors might accumulate near support zones ($2.220–$2.080) for 2026 upside.
Data Tools: Monitor EIA storage reports, weather forecasts (NatGasWeather.com), and technical indicators (RSI, MACD) for real-time insights.
Note: Trading involves high risks, and past performance does not guarantee future results. Always conduct your own research.
Cup & Handle breakout, momentumSTOCK has given positive breakout in last week after retest
good for long
ONLY FOR EDUCATIONAL PURPOSE NOT FOR SUGESSTION
resistance breakout Comprehensive Analysis
Short-Term Outlook: Bullish, with the recent +16.66% green candle and volume surge signaling a breakout from the 144-160 INR range. Positive divergence in RSI and MACD buy signals support a rally toward 175-180 INR, but overbought risks could lead to minor pullbacks to 160 INR.
Long-Term Outlook: Very bullish, driven by sector recovery (hospitality demand, RevPAR growth) and company expansion (e.g., Aurika and Keys brands). The stock's beta of 1.07 indicates moderate volatility, with analyst consensus targeting 174-200 INR average. However, high debt (D/E ~1.85) and book value trading at 11.5x warrant caution.
Risks: If the price fails to hold above 160 INR, it could retest 144 INR. Macro factors like GST changes or economic slowdowns in travel could impact.
Buy Strategy: Enter long on dips to 160 INR, with stop-loss below 155 INR. Targets: 175 INR (short-term), 200 INR (medium-term).
Monitor: Next week's candle for confirmation; watch Q2 FY26 earnings for occupancy/ADR updates.
This analysis is derived from the chart and corroborated data; markets are dynamic, so verify with real-time tools.
This is only Educational pattern not for sugesstion
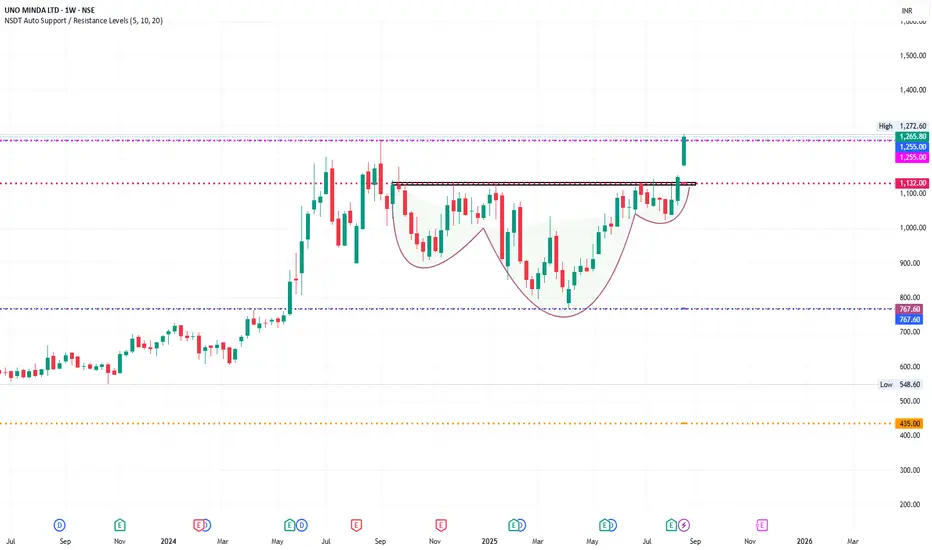
UNOMINDA -CUP & HANDLE BREAKOUT 🔎 1. Chart Pattern
The chart is clearly showing a Cup and Handle Pattern (highlighted).
Breakout has happened above the neckline (~₹1130–1140) with strong bullish candle.
Cup & Handle is a continuation pattern – breakout targets can be measured.
📌 Target Calculation:
Depth of the cup = 1132 (neckline) – 767 (bottom) ≈ 365 points.
Breakout above 1132 → Target = 1132 + 365 = ₹1495 approx.
Short-term resistance: ₹1270–1280 (already touched).
Next zone: ₹1350 → ₹1450 → ₹1500.
🔎 2. Support & Resistance
Immediate Support: ₹1130–1150 (previous neckline).
Strong Support Zone: ₹1050–1070 (previous consolidation).
Major Support: ₹767 (cup bottom).
Immediate Resistance: ₹1270–1280 (tested).
Major Resistance Levels: ₹1350, then ₹1495.
🔎 3. Candlestick / Price Action
Current weekly candle is long green, wide-range, high volume breakout → very bullish.
Closing above ₹1250 is confirmation of breakout.
🔎 4. Indicators (if applied)
RSI (Relative Strength Index): Likely crossing above 65–70 → shows momentum but not yet extreme overbought (healthy breakout).
MACD: Likely bullish crossover with histogram expansion.
Volume: Breakout candle with strong volume confirms institutional buying.
Moving Averages:
Price is above 20W, 50W, 200W EMAs → strong uptrend.
Golden cross already confirmed earlier.
🔎 5. Trend Outlook
Primary Trend (1–2 years): Strong Bullish.
Intermediate Trend (2–6 months): Bullish continuation towards ₹1450–1500.
Short Term (1–4 weeks): May retest ₹1180–1200 before further rally.
📌 Conclusion (Expert View)
✅ Stock has given a Cup & Handle breakout above ₹1130 with strong momentum.
✅ Upside targets: ₹1350 → ₹1450 → ₹1500.
✅ Downside support: ₹1130, then ₹1050.
⚠️ Near-term, RSI may cool off → watch for pullback to ₹1180–1200 as entry opportunity.
👉 Strategy:
Swing Traders: Buy on dips near ₹1180–1200 with SL below ₹1050.
Investors: Can hold for long-term with next target ₹1500+.
This is only for educational pattern not for sugesstion.
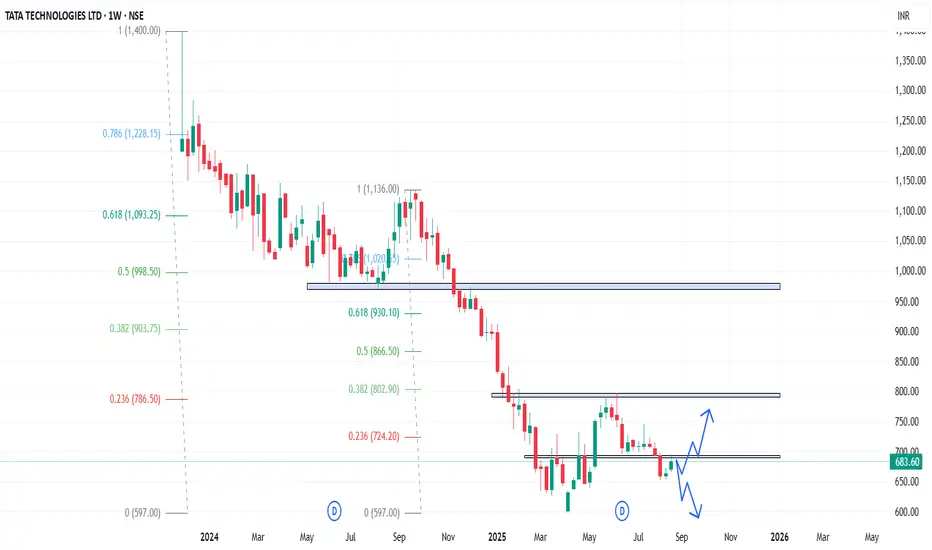
TATATECH - Weekly AnalysisIn the Weekly Chart of TATATECH ,
we can see that, it is at decision making point.
Possible momentums are shown in chart.
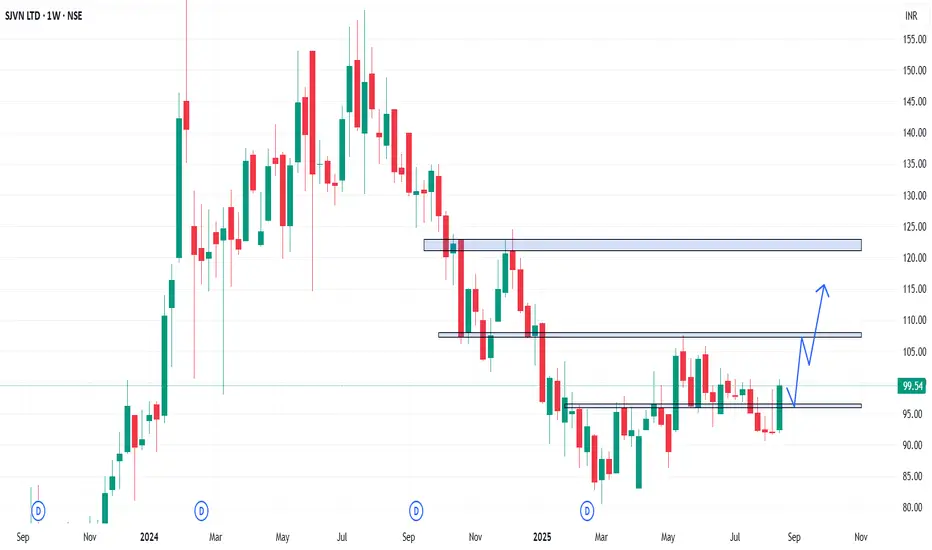
SJVN - Weekly AnalysisIn the Weekly Chart of SJVN ,
we can see that, it has given a strong comeback after the fall.
Let it retest and then enter with SL and targets.
Expected momentum is shown in chart.
EKC - Weekly AnalysisIn the Weekly Chart of EKC ,
we can see that, it has given a small Cup & Handle breakout.
let it retest properly and then enter with SL and targets.
Possible momentums are shown in chart.

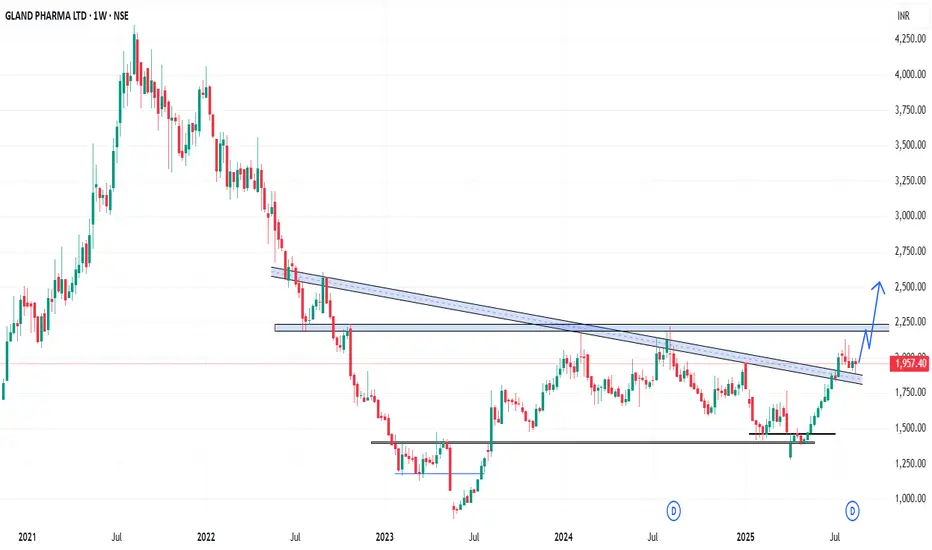
GLAND - Weekly AnalysisIn the Weekly Chart of GLAND ,
we can see that, it has created a Hammer candle on support..
Expected momentum is shown in chart.
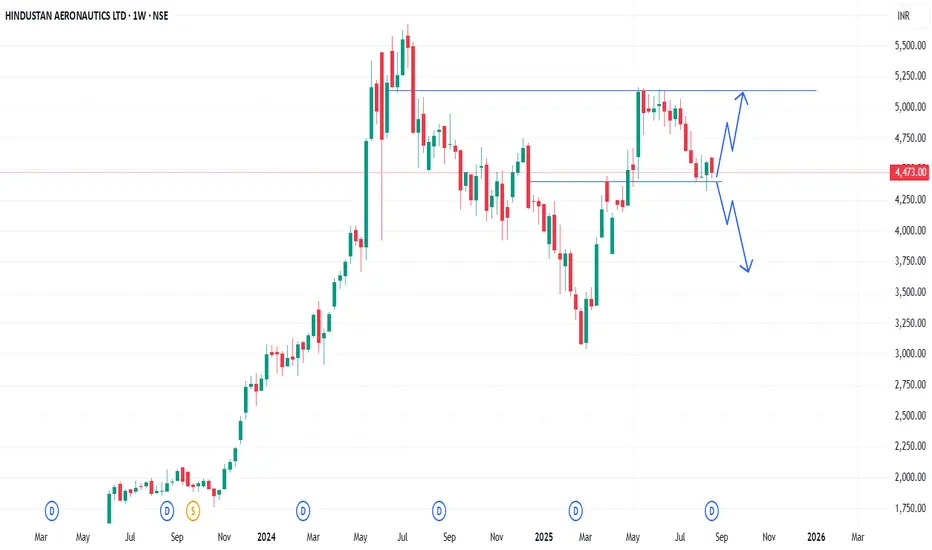
HAL - Weekly AnalysisIn the Weekly Chart of HAL ,
we can see that, it is at decision making point.
Possible momentums are shown in chart.
XPROINDIA - Weekly AnalysisIn the Weekly Chart of XPROINDIA ,
we can see that, it is at decision making point.
Possible momentums are shown in chart.

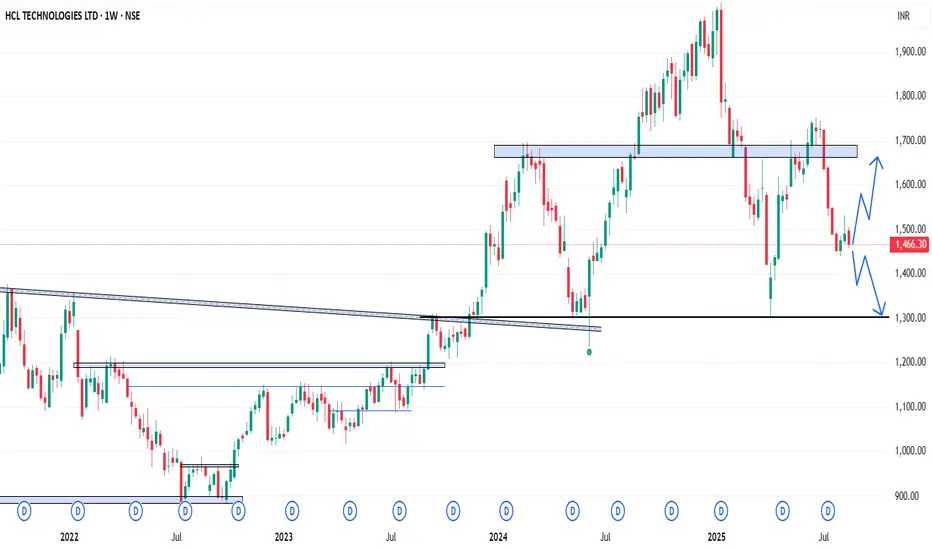
HCLTECH - Weekly AnalysisIn the Weekly Chart of HCLTECH ,
we can see that, it is at decision making point.
Possible momentums are shown in chart.
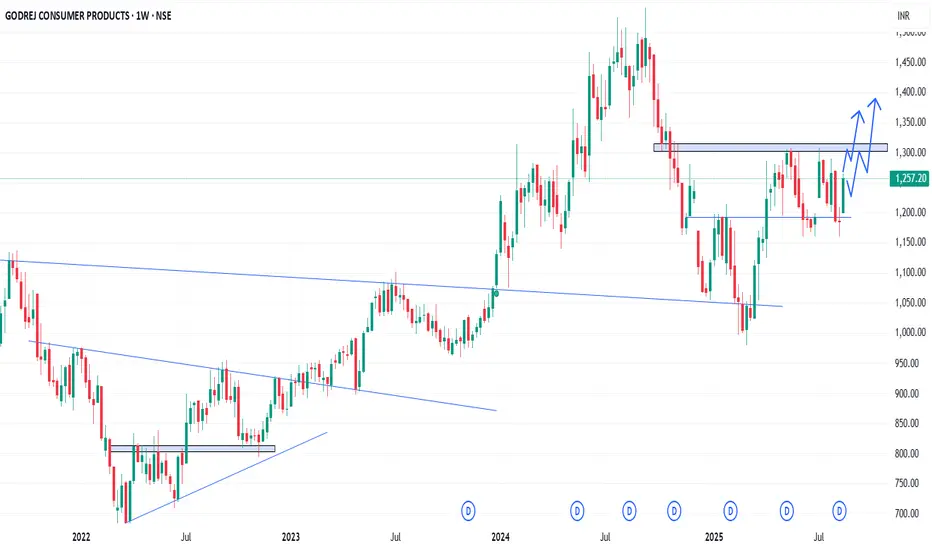
GODREJCP - Weekly AnalysisIn the Weekly Chart of GODREJCP ,
we can see that, it is about to give Cup & Handle breakout.
Expected momentums are shown in chart.