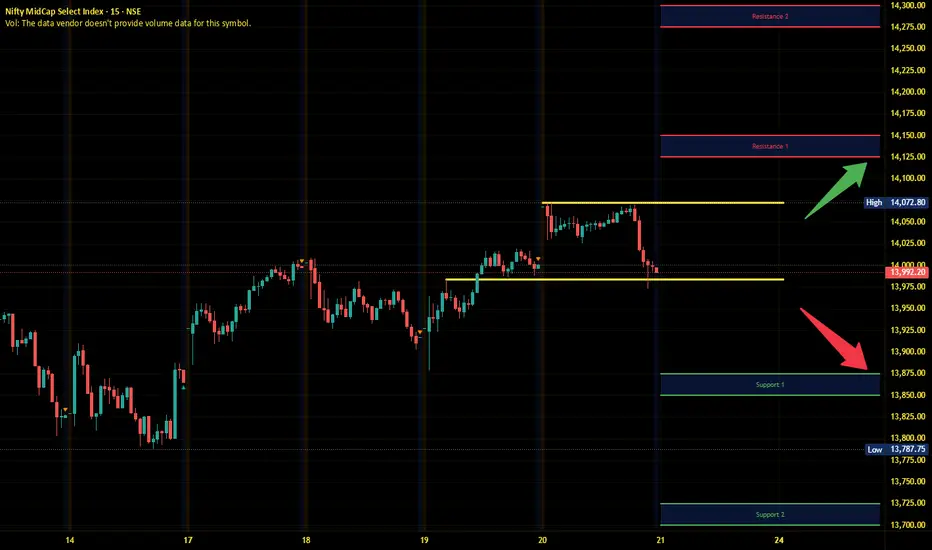
Midnifty Intraday Analysis for 21st November 2025NSE:NIFTY_MID_SELECT
Index has immediate resistance near 14125 – 14150 range and if index crosses and sustains above this level then may reach 14275 – 14300 range.
Midnifty has immediate support near 13875 – 13850 range and if this support is broken then index may tank near 13725 – 13700 range.
Support and Resistance
XAU/USD: Gold Set to Test Downtrend Line!⏰ Timeframe: 30m
📅 Update: 11/21/2025
🔍 Market Context
After adjusting from the 4,107 USD area, gold is moving sideways in the liquidity rebalancing zone – indicating a tug-of-war between the two sides.
The consecutive CHoCH – BOS movements forming around the 4,006 USD bottom show that buying pressure is starting to reappear.
The current decline seems to be just a correction phase, not yet showing enough signs of a complete reversal of the medium-term uptrend structure.
📊 Technical Structure
Downtrend line: continues to act as dynamic resistance – a confirmation area for the recovery trend if broken.
OB Bullish (4,006 USD): confluence with the previous liquidity bottom, is a potential BUY Zone.
Break–Resistance (4,045 USD): the first level to surpass to confirm buying pressure.
OB Bearish (4,086–4,107 USD): short-term supply zone – short-term SELL Zone, may witness profit-taking reactions if the price touches it.
🎯 Market Outlook
1️⃣ Priority Scenario:
– Price may retest the OB Bullish / BUY Zone (4,006–4,025 USD).
– When a clear upward reaction appears, gold is likely to break through the downtrend line, heading towards OB Bearish (4,086–4,107 USD).
2️⃣ Alternative Scenario:
– If the price does not hold the 4,006 USD area, the short-term structure will be invalidated, opening the possibility of retreating to a lower equilibrium area around 3,985 USD.
💎 Key Zones
BUY Zone: 4,006 – 4,025 USD → demand zone confluence OB + liquidity bottom.
SELL Zone: 4,086 – 4,107 USD → potential supply zone if the recovery trend is activated.
🧠 Analyst’s View
Gold is in a short-term accumulation state with signs of capital flow gradually leaning towards the buyers.
The retest phase of the 4,006 USD support area will be the key confirmation for a reversal – retest – continuation phase.
As long as the price stays above this area, the priority remains a buy-the-dip scenario in the short term.
🛡️ Risk Note
The market is operating in a "break or hold" zone – clear confirmation is needed before following the trend.
Analysis is for technical and educational purposes, not trading advice.

XAU/USD Near Breakdown – Bears Eying Liquidity SweepGold remains under pressure after a stronger-than-expected NFP print reduced near-term Fed rate-cut expectations.
The USD stays moderately supported, while weak risk sentiment keeps gold in a cautious, defensive phase.
📊 Technical Snapshot (H1–M30)
Price continues to reject the descending trendline and the supply zone 4,054–4,078.
Lower highs structure intact → bearish momentum remains dominant.
Liquidity pockets sit at 4,013 and especially 3,989, a key downside magnet.
Any pullback toward 4,054 is likely just a retest before continuation lower.
🎯 MMF Intraday Plan
Primary Bias: SELL – follow the trend
Sell 4,054–4,078
SL: 4,090
TP: 4,013 → 3,989 → 3,975
Countertrend BUY (only at deep liquidity):
Buy 3,985–3,990
SL: 3,972
TP: 4,013 → 4,054
⚡️ MMF View
As long as price stays below the trendline and lower-high structure, gold remains in distribution.
A sweep of the 3,99x liquidity zone is highly likely before any meaningful reversal can form.

XAU/USD: Gold's Final Correction Before a Strong Rebound📊 Market Structure – Elliott Wave + SMC
Gold has completed impulse wave 1–5 at the peak of 4,207 USD and is entering an Elliott correction phase in the form of ABC .
Wave A : bottomed at Demand Zone 4,008 – 4,020 USD
Wave B : retraced upwards, creating consecutive Equal Highs and small BoS but has not broken the larger structure
Wave C : is forming, may extend down to the Demand Zone if the price loses 4,030
SMC signals reinforce the scenario of a completed correction:
A series of Equal Lows → the market still has liquidity below to "sweep" towards the Demand Zone
The area BoS – 4,076 is the decisive structure: if not broken upwards, the correction trend continues
The area FVG + Resistance 4,152 USD is the target for a major retracement wave after completing wave C
=> In summary: the market is in the final phase of correction. Once wave C is completed, gold is likely to rebound strongly in the larger trend.
💎 Key Technical Zones
🔹 Demand Zone – Main BUY area
4,008 – 4,020 USD
→ Strong Demand confluence + Elliott wave C + liquidity below.
→ High probability of reversal.
🔹 Reaction Zone – Temporary reaction area
4,030 – 4,040 USD
→ If the price retraces early but hasn't swept the bottom → the correction may still continue.
🔹 Supply & FVG Zones (Strong resistance)
4,152 – 4,207 USD
→ Main target of the retracement wave after the ABC pattern is completed.
🎯 Trading Plan – Vincent’s Execution Map
1️⃣ BUY Setup – According to Wave C (top priority)
Wait for the price to complete wave C at the Demand Zone:
Entry: 4,012 – 4,020
SL: below 3,984
TP1: 4,076
TP2: 4,128
TP3: 4,152
TP4: 4,207
→ This is the main setup of the day, confluence of both SMC + Elliott.
2️⃣ BUY Aggressive – Early buy according to Break of Structure
If the price breaks BoS 4,076 before reaching Demand:
Entry: 4,070 – 4,076
SL: 4,040
TP: 4,128 – 4,152 – 4,207
→ Setup for those who want to catch the impulsive wave early.
3️⃣ SELL Scalp – Small trend (not the main trade)
Only enter when the price retraces to Fibo:
Entry: 4,092 – 4,106
SL: 4,116
TP: 4,040 → 4,020
→ Short-term scalp, aiming to complete wave C.
🧠 Vincent’s View
The overall trend still leans towards Bullish Reversal after correction.
As long as the price holds Demand Zone 4,008 – 4,020 , gold can rebound strongly back to the target of 4,152 – 4,207.
“Liquidity always shows the way – patience is the real advantage.” ⚜️
⏰ Timeframe: 1H
📅 Updated: 21/11/2025
✍️ Analyzed by: Captain Vincent

Flag Found in NZDUSDI was eyeing on NZDUSD for Bullish entry above its major support @ 0.5613.
Then I caught a flag pattern which indicates continuation towards 0.5515. This is also confirmed by its near major support at 0.5514.
The price retraced two times from 0.5514 on 9th April 2025 and 3rd Februrary 2025. It enables me to have a proactive selling below the current Lower Low @ 0.5588 which is the pole of our flag.
Our Stop losses positioned at 0.5617, right above the flag clothing.
I am taking two trades each with 1% risk.
If my first trade target hits then I will move the SL of other trade to BE to ride the same direction with great peace of mind. Happy Trading.
Trade No. 1
Entry (Sell Stop): 0.5588
SL: 0.5617
TP: 0.55518
Trade No. 2
Entry (Sell Stop): 0.5588
SL: 0.5617
TP: 0.55155

XAU/USD: Gold Adjusts, Awaiting Fibo 4,092 Confirmation📊 Market Structure
Gold is moving in the ABC–D–E adjustment pattern after a strong decline from the peak. Current structure:
Wave (C) peaks at the 4,128 – 4,130 USD region and strong selling pressure appears.
The price then creates a temporary bottom (D) but does not touch the Demand Zone at 4,007 USD, indicating the BUY side still has strength.
Currently, the price is in a small upward adjustment phase to form wave (E).
Key points:
The major trend still leans towards an increase as long as the bottom at 4,007 USD is not broken.
The BUY side is looking for a complete structure to continue pushing up to the FVG region.
💎 Key Technical Zones
1. Fibo Retracement Zone — 4,092 USD
Confluence region of:
Fibo 0.5 – 0.618
Adjustment structure (small wave)
→ Suitable for light SELL scalp, according to candle reaction signals.
2. FVG Zone — 4,128 – 4,151 USD
This is a large FVG region, coinciding with the market's "loss cost."
If the price pushes up as expected in wave (E), this is the main SELL region of the day.
3. Supply Zone — 4,207 – 4,210 USD
Extremely strong region, if the price breaks the FVG, it will move to this region.
This is the extended target for the BUY side if the market rises strongly.
4. Demand Zone — 4,007 – 4,020 USD
The strongest liquidity bottom region of the session.
If the price breaks 4,092 and does not maintain structure, gold will retest this region before a major increase.
🎯 Trading Plan – According to the current chart
1️⃣ SELL Scalp – Main scenario
Wait for the price to retrace to the Fibo 4,092 USD region and observe the reaction:
Entry: 4,092
SL: 4,105
TP1: 4,075
TP2: 4,060
TP3: 4,030 (lower FVG)
→ This is a short-term scalp order, suitable for the current weak market.
2️⃣ SELL Setup – FVG Zone
If the price breaks 4,092 and runs up to FVG:
Entry: 4,126 – 4,151
SL: 4,160
TP1: 4,092
TP2: 4,060
TP3: 4,030
→ This is the best SELL region of the day.
3️⃣ BUY Setup – Demand Zone
Only activate if the market drops deeply:
Entry: 4,020 – 4,007
SL: 3,995
TP1: 4,060
TP2: 4,092
TP3: 4,128 – 4,151
→ Buy according to the major trend when the price reaches the liquidity bottom region.
🧠 Vincent’s View
The current market is in a controlled adjustment phase.
Priority:
✔ SELL scalp at 4,092
✔ Beautiful SELL at 4,126–4,151
✔ BUY only activates when reaching 4,020–4,007
The major trend is still waiting to complete the wave pattern to push up to the Supply Zone 4,207 USD.

HDFCLifeHDFCLife has a very long consolidation and going up and down in the range.
Previous wave has a downfall and not it is started with uptrend. So some uptrend it has small correction and ready to move up side.
So, above 770 we can see upside movement till the 800-820.
So, as per technical it's good to accumulate for the long time and wait for the target.
Above 850 we can see a big rally and better return for the next few years.

Best buying Opprtunity in Reliance stock Reliance Industries Announces ₹20,000 Crore Green Energy Joint Venture
Reliance Industries Limited (RIL) has partnered with a leading European firm to invest ₹20,000 crore in India’s renewable energy sector.
The joint venture aims to accelerate the development of solar power, wind energy, and green hydrogen production.
As part of this collaboration, advanced gigafactories will be established to manufacture solar photovoltaic (PV) modules, wind turbines, and electrolyzers, promoting indigenous production under the ‘Make in India’ initiative.
The project is expected to generate thousands of direct and indirect employment opportunities, particularly for engineers, technicians, and skilled professionals.
This strategic partnership will contribute significantly to reducing carbon emissions, aligning with India’s Net Zero Emission targets.
Additionally, the venture will enhance India’s position in the global renewable energy market by integrating next-generation energy solutions, smart grid technology, and AI-driven energy management systems.
Support Levels:
Current Support Zone: ₹1,205 - ₹1,214
Extended Support Level: ₹1,150
Major Support Zone: ₹999 - ₹1,019
Resistance Levels:
Immediate Resistance Zone: ₹1,298 - ₹1,316
First Short-term Target: ₹1,450
Second Short-term Target: ₹1,650
Major Resistance Zone: ₹1,578 - ₹1,611 (near all-time high)
The stock is currently testing the support zone of ₹1,205 - ₹1,214, and if this level breaks, the next downside level to watch is ₹1,150. On the upside, the ₹1,298 - ₹1,316 zone acts as resistance, with potential for further movement towards ₹1,450 and ₹1,650 if strength builds.
LIKE & SHARE , Comment For More Stock Analysis

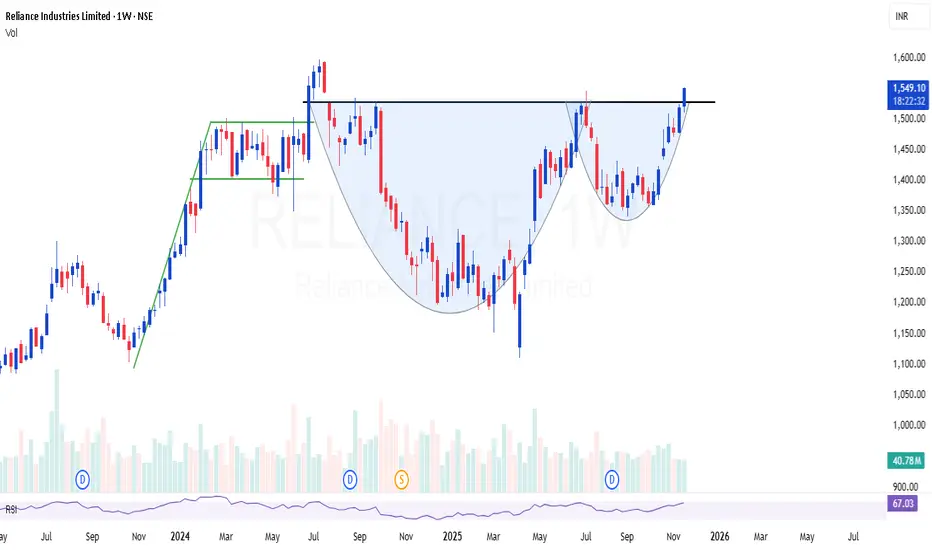
RELIANCE | Perfect cup & handle setup - Looks very strong 30%RELIANCE | Perfect cup & handle setup - Looks very strong for 30% short term
Last time the flag breakout disappointed, but this time Cup & handle will restore the faith i believe
Looks like 2026 is going to be a large cap year !
KOTAKBANK
RELIANCE
TCS
INFY
index heavy weights are super bullish
SBIN looking bullish on the weekly charts. (18/08/2025)State Bank of India is trading around the resistance zone after convincingly breaking the trendline and taking support from the weekly moving averages.
The stock has closed at 826.55 this week gaining 2.77% week on week.
If the stock starts trading above 833, there are chance of it travelling till 860 levels in the coming month.
SBIN has posted good result as well.
Major resistance :- 833, 865
Entry :- Above 833
SL :- Below 818
The stock looks bullish on the daily and the weekly charts.
Wait for the stock to close above the resistance levels on the daily chart frame.

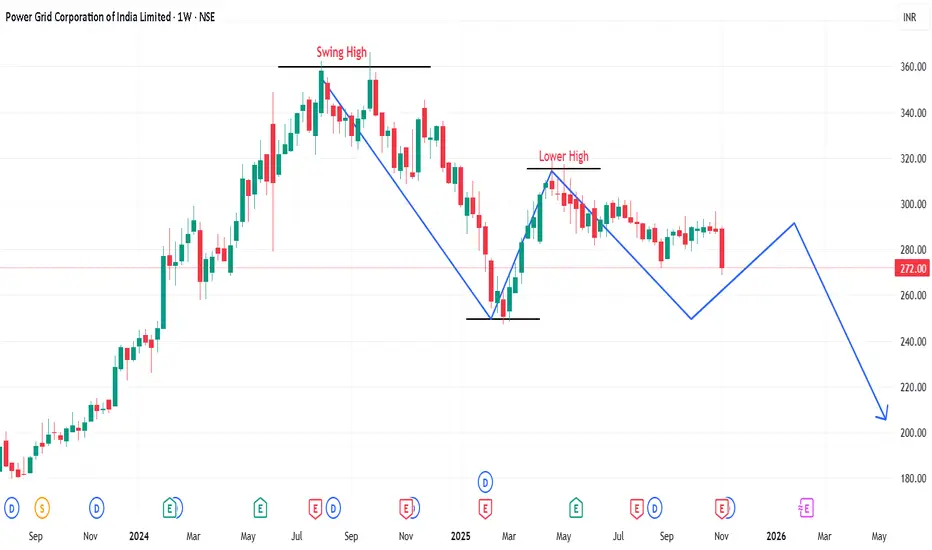
Will Powergrid showing sign of exiting it??Power Grid has been trading in a range for a while and it is showing sign of some weakness.
Major Trend - Down Trend
As there is a BoS of the previous market cycle.
Minor Trend - Sideway to range bound.
The market tends to retest the swing low in the coming month.
Stock has taken a strong resistance from 20 & 50 EMAs. Weekly close is below 100 EMA.
If the stock follow through the downside movement, entry for a sell trade is there with a 1:2 R:R ratio.
Entry :- 270
Stop Loss :- 279
Target :- 259
Last week the index too has supported the fall. If the index remains negative, full quantities can be punched around 270, in case of a retest half quantities can be sold around the retest and the price action near resistance levels while remaining quantity to be entered once the price action is in our favor.
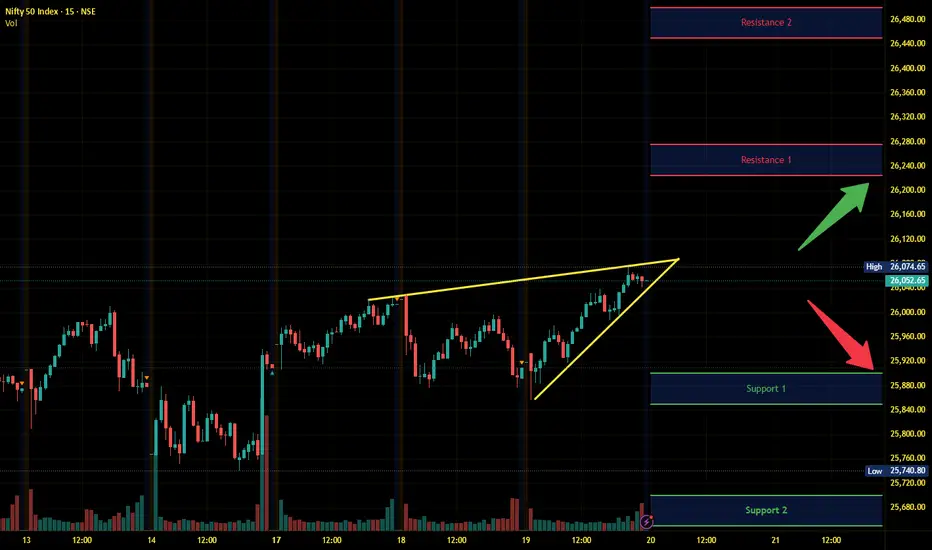
Nifty Intraday Analysis for 20th November 2025NSE:NIFTY
Index has resistance near 26225 – 26275 range and if index crosses and sustains above this level then may reach near 26450 – 26500 range.
Nifty has immediate support near 25900 – 25850 range and if this support is broken then index may tank near 25700 – 25650 range.
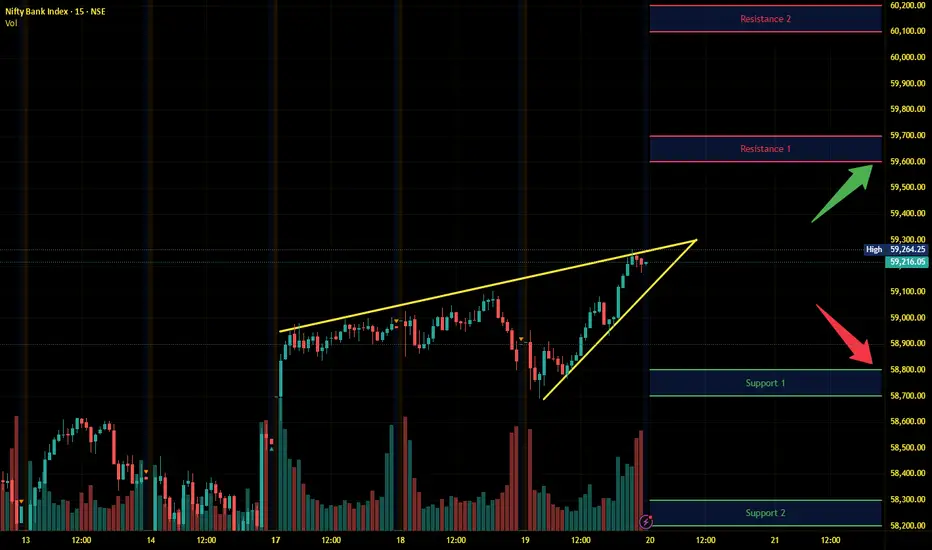
Banknifty Intraday Analysis for 20th November 2025NSE:BANKNIFTY
Index has resistance near 59600 – 59700 range and if index crosses and sustains above this level then may reach near 60100 – 60200 range.
Banknifty has immediate support near 58800 - 58700 range and if this support is broken then index may tank near 58300 - 58200 range.
Finnifty Intraday Analysis for 20th November 2025 NSE:CNXFINANCE
Index has resistance near 27850 - 27900 range and if index crosses and sustains above this level then may reach near 28075 - 28125 range.
Finnifty has immediate support near 27475 – 27425 range and if this support is broken then index may tank near 27250 – 27200 range.

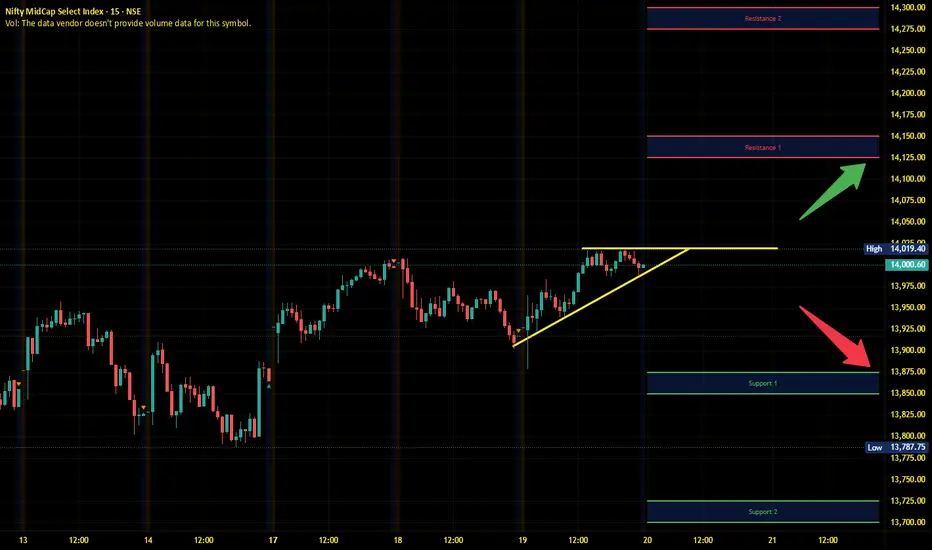
Midnifty Intraday Analysis for 20th November 2025NSE:NIFTY_MID_SELECT
Index has immediate resistance near 14125 – 14150 range and if index crosses and sustains above this level then may reach 14275 – 14300 range.
Midnifty has immediate support near 13875 – 13850 range and if this support is broken then index may tank near 13725 – 13700 range.
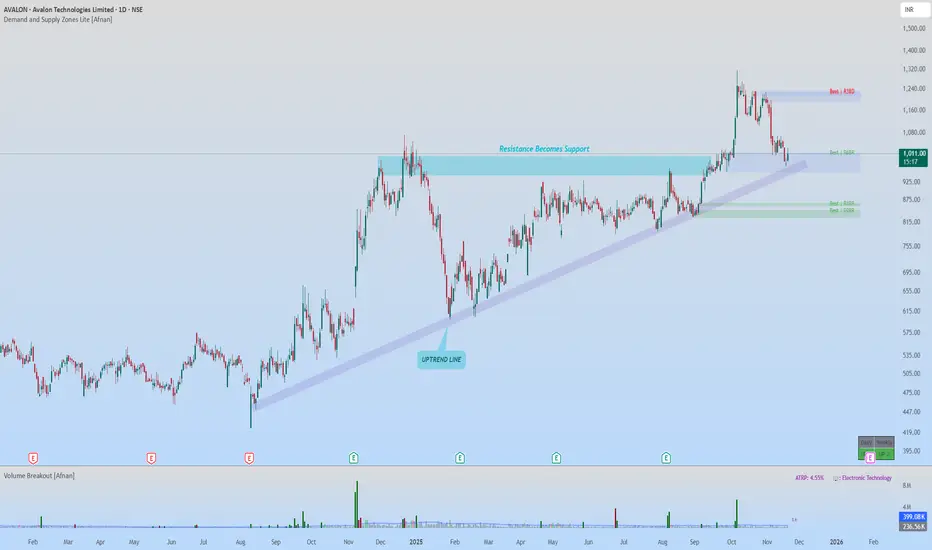
Is Avalon Technologies Preparing for a Major Trend Continuation?The chart of Avalon Technologies is currently sitting at a very interesting location where both advanced Demand–Supply principles and traditional technical analysis are telling a powerful story.
Let’s break the entire analysis into two separate parts so traders of all styles can understand what the chart is silently revealing.
🟢 Advanced Demand & Supply Zone Analysis 🔍
Price formed a clean Rally–Base–Rally (RBR) demand zone earlier, which later pushed the market strongly upward and even broke the all-time high, creating a new high point.
After making this new high, the stock pulled back naturally toward the same RBR demand zone — a textbook return-to-origin move.
As price reached the zone, we can clearly see a reversal candle forming right inside the demand, confirming that sellers are losing momentum and buyers are defending the zone again.
These characteristics indicate that the current decline is not a bearish fall, but simply a normal pullback within a larger uptrend, supporting the possibility of trend continuation as long as the demand zone remains intact.
📌 Curve Analysis Viewpoint
Since price rallied strongly, broke the all-time high, and has now returned to a previously created RBR demand origin:
There are no higher-timeframe supply zones above the current price structure, This positions the stock low on the curve.
Being low on the curve generally supports buying continuation trades, especially when aligned with a fresh demand zone.
📊 Traditional Technical Analysis Perspective 📈
Switching to classical TA, the chart confirms the Demand–Supply story from another angle.
📉 Trendline & Structure Analysis
The stock has respected an ascending trendline for months. Every time price approached it:
Buyers stepped in
higher lows were maintained
Trendline acted as dynamic support
Price is currently reacting near this trendline once again, suggesting structural strength.
🔄 Support Turned Resistance… Now Turned Support
A wide consolidation zone from the previous range, which acted as resistance earlier, has now flipped into support.
This phenomenon—resistance becoming support—is one of the strongest confluences in price action.
📌 Candlestick Behaviour
The rejection candles forming on the pullback indicate that:
Sellers could not maintain control
Buyers absorbed aggressive selling
Wicks show institutional order collection at lower prices
📉 Volume Confirmation
Volume shows a typical pattern seen during healthy retracements:
Strong volume on rallies
Falling volume on pullbacks
Occasional spikes confirming institutional footprints
🧩 Combined Insight From Classical TA
When a rising trendline, a former resistance-turned-support, and bullish rejection candles align together, the setup represents a high probability continuation scenario—as long as the broader trend remains intact.
🌟 Final Outlook 🌟
When evaluated independently, both Advanced Demand–Supply analysis & Traditional technical analysis reach the same conclusion:
“The stock is currently reacting from a strong area of institutional interest within an intact uptrend.”
The Price appears positioned for continuation—unless the nearest strong demand zone is cleanly violated in the future.
🔥 Trading is a journey of patience, discipline, and constant learning — every candle tells a story, keep reading the market with confidence! 🔥
Lastly, thank you for your support, your likes & comments. Feel free to ask if you have questions.
This analysis is strictly for educational purposes only . I am not a SEBI-registered analyst.
Sensex - Expiry day analysis Nov 20The price is sustaining above the resistance at 85k, and the resistance is acting as support now. The pattern we are seeing in the chart is an ascending triangle, which can give a breakout to the upside. For this to work, the price should show bullish strength at the 85k zone.
Buy above 85060 with the stop loss of 84920 for the targets 85200, 85320, 85480 and 85600.
Sell below 84780 with the stop loss of 84920 for the targets 84660, 84520, 84400 and 84260.
Expected expiry day range is 84800 to 85400.
Always do your analysis before taking any trade.

Nifty From Consolidation to Momentum🪔Wishing everyone in the TradingView community a prosperous and bright Diwali 🎇
May this festival bring you clarity like a clean chart, and profits that trend higher with discipline and peace of mind.
Description / Post Body (Technical Analysis View)-:
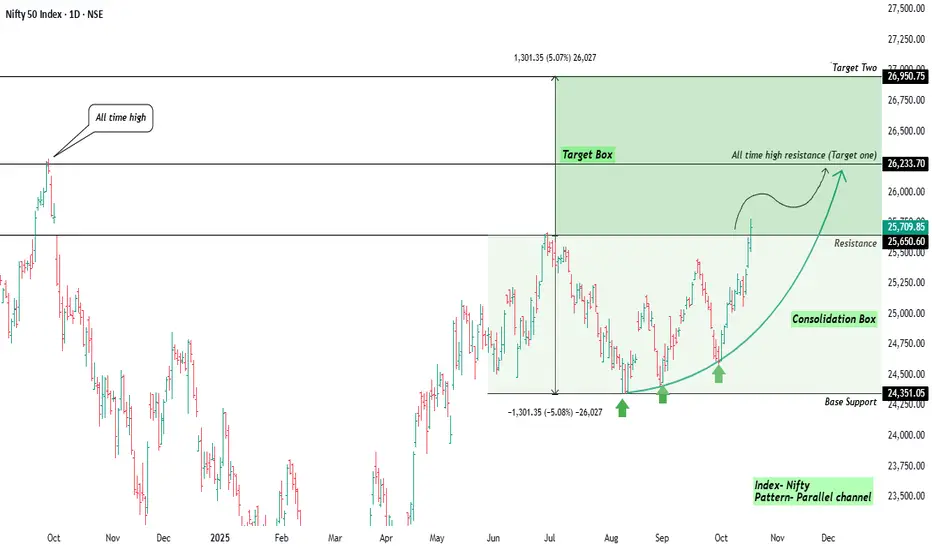
After a few months of sideways movement, Nifty has finally shaped up into a strong parallel channel pattern.
The index built a solid base near 24,350, where price found repeated buying interest forming the foundation of the current up-leg.
The latest breakout above the 25,650 resistance zone now opens a clean path toward the All Time High resistance (around 26,233) which is marked as Target One.
If momentum sustains, the measured move symmetry projects a possible extension toward 26,950 shown as Target Two / Target Box.
The price structure is supported by higher lows, showing renewed strength and confidence from buyers. The curved projection hints that the market might pause slightly near the previous top before any decisive breakout.
This view focuses on chart behaviour and structure, not short-term trading signals — it’s more about understanding how market psychology unfolds through patterns.
Key Observations-:
Pattern: Parallel Channel Breakout
Base Support: ~24,350
Immediate Resistance (Broken): ~25,650
All-Time High / Target 1: ~26,233
Target 2 Zone: 26,950 ±50
Bias: Positive while above 25,000
Regards Amit, Happy Diwali!
XAU/USD: Gold in Downtrend, Waiting for Demand Surge⏰ Timeframe: 30m
📅 Update: 11/20/2025
🔍 Market Context
After the technical rebound at the beginning of the week, gold returns to adjust within the descending channel pattern, indicating that short-term upward momentum is temporarily weakening.
The current structure reflects a rebalancing state after the price was rejected at the 4,127 USD supply zone – coinciding with the 30-minute frame Supply Zone.
However, the Demand Zone below still plays an important role in maintaining the medium-term upward structure.
📊 Technical Structure
Supply Zone (4,127 USD): main resistance area, confluence with the nearest peak – where the price was strongly rejected during the Asian session.
OB Bearish (4,106 USD): short-term supply area, highly likely to be retested after completing the adjustment phase.
Demand Zone (4,013 USD): main support area in the descending channel, also the confluence point between the channel boundary and the lower liquidity zone.
Liquidity Sweep: signal indicating that lower liquidity has been absorbed, opening up the possibility of forming a higher low.
🎯 Market Outlook
High probability scenario:
1️⃣ Price continues to fluctuate within the descending channel, retesting the 4,013 USD Demand Zone.
2️⃣ If a clear price reaction occurs, the market is likely to break the channel, opening up a technical rebound to OB Bearish 4,106 USD or Supply Zone 4,127 USD.
3️⃣ Losing the 4,013 USD area will temporarily invalidate the rebound structure, bringing the price back to a lower balance area around 3,990 USD.
🧠 Analyst’s View
Gold is in a corrective pullback phase – where the market needs to regenerate liquidity before forming a new expansion wave.
A reasonable scenario is sweep – retest – expansion: sweep lower liquidity, retest the supply area, then determine the main trend for the end of the week.
Buyers still have a slight advantage as long as the Demand Zone is maintained.
🛡️ Risk Note
This is a phase of market liquidity accumulation, fluctuations may be erratic.

[long] NIFTY 50 Peak Touch Tone1. Found that proper support zone.
2. Trendline occured very well.
3. Pinbar at trendline.
4. Fibonacci Retracement @ 50%
Results will peak at high marked area.

XAU/USD – Inverse H&S Forming, Gold Eyes Bullish Reversal🔍 Market Context
Early today, Gold dropped nearly 70 points, but immediately rebounded strongly from 4040, signaling aggressive BUY interest and a clear rejection of downside continuation.
On the H2 chart, XAU/USD is shaping a clean Inverse Head & Shoulders pattern — a classic reversal structure that often precedes a strong bullish expansion.
The macro layer for today is packed with high-impact catalysts:
📌 Key Data & Events – 20 Nov
Speech by U.S. President Donald Trump
Barkin (2027 FOMC voter) speaks on economic outlook
Federal Reserve FOMC Meeting Minutes
Williams (permanent FOMC voter) speech
U.S. Unemployment Rate
Non-Farm Payrolls (NFP)
Initial Jobless Claims
➡️ A heavy news lineup capable of triggering high volatility and validating (or rejecting) the reversal pattern.
📊 Technical Analysis – MMF View
Gold bounced sharply from BUY ZONE 4044–4046 with strong volume.
The market structure is creating a complete Inverse H&S formation.
The Neckline Zone 4101–4111 is the key breakout level — clearing this zone opens the door for a full bullish reversal.
Trendline compression + liquidity sweeps show buyers gaining control.
Strategy for today: BUY bias. SELL only for quick scalps.
🎯 MMF Daily Trading Plan
BUY (Priority Setup – Swing / Intraday)
Buy 4046–4048
SL: 4039
TP: 4060 → 4085 → 4100 → 4125
✔️ BUY aligns with the reversal pattern + fresh liquidity shift.
SELL (Scalping Only)
Sell 4146–4148
SL: 4154
TP: 4132 → 4120 → 4110
✔️ SELL only if price taps liquidity at upper supply and rejects clearly.
⚠️ Key Levels to Watch
4101 – 4111 – 4142 → liquidity clusters + breakout confirmation
4029 → major support in case volatility spikes from news
🧠 MMFLOW TRADING Outlook
If Gold holds its corrective pullback and breaks above the Neckline (4101–4111), we may see a strong continuation toward:
4146 → 4187 → 4210+
The Inverse H&S on H2 is a powerful bullish setup — smart positioning favors building long exposure and holding into high-impact events.

TITAN RANGE BREAKOUT WEEKLYTitan breaking a range weekly basis
with good volume last many weeks
bullish RSI above 60
strong q2 earnings,trading at ATH
target 4200 according to pivot point
NO BUY/SELL RECOMENDATION

Bitcoin at Support: Bounce Likely, Trend Still WeakBitcoin has been sliding steadily and has now broken its first major support near 103k. The latest drop completed a clear A-B-C decline, with the final C-wave forming an ending diagonal — a pattern that often signals exhaustion at the end of a move. That’s why the selling pressure slowed as price entered the current demand zone.
Oversold Conditions
The RSI on the daily chart has dropped into deeply oversold territory. This is typically where Bitcoin produces a reaction bounce. It doesn’t confirm a trend reversal, but it does hint that sellers may pause.
What Happens Next
A corrective bounce — the X-wave — is the most reasonable expectation. However, X-waves are usually messy and uneven, not clean rallies.
The key area to watch is 100k–103k .
If Bitcoin cannot reclaim this zone, the larger corrective structure remains in control.
Bigger Picture
The moving averages support this caution. The 50-day and 200-day MAs are close to forming a death cross, which signals weakening short-term momentum relative to the long-term trend. It doesn’t imply a crash, but it does suggest that any bounce may face resistance.
If the X-wave fails below 103k, the next leg — the Y-wave — could drive price toward the larger support region around 72k–75k.
In Summary
The decline looks structurally complete, ending with an ending diagonal.
RSI is deeply oversold -> a corrective bounce is likely.
100k–103k is the make-or-break zone.
Failure to reclaim it keeps the W-X-Y correction active.
The final support zone sits lower, near 72k–75k.
A bounce may come first, but the broader structure still leans bearish unless key resistance levels are regained.
Disclaimer: This analysis is for educational purposes only and does not constitute investment advice. Please do your own research (DYOR) before making any trading decisions.
