SOHBHA Near to Resistance @ 693Closely look at monthly chart its making a trend line coming near to resistance @ 693Rs at same level profit booking can been seen which a drop the price below.
A Good oppourtunity can be seen at 430 level for buying.
Sellers may get active there or it can break check the price action at resistance
note : All analysis are only for study purpose. Make your investment or trading decision at your own risk
Supportandresistancezones

#Niftybank cash : Looks good above 45750#Niftybank cash -Positional call
31.07.2023
Looks good above 45750
Stoploss 45350
Tgt 46250-46300/46700
Cmp 45650

NAZARA TECH - 75% RETURNS!!!BUY - NAZARA TECHNOLOGIES LTD
CMP - Rs. 562
Target - 1: Rs. 630
Target - 2: Rs. 760
Target - 2: Rs. 980
.
.
Technicals - Stock is at support.
.
This is just a view by an expert analyst, please invest at your own risk.
.
Follow me for more!

Bullish Banknifty || Intraday levels for 31/07/23Good Morning Guy's, i hope you all will be doing good in your trading career.
So guy's i have done my analysis on banknifty levels for today. So let's start.
In last two session banknifty and nifty and some other indices has given downside rally like anything. But now they all have come at support zone, Banknifty had taken support in the zone of 45227 to 45311 in last trading session, and this was the support zone as previously price also had taken u turn from same area, I think banknifty will respect this area for today's trading session and then we will see some upside towards 46k again.
Indicator like, MACD, RSI divergence and 200 EMA, Started giving bullish signal. So chances are high we can see a small bullish rally for upside in today's trading session.
Important levels for banknifty:-
Buy above 45518, if levels got sustained at least for 30 mints.
Target we can see in upside 45654/45844/45911
Keep stop loss at 45241
Note:- Guy's Banknifty have a strong support zone in between 45227 to 45311, So If Banknifty go down and take support and make kind of any bullish pattern then definitely grab it, and keep stop loss at 45075. Chances are high that W pattern or inverted head and shoulder pattern we can see, at support zone.
Sale below 45241, if levels got sustained at least for 30 mints.
Target we can in downside 45083/44961
Keep stop loss at 45518.
Note:- Always wait for the best entry or levels to execute trades. And always follow strict stop loss to save your capital from unexpected market direction.
Disclaimer:- Please always do your own analysis or consult with your financial advisor before taking any kind of trades.
Dear traders, If you like my work then do not forget to hit like and follow me, and guy's let me know what do you think about this idea in comment box, i would be love to reply all of you guy's.
Thankyou.

Panacea Biotec will repete the History ?Support and resistance levels: The key support levels are 107.81 The key resistance levels are 134.5.
stock has crossed the 50 day moving average on weekly chart.
first target 178.78 then we will move forward.
Disclaimer:
This is not investment advice. Please do your own research before making any investment decisions

#Jubilant pharma cash : Long above 385.10#JUBILANT PHARMA CASH -Positional call
30.07.2023
Looks good above 385.10
Stoploss 370
Tgt 415-420/480/540
Cmp 381.10

#Iex cash : Good buy above 125.10 & Sell below 116#IEX Cash - Positional call
30.07.2023
Buy above 125.10
Stoploss 118
Target 134-135
Sell below 116
Stoploss 122
Tgt 105-100
(Currently Taken support at 116-118)
Cmp 122.6

Garware Hi-Tech Films Limited Technical Analysis: Is it a Buy?This technical analysis of Garware Hi-Tech Films Limited (GRWRHITECH) looks at the stock's recent price action, technical indicators, and potential trading strategies.
Garware Hi-Tech Films Limited (GRWRHITECH) is a leading manufacturer of polyester films in India. The stock has been on a bullish trend in recent months, and is currently trading above its 50-day and 200-day moving averages. The relative strength index (RSI) is also in the overbought territory, which suggests that the stock may be due for a correction
he following are some of the technical indicators that are used to analyze GRWRHITECH:
Moving averages: The stock is currently trading above its 50-day moving average (MA) and 200-day MA, which is a bullish signal. The MAs are sloping upwards, which suggests that the trend is bullish.
RSI: The RSI is currently at 75, which is in the overbought territory. This suggests that the stock may be due for a correction. However, the RSI has been in the overbought territory before and the stock has continued to rise.

KOLTEPATIL Stock Analysis: Is it a Buy?Kolte Patil Developers (KOLTEPATIL) is a leading real estate company in India. The stock is currently trading above its 50-day moving average and 200-day moving average, which is a bullish signal. The relative strength index (RSI) is also in the overbought territory, which suggests that the stock may be due for a correction.
Technical indicators:
Moving averages: The stock is currently trading above its 50-day moving average (MA) and 200-day MA, which is a bullish signal. The MAs are sloping upwards, which suggests that the trend is bullish.
RSI: The RSI is currently at 70, which is in the overbought territory. This suggests that the stock may be due for a correction. However, the RSI has been in the overbought territory before and the stock has continued to rise.
Bollinger Bands: The Bollinger Bands are currently expanding, which suggests that volatility is increasing. This could be a sign that the stock is preparing for a breakout.
Trading strategy:
Investors who are bullish on KOLTEPATIL could consider buying the stock on a dip to the support level of 382.93. Investors who are bearish on KOLTEPATIL could consider selling the stock on a rally to the resistance level of 425.25.
Technical learning:
The moving averages are a simple but effective technical indicator that can be used to identify trends and support and resistance levels. The RSI is a momentum indicator that can be used to measure the speed and strength of a trend. The Bollinger Bands are a volatility indicator that can be used to identify periods of high and low volatility.
bullish stock
upside potential
support and resistance levels
technical indicators
trading strategy
KOLTEPATIL, stock analysis, technical analysis, trading view, real estate, India

COFORGE W pattern is about to breakCOFORGE W pattern is about to break can look for tp of 4691
with 1:1 risk reward ratio only for long term

Colpal bullishLong Colpal above 1870 for the next target price of 1900++ with a small SL of 1845. A good break out with bullish and volume has been seen on the charts. This is for your educational purpose only.

Torntpower swing tradeLong Torent-power after the BO of resistance area above 642 for the target price of 722 with the SL of 615. On the daily chart, the stock has been forming the W pattern & taking the support of the 50 EMA level. This is for your educational purpose only.

#Tatacomm cash : Flag pattern breakout...#Tatacomm cash
27.07.2023
Looks good on retracement zone 1655-1680
Current price 1727
Target 1950-2000/2200
Stoploss 1550
Cmp 1727.50

#IEX CASH : Good sell only below 115.90 levels.#IEX Cash - Positional call
27.07.2023
Looks good sell below 115.90
Stoploss 123
Tgt 100-103
(Sell only below 115.90)
Cmp 119.95

HINDUSTAN UNILEVER BREAKS DOWN AFTER POOR EARNING RESULTSTECHNICAL ANALYSIS :
ASCENDING RECTANGLE BREAKDOWN -
Price has broken down from the ascending rectangle pattern with confirmation
VOLUME SPIKE -
On 21st july, price has shown huge volume spike with the breakdown indicating strong downward momentum
50D SMA BREAKDOWN -
Price has broken out of the 50D sma after consolidating above it for a long time making it a very strong resistance zone
STRONG SUPPORT-RESISTANCE ZONE BREAKDOWN -
A very strong support-resistance zone level has been broken down by the price which had earlier acted as either strong support level or strong resistance level multiple times
OVERSOLD RSI -
Cherry on the cake is that rsi is oversold indicating very strong momentum behind the breakdown
FUNDAMENTAL ANALYSIS :
EARNING MISS -
On the jun'23 quarter HUL has missed its revenue forecast by ~2.5% & profit forecast by ~4% indicating poor performance by the company
STIFF COMPETITION -
The regional players who had left the market during peak inflation have returned as inflation subsides indicating even higher competition for company
MUTED DEMAND -
Company has said that the demand in rural areas has not yet picked up and consumers are still preferring unbranded alternatives compared to its Tea brand
TP - 2700
SL - 2560

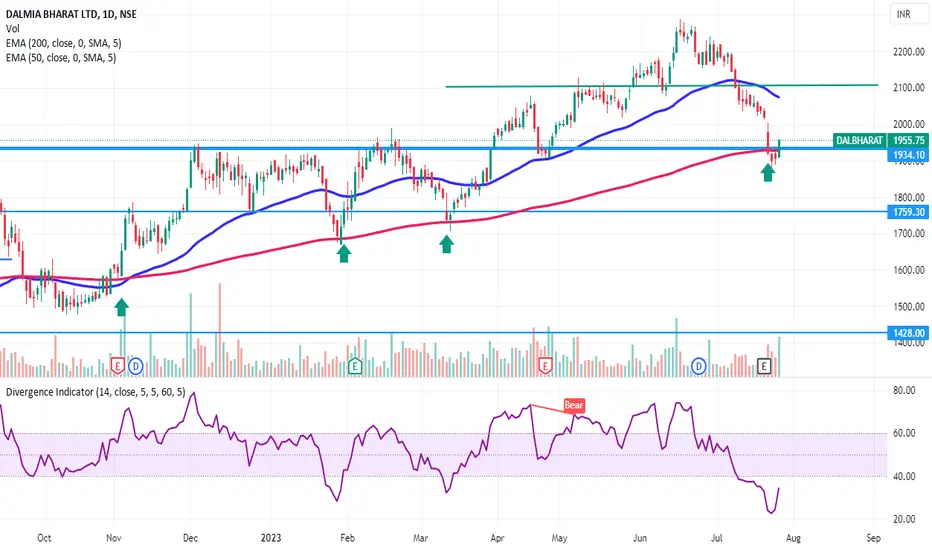
Dalmia bharat a Very High Probability Trade ideaA Very High probability trade of Dalmia Bharat. Long between 1945-1955 for the first target of 2110 & 2250 with SL of 1900. As per the price action pattern we have seen, Whenever stock has touched the 200 EMA the same will bounce back from the level with increased volumes. Watch the levels of the stock in the coming days. This is for your educational purpose only.
AUDUSD portrays bearish triangle on Australia inflation, Fed decAUDUSD fades bounce off 200-EMA, reversing from a one-week-old falling resistance line, as Australian inflation and the Federal Reserve (Fed) Interest Rate Decision decorate the calendar. Given the downbeat oscillators, as well as the Aussie pair’s placement within a two-month-old bearish triangle, the quote stays on the seller’s radar. However, a clear downside break of the stated triangle’s bottom line, close to 0.6690, becomes necessary to convince bears, not to forget the need for a sustained close beneath the 200-EMA level of 0.6730. Following that, the late June low surrounding 0.6595 and the previous monthly bottom of near 0.6485 will gain the market’s attention. In a case where the Aussie pair remains bearish past 0.6485, the theoretical target of the bearish triangle confirmation, near 0.6240, should be logical to expect as the target for the short positions.
On the contrary, an upside break of the seven-day-old resistance line, around 0.6790 at the latest, will precede the 0.6800 round figure and the last weekly high of near 0.6850 could test the AUDUSD buyers. However, major attention will be given to the triangle’s top surrounding 0.6900, a break of which won’t hesitate to propel the Aussie pair toward the 0.7000 psychological magnet. Should the quote stays firmer past 0.7000, the mid-February peak of around 0.7030 may check the upside momentum ahead of directing the bulls to the yearly top close to 0.7160.
Overall, AUDUSD appears slipping off the bull’s radar but the sellers need validation from the triangle breakdown and the fundamentals.

#Titan cash : Looks good above 3033.10#Titan cash -Positional call
25.07.2023
Looks good above 3033.10 and
add more above 3050.10
For target 3100/3150/3200
Stoploss at 2980
Cmp 3029

[1H] M_M Mahindra &Mahindra SELL1. Chart clearly shows Support and Resistance Zone.
2. It takes two supports and one resistance with confirmation.
3. The confirmation candles is Bearish Engulfing candlesticks.
4. Trend is actually going down.
5. Pure Price Action with naked chart.
6. Stop Loss and Take Profit clearly mentioned in the chart.

[1H] SBICARD SBI Cards & Paymen1. Support and Resistance zones correctly plotted in the chart
2. These are called Price Pivot Zones
3. Confirmation Candle such as Bullish Engulfing Candle formed at PPZ level.
4. Take profit and stop loss level correctly placed in the chart.
5. Pure price action.

EURUSD bears have further downside to track, focus on 1.1000 EURUSD stays on the back foot ever since it reversed from a multi-month high the last week, despite the latest corrective bounce. The Euro pair’s south run also conquered the resistance-turned-support stretched from early February and gains support from the RSI’s pullback from overbought territory. Adding strength to the downside bias is the looming bear cross on the MACD. With this, the major currency pair is likely to decline further, suggesting a retest to the previous monthly high of around 1.1010. Following that, the 1.1000 psychological magnet and a two-month-old rising support line, close to 1.0940 by the press time, will test the bears. It should be noted that the 100-DMA acts as the final defense of the short-term pair buyers around 1.0885.
On the contrary, the ascending trend line from February, near 1.1140 at the latest, restricts the immediate recovery of the EURUSD pair. Following that, 1.1200 and 1.1250 may check the Euro bulls before directing them to the latest peak of around 1.1275. In a case where the buyers remain dominant past 1.1275, the 1.1300 round figure may act as a validation point for the rally targeting the previous yearly of around 1.1500. During the run-up, the 1.1400 threshold can also provide an intermediate halt.
Overall, EURUSD is likely to remain bearish as markets await the key central bank meeting decision, including the ECB and the Fed.

GBPUSD sellers should keep eyes on 1.2760 and UK PMIGBPUSD marked the first weekly loss in three while slipping beneath the 100-SMA and an upward-sloping support trend line stretched from late June. Adding strength to the downside were bearish MACD signals and the RSI line’s reversal from the overbought territory. However, the MACD teases a bull cross as the RSI hovers around the oversold territory, which in turn suggests a corrective bounce in the Cable price. The same highlights a convergence of the 200-SMA and a two-month-old rising trend line, close to 1.2760 as the key level to watch as traders await the UK PMIs for July. In a case where the Pound Sterling drops below the 1.2760 support, the odds of witnessing the quote’s slump towards the late June swing low of around 1.2590 can’t be ruled out. However, the June start swing high of around 1.2550-45 and 78.6% Fibonacci retracement of its May-July upside, near 1.2480, can test the bears before directing them to the May month’s low of around 1.2310.
Meanwhile, a convergence of the 100-SMA and the previous support line from late June, close to 1.2870 at the latest, restricts the immediate upside of the GBPUSD pair. Following that, the 1.2960 and the 1.3000 psychological magnet may challenge the buyers before giving them control. In that case, the yearly high marked earlier in the month of around 1.3145 will be in the spotlight.
Overall, GBPUSD is likely to witness further downside but it all depends upon the UK data and 1.2760 break.

#mrf trade idea kindly see the levels on the chart and also read the text carefully
trade on your own risk
