Signs of Trend Reversal in TanlaNSE:TANLA today showed signs of Early Trend Reversal with a Huge Volume Candle. If it Crosses R1 or 200 DSMA it Will Confirm it, Unless 10 DEMA and S1 are broken, the Target can be set near R2 Levels.
NSE:TANLA is a cloud communications provider enabling businesses to communicate with their customers and intended recipients. It is headquartered in Hyderabad, India. It is a global A2P(application to person) messaging platform provider.
📌Thank you for exploring my idea! I hope you found it valuable.
🙏FLLOW for more
👍BOOST if useful
✍️COMMENT Below your views.
Meanwhile, check out my other stock ideas below until this trade is activated. I would love your feedback.
Disclaimer: This analysis is intended solely for informational and educational purposes and should not be interpreted as financial advice. It is advisable to consult a qualified financial advisor or conduct thorough research before making investment decisions.
Supportandresistancezones

Mastering the Intraday Sutra: An intraday trading strategyMastering the Intraday Sutra: A Professional Guide to Trading Indian Markets with Precision
(Adapting Globex Strategy-Inspired Concepts to India’s Unique Trading Hours)
Introduction
The Intraday Sutra strategy is a systematic approach designed for India’s equity/futures markets, inspired by the principles of identifying key price levels (similar to the Globex "high/low" concept) but tailored to India’s fixed trading hours (9:15 AM – 3:30 PM). This strategy leverages prior-day price action, supply-demand zones, and disciplined risk management to capitalize on intraday opportunities. Below, we break down its components for clarity and repeatability.
Strategy Overview
1. Core Instruments
Indices: All indices
Stocks: Nifty 50 constituents for alignment with index momentum
2. Ideal Time Frames
5-minute charts: For granular entry/exit precision.
15-minute charts: To filter noise and align with broader intraday trends.
Key Levels: Prior-Day High/Low & Supply-Demand Zones
1. Plotting Prior-Day High (PDH) and Prior-Day Low (PDL)
Purpose: These levels act as psychological benchmarks.
Method:
- Manually mark PDH/PDL on your chart.
- Use Trading View indicators (e.g., “Previous Day High-Low”) for automation.
2. Identifying Supply-Demand Zones
-Supply Zone:
- Formation: Rally → Base → Drop (RBD) or Drop → Base → Drop (DBD).
- Action: Potential sell zone; price often reverses downward here.
- Demand Zone:
- Formation: Drop → Base → Rally (DBR) or Rally → Base → Rally (RBR).
- Action: Potential buy zone; price often reverses upward here.
Zone Validation Rules:
1. Structure: The “base” (consolidation) must be ≤6 candles; the breakout must show ≥2 impulsive candles.
2. Freshness: Only trade untested zones (no prior price interaction).
3. Zone Merging: Combine overlapping zones or prioritize the one with the best risk-reward ratio.
Entry & Trade Triggers
1. Breakout Confirmation
Short Entry: Triggered when price breaks above prior-day high (PDH) and retests a fresh supply zone.
Long Entry: Triggered when price breaks below prior-day low (PDL) and retests a fresh demand zone.
2. Order Placement
Buy Limit Orders: Set at the demand zone’s proximal line
Sell Limit Orders: Set at the supply zone’s proximal line
Risk Management Framework
1. Stop Loss Placement
Long Trades: Below the demand zone (mechanical rule) or 5% of the Daily Average True Range (ATR) below the distal line of demand
Short Trades: Above the supply zone (mechanical rule) or 5% of Daily ATR above the distal line of supply
2. Position Sizing
Risk ≤1-2% of capital per trade to preserve longevity.
Trade Management & Profit Targets
1. Initial Target: 2:1 Risk-Reward (2R).
Example: If risking ₹1000, target ₹2000 profit.
2. Trailing Stop : Move stop loss to breakeven at 2R, then trail for 3R+ using price structure (e.g., swing lows/highs).
3. Priority: Focus on “A+ Setups” where zones align with higher timeframes (for example a 5 mins zone within a 15 mins zone or higher)
Critical Success Factors
1. Timing is Everything
Optimal Entry Window: 9:15 AM – 11:00 AM (peak liquidity, institutional participation).
Avoid Late Trades: Post-2:00 PM entries often lack momentum for robust risk-reward outcomes.
2. Confluence with Higher Timeframes
- Strengthen signals by aligning 5/15-minute zones with hourly/daily support/resistance/supply/demand zones
3. Event-Driven Volatility
Capitalize on gaps from overnight global news (e.g., US Fed, crude oil prices) or domestic catalysts (RBI policies, earnings).
Tools & Execution
Charting: Trading View for automated PDH/PDL and zone plotting
Mindset: Discipline to avoid overtrading and stick to fresh zones.
Example: The example taken here is on the Nifty 15 mins chart. See how the price broke the previous day's low and reacted nicely from a prior higher quality demand zone. These levels can act as trap levels trapping most of the retail traders and investors on the opposite side of the trade. The price gave a nice bounce from the demand zone and went on to rally to the opposing supply zone giving a greater than 3:1 R:R.
Conclusion
The Intraday Sutra strategy combines technical precision with rigorous risk management, offering a structured way to navigate India’s time-bound markets. By focusing on prior-day extremes, fresh supply-demand zones, and strategic timing, traders can systematically exploit intraday inefficiencies. Remember: Consistency beats complexity. Back test rigorously, refine your process, and let discipline drive profitability.
Final Note: Always validate this strategy in a simulated environment before deploying live capital. Use Trading View Bar Replay functionality to test your strategy.
Markets evolve—stay adaptive!

SMCI | Short Term | 70% ReturnCMP: 42.28
Target: 83
Return: 70%
Time: 1-6 months
Watchout volume and retest in the breakout area (Daily/Weekly/Monthly)

AUDCHF - EXPECTING RESISTANCE BREAKOUTSymbol - AUDCHF
The AUDCHF pair is currently trading near a resistance zone between 0.5712 - 0.5725. The technical outlook remains positive, supported by the ongoing uptrend and the weakening of US dollar. After breaking through resistance, the price may retest the previously breached level, consolidate above it, and establish an interim low, signaling potential for further momentum.
From a technical perspective, attention is now focused on the resistance zone at 0.5712 – 0.5725 A breakout above this resistance zone could trigger further bullish momentum, with the price potentially reaching the trendline resistance at 0.5780 After that, I am expecting the trend to continue, potentially pushing the pair towards 0.5830 and beyond.
Resistance levels: 0.5727 (buy trigger), 0.5780
Support levels: 0.5675
Prior to breaking through the resistance, the currency pair may test the support level at 0.5675 However, a decisive move above 0.5727 could act as the catalyst for further upward movement, with the trend potentially continuing toward 0.5780 - 0.5830 and beyond.

EURJPY - TRADING AT DEMAND ZONESymbol - EURJPY
EURJPY is currently trading within a important support zone. This level has acted as a solid base for price action, offering stability to the currency pair and providing key support for the ongoing trend.
At current market price (CMP 156.50), EURJPY presents a promising opportunity to initiate long positions. The current price level aligns well for potential upward movement, making it a favorable entry point for traders looking to take advantage of the prevailing trend.
However, it is crucial to monitor certain levels for any signs of trend reversal. A breakdown below the 155.25 area could trigger additional selling pressure, and a sustained move below 155.00 would confirm a shift from a bullish to a bearish market structure. In such a case, a retest of the breakdown zone could offer a good opportunity for short positions.
Conversely, if EURJPY continues to recover, we could see a push toward the 158.67 and 160.85 levels, which represent key resistance areas. A successful breakout above these levels would likely signal the continuation of the bullish trend, suggesting further upward momentum.
Key Resistance Levels: 158.70, 159.90, 160.85
Key Support Levels: 156.00, 155.25

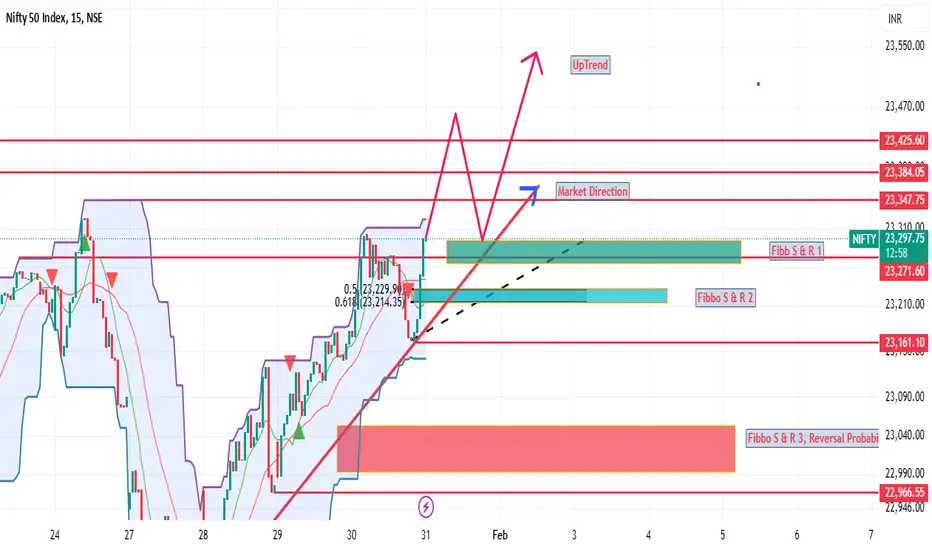
Market Potential Upside, Uptrend, Check Fibbo Levels for Price AMarket current trend is uptrend. For price action kindly check Fibbo levels. Possibility of market rangebound. Overall market trend is bullish.
POLICYBZR near 200ema......Should we BUY?Pro's: POLICYBZR is at 200 Day moving average. It is at Channel support.
It has come to 200d ema supoort for second time.
Caution: It has made double top which isn't great technically. If it breaks channel support, then it may take support at IPO Breakout zone. But need to check Q3FY25 result growth pace to confirm it strength in stock.

Bank nifty showing sign of bounce.Bank nifty is showing divergence on chart. Divergence repeats as like 6Aug 2024 to14 Aug 2014 as per chart. MACD also showing cross over. Bank nifty bounce is expected from here.

BLISSGVS Long Idea...BLISSGVS is consolidating in monthly chart. Taking trade after monthly confirmation (close above resistance) is good for safe trader
Personally I'm following it in daily charts to get a good early entry with some risk.
Lets see how it turns.
NOTE: NO idea of comapny Fundamentals. Just a technical take. Should plan trade with proper risk management.

Support and ResistancePrice taking support on trend channel and also taking support on previous support and resistance zone

IRCTC Long Idea......IRCTC looks good for reversal.
It is forming cup and handle pattern. Currently in Handle structure. 2-3 Quaters down the line it may touch ATH.
Targets are given in chart. SL for safe traders is trendline it was taking support on.
Risk management is Priority. Need to consider broader market conditions before taking position as swing.
I am personally going to average at horizontal support if at all it comes.
NOTE : Fundamentals are good. Top line 3Y sales growth CAGR = 77% , Bottom line 3Y Profit growth CAGR = 90%. Good ROE. No peer to compare P/E as Monopoly & P/E,P/B < median
I'm personally buying it whenerver falls 5-10%.

Ganesh Housing, a strong contender in this bearish Market🔘Ganesh Housing Corp Ltd (NSE: GANESHHOUC)
📈 Technical Setup
The stock shows resilience to the recent market fall, forming a bullish candle on strong volume. Trading above key moving averages (30 & 50 DMA), it is bouncing from critical support levels, signaling potential strength.
Trade Details
Entry: ₹1,368
Stop Loss (SL): ₹1,123 (-17.76%)
Targets:T1: ₹1,507 (+10%)
T2: ₹1,670 (+21.8%)
📊 Risk-to-Reward (R:R): ~1:1.23
Note: Lock in partial profits if the stock moves 8-10% in your favor to manage risk better.
🔘Risk Considerations
⚠️ Against the Trend: This is a counter-trend trade; if the broader market corrects further, the stock could follow and hit SL.
⚠️ Position Sizing: Strict risk management is critical; beginners should avoid it until the market stabilizes above the 200 DMA.
🔘Key Financial Ratios
Liquidity Ratios:
Current Ratio: 2.52
Quick Ratio: 1.51
Profitability Ratios:
Return on Equity (ROE): 41.6%
ROCE: 41.6
Valuation Ratios:
Price-to-Earnings (P/E) Ratio: 22.6
Price-to-Sales (P/S) Ratio: 7.68
📢 Disclaimer: This analysis is for educational purposes only. Consult your financial advisor before making investment decisions.

BORORENEW Long Idea.....Bororenewable looks good for me on Weekly Charts. It broke out weekly trendline resistance.
Broader market strength doesnt look good. So be cautious of Position sizing.
If market drags down bororenew along withit, then stock may settle at 500-540 zone. So this zone might be a good place for average.
NOTE: No idea of Fundamentals. Just a Technical view.

EQUITAS BANK | LONG TERM INVESTMENT 2025Hi Traders,
This is Equitas small fin Bank Monthly Chart.
This Best time to invest for long term with small
SL which is 6 Rupees.
If You want to learn this strategy how to find long term stock Comment Below
Note - This is only for education purpose

Tips is at a Support Level. Watch for long opportunities. Observations:
Fundamentally decent. Now at a support Zone and bouncing. Wait for the entry to trigger. Could add small quantity for long term.
Entry Point:Marked at 741.40, indicating the suggested level to enter the trade.
Stop Loss (SL):Marked at 660, specifying the maximum acceptable loss for the trade.
Targets:T1: Around 902.35.
T2: Around 947.80.
These indicate the levels where you may consider booking profits.
⚠️We are trading against the trend. Please keep that in Mind. Risk management is the key.
This is not a financial advise. Chart shared only for educational purposes.
Potential Scenarios:
The price could:Move up toward the target levels (bullish scenario).
Revisit the stop-loss zone or continue downward (bearish scenario).
Strategy:
Bullish Outlook:If the price breaks above 741.40 with good volume, it could move toward the first target.
Bearish Outlook: If the price closes below the 660.00 stop-loss level, exit to prevent further losses.

ANGELONE price action analysisANGELONE Chart analysis. It is coming near trendline support in weekly timeframe.
It is not a buy or sell, Just analysis to check where price might take support and then need to take action. It is in my Watchlist to follow and will enter when it is right time.
Note: Q3FY25 results are bit dull due to FnO regulation changes recently. Need to wait for Concall to know what's their guidance going further.

Parallel Channel consolidation in TitagarhNSE:TITAGARH A parallel channel has been formed in Titagarh
A double confirmation buy can be triggered when the price crosses EMA 44 with trailing SL.
The rest of the explanation of the targets and SL has been marked in the chart.

Astec Life Early Signs of ReversalNSE:ASTEC Early Signs of Reversal can be seen, Buy When 200 DSMA is closed below CMP and Keep 10 DSMA or S1 as Stop With Target of R1 and R2.
📌Thank you for exploring my idea! I hope you found it valuable.
🙏FLLOW for more
👍BOOST if useful
✍️COMMENT Below your views.
Meanwhile, check out my other stock ideas below until this trade is activated. I would love your feedback.
Disclaimer: This analysis is intended solely for informational and educational purposes and should not be interpreted as financial advice. It is advisable to consult a qualified financial advisor or conduct thorough research before making investment decisions.

USOIL ORDER BLOCK | LONG TRADEUSOIL ORDER BLOCK | LONG TRADE
Hi Traders,
This is Usoil 1hr + 4Hr OB according to smc
we will see buying from this level.
Best time to take trade is 5 min CHoCH
Only for education Purpose
Give like, SHARE , FOLLOW FOR MORE UPDTAE

Technical Analysis for Aurobindo Pharma (AuroPharma):
Trade Type: Swing trade for 1 month
Key Signals:
Waiting for breakout
Near support zone and 200 DEMA
RSI bullish divergence observed, signaling potential upward momentum
Targets:
Target 1: ₹1396
Target 2: ₹1515
Monitor closely for breakout confirmation. Ensure risk management by planning an appropriate stop loss.
📌 Disclaimer: This analysis is for educational purposes only and not investment advice. Please consult a financial advisor before making any trading decisions.
#AuroPharma #AurobindoPharma #TechnicalAnalysis #RSIDivergence #SwingTrade #200DEMA #SupportZone #BreakoutTrading #StockMarket

Bounce back from Support in EmamiNSE:EMAMILTD Bounceback is happening from the current level of support of 600.
Tgt for another 200 points with SL at swing low

Gold in Bearish zone Billow 2636 Price Level According to my Analysis Gold will down approx. 2400 Price Zone in 1-3 months , and then continue its bullish trend .
Billow 2636 Price Level Gold Bearish .
Like 2636 is strong Ressistance .
Lets see what happens (Gold Sell Target 2400 somthing_

Hardwyn India - Possible PathStock at a very crucial area
Trend line support at 28.5 - 29
Also forming a wedge pattern
Breakout / Breakdown Possible
Upside stops 32 / 42.5 / 47
Downside 26 and more
