Daily Analysis Nifty: 31/10/25Too much volatility in the prices of Nifty.
Right now, the greed zone is active in the market. 25770 is a subtle support level, but the bearish market is still not around the corner unless it is trading above 25400. 300 points of consolidation are evident. Any clear trend will be on the break of either side.
Technical Analysis
Secret Observations That Made Me a Better TraderDiscover the hidden market manipulation techniques institutional traders use to control price action, plus my observations, these secret patterns helps make you a better trader and get more observant using trading view tools and charts
Data used is 3 months old . This content is for educational and entertainment purposes only.
Observing Charts Smarter: Learning Price Action Made EasyIn this video, I share how simple trading observations and “talking to the charts” can improve your understanding of price action and trade movements. By reviewing Apollo’s chart, we explore how breakout patterns, retracements, and higher highs unfold in real time. The goal is not prediction, but sharpening your ability to read market structure, avoid wrong entries, and reduce big drawdowns—ultimately helping you become a more disciplined trader.
Exhaustion vs Runaway Gap |How to Catch Trend and Spot ReversalsGaps often confuse traders — some lead to powerful trends, others signal trend exhaustion. In this video, I break down the key psychological and technical differences between Runaway Gaps and Exhaustion Gaps, with real examples and clean explanations.
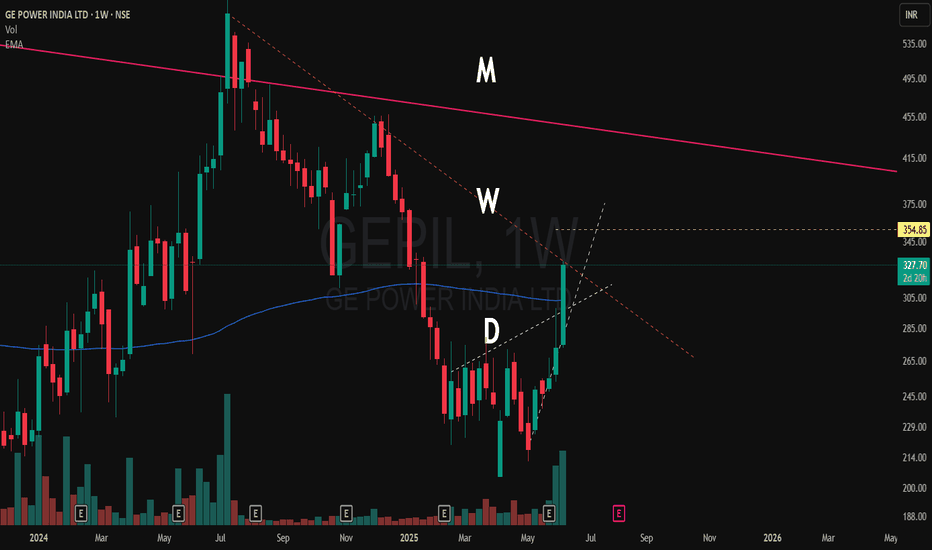
Multi time frame charting explained in GEPILI make educational content videos for swing / positional trading
Management and PsychologyManagement psychology explores how psychological principles and theories can be applied to understand and improve organizational performance. It focuses on human behavior, motivation, and decision-making within a workplace context, helping managers develop more effective strategies for leading teams and achieving business goals.
Option TradingIf you're looking for a simple options trading definition, it goes something like this: Options trading gives you the right or obligation to buy or sell a specific security on or by a specific date at a specific price. An option is a contract that's linked to an underlying asset, such as a stock or another security.
How we trade in option chain ?To trade using an option chain, you first need to understand its structure and the information it provides. Option chains are organized by strike prices, expiration dates, and whether they are call or put options. You then decide whether to buy (long) or sell (short) a particular option contract, specifying the strike price, expiration date, and quantity. Finally, you submit your order through your brokerage platform.


