Practical Study On Supply and Demand Concept NSE:ICICIBANK
Most traders fail at Supply & Demand for one simple reason:
They draw zones…
but don’t understand context, intent, or execution.
Zones don’t make money.
Decisions do.
📘 Supply & Demand – Practical Application
All the charts are annotated in very much details no description is needed so study these charts in detail and that will be self-explanatory.
1.
2.
3.
4.
5.
6.
7.
8.
9.
10.
11.
12.
13.
14.
15.
16.
Keep Learning,
Happy Trading.
Trading!

This Multi time frame Trick will save you from FAKEOUTSIn this video I am showcasing a daily, weekly and monthly time frame combination - also sharing a trick which can save you a lot of money from those regular sized fakeouts .
Charts used are 3 months old in this video and video is purely educational based .

Weekly Analysis Nifty....Here is the weekly analysis of nifty.. please try to learn from the various topics discussed in it..
Please do follow me if you liked the idea💡...
Disclaimer ⚠️: This analysis is for educational purposes only and does not constitute investment advice. Please do your own research (DYOR) and check with your financial advisor before making any trading decisions ⚠️⚠️.

Part 3 Learn Institutional Trading How Option Trading Works
When a trader buys a call option, they expect the price of the underlying asset to rise above the strike price before expiration. If the price rises significantly, the trader can either exercise the option or sell it in the market for a profit. Similarly, buying a put option reflects a bearish view, where the trader expects prices to fall.
Option sellers, on the other hand, earn income through the premium received. However, selling options involves higher risk, as losses can be substantial if the market moves sharply against the position.

Chart Patterns What Are Chart Patterns?
Chart patterns are recognizable formations created by price movements on a chart. They develop over time and help traders identify trends, reversals, or continuation of trends. Chart patterns are usually formed by support and resistance levels, trendlines, and consolidation phases.
Types of Chart Patterns
Chart patterns are broadly classified into:
Reversal Patterns
Continuation Patterns
Bilateral (Neutral) Patterns

XAUUSD H1 Main Trend for the Weekend
Gold failed to confirm a sustainable upward momentum after yesterday's price reaction, prioritizing a short-term adjustment scenario before reassessing the trend
PRIORITY SCENARIO
Strategy to sell based on reactions at large volume areas, suitable for the current short-term structure
Focus sell area: 4332 – 4342
Technical basis: these are areas concentrated with volume according to the Volume Profile, where price is likely to show distribution reactions after a weak recovery
Expected movement: price recovers to the large volume area for distribution, then continues the adjustment phase
Daily target:
Heading towards the 4275 area, coinciding with the Fibonacci retracement area and underlying support
Position management:
Sell should only be held short-term. If the price surpasses and stabilizes above 4342, risk should be reduced and avoid holding sell orders.
ALTERNATIVE SCENARIO
Monitor price reactions at deeper support areas to reassess trading opportunities
Strong support area: around 4275
Technical context: this is the convergence area between structural support and Fibonacci retracement, likely to show defensive buying force
Expected movement: if the price reacts well at this area, the market may enter a re-accumulation state
MAIN REASON
On H1, the previous upward phase failed to maintain a clear upward structure, indicating weakening buying force
Volume Profile helps identify the 4332 – 4342 areas as advantageous entry points for the sell reaction scenario
The 4275 area serves as a reasonable adjustment target in the context of a typically momentum-lacking weekend market
MACRO CONTEXT AND MEDIUM-TERM OUTLOOK
While short-term fluctuations lean towards adjustment, major institutions still maintain a positive outlook for gold in the medium and long term. Goldman Sachs forecasts gold prices could reach $4,900/oz by the end of 2026, supported by strong buying demand from central banks and positive impacts from the Fed's interest rate cut cycle.
This suggests that short-term declines may be more of a technical adjustment rather than a reversal of the long-term trend.

XAUUSD (H1) – Friday Weekend
Lana prioritizes the adjustment phase towards the POC area, looking to Sell in the liquidity zone 💛
Quick Summary
Context: Friday, the market often tends to take profits and sweep liquidity before the week closes
Monitoring Frame: H1
Main Viewpoint: Prioritize a decrease during the day (adjustment phase)
Key Point to Note: 4308 has reacted multiple times, a sensitive point in the structure
Market Context
The weekend is usually a time when the cash flow is “lighter” and price behavior tends to lean towards profit-taking. Therefore, an adjustment phase to gain more liquidity is the scenario Lana prioritizes today.
From a medium-term perspective, some large institutions still maintain a positive view on gold. However, in intraday trading, Lana still prioritizes following the current price behavior and trading according to the liquidity zone.
Technical View H1
On H1, the price is fluctuating around the accumulation zone, and the POC/VAL area indicates this is a market zone that has been “back and forth” for quite a while. When the price returns to these areas, there is usually a clear reaction.
The 4308 area is noteworthy because the price has reacted multiple times, so this is a point that could determine whether the adjustment phase continues.
Today's Trading Scenario
Main Scenario – Sell at POC/VAL area (large liquidity)
Sell: 4335 – 4340
Lana prioritizes waiting for the price to rebound to this area to sell according to the adjustment phase. This is a large liquidity zone, suitable for finding a downward reaction during the day.
Alternative Scenario – Buy scalping at near support
Buy: 4284 – 4289
This Buy order is only for scalping when the price hits the support area and a bounce reaction appears. If the market continues to be weak, Lana will not hold the Buy for too long.
Session Notes
If the price continues to be rejected around resistance areas and cannot surpass the supply zone, the adjustment scenario will have an advantage.
For Friday, Lana prioritizes light trading, quick closing, avoiding holding positions too long over the weekend.
Lana's Notes 🌿
Each scenario is just a probability. Lana always sets a stop loss first, chooses the appropriate volume, and is ready to skip if the price does not reach the waiting area.

HINDUNILVR: Smart Money Accumulation Zone After CHoCH?📘 HINDUNILVR (HUL) — Technical Analysis | Structure Shift & Golden Retracement Setup
(Timeframe: Daily)
HINDUNILVR is currently trading around ₹2,265 after a prolonged corrective phase.
The chart reflects a Change of Character (CHoCH) followed by a controlled retracement into a high-probability demand zone, where the next directional move is likely to emerge.
🔍 Market Structure & Price Action
The stock previously witnessed a strong bullish extension, reaching the 113%–128% Fibonacci extension zone, indicating an overextended move.
Post extension, price showed loss of bullish momentum, leading to a CHoCH — a clear signal of shifting market control.
CHoCH highlights early trend transition and often leads to range-bound or corrective price action, rather than an immediate trend reversal.
📌 CHoCH helps traders prepare for structural transitions before confirmation from higher highs.
📐 Fibonacci & Wave Context
The decline from point A to B appears corrective, not impulsive.
Price has now entered the Golden Retracement Zone (50%–78%) of Wave A.
This zone is typically where Wave B or Wave 2 attempts to develop.
Institutional participants often accumulate positions here due to favorable risk–reward.
📌 Failure to hold this zone often results in a deeper correction or trend reversal.
🎯 Key Levels from the Chart
Major Demand Zone: ₹2,230 – ₹2,200
Invalidation Level: Day close below ₹2,200
First Target: ~₹2,630 (≈ 78% retracement of Wave AB)
Second Target: ₹2,826 – ₹2,888
🧭 Trading Strategy (Swing / Positional)
Look for long opportunities only inside the ₹2,230–₹2,200 zone.
Prefer confirmation signals such as:
– Bullish rejection wicks
– Higher-low formation
– Minor CHoCH on lower timeframes
Avoid aggressive entries without confirmation.
🛑 Risk Management
Strict stop loss: Day close below ₹2,200
A close below this level indicates weak demand and opens the risk of extended downside correction.
Partial profit booking recommended near Target 1.
Trail stop aggressively if price sustains above ₹2,630.
📚 Educational Notes
Golden Retracement (50%–78%) is where institutions seek value-based entries.
CHoCH ≠ Trend Reversal — it signals momentum loss, not instant bearishness.
Confirmation always comes from structure + demand holding, not prediction.
🔮 Probable Scenarios
Bullish Case:
Holding above ₹2,200 → Base formation → Gradual recovery toward ₹2,630 → ₹2,826–2,888.
Bearish Case:
Day close below ₹2,200 → Demand failure → Deeper corrective phase.
📌 Conclusion
HINDUNILVR is positioned at a critical inflection zone.
Risk is clearly defined, while upside potential remains asymmetric.
This is a wait-for-confirmation accumulation setup, not a chase trade.
⚠ DISCLAIMER
I am not a SEBI-registered analyst.
This analysis is for educational purposes only and should not be considered investment advice.
Always use your own analysis and risk management.

MARAL Execution Example — WIFUSDT.P 1H (Short 0.01234 → 0.01196)MARAL Execution Example—Discretionary SHORT (Entry 0.01234 → Exit 0.01196) in Binance
This post is not about prediction. It’s about execution quality — how MARAL guides a trader before entry, during the hold phase, and into the exit decision using context + risk controls.
Trade Snapshot
Position: SHORT (manual)
Entry: 0.01234
Exit: 0.01196
Move captured: ~0.00038 (≈ 3.1%)
1) Pre-Entry: Why MARAL allowed the trade
Entry Checklist (Permission Layer)
MARAL’s checklist was green across core pillars:
HTF Alignment: OK
Structure: OK (Bear Structure)
Momentum: OK
Volatility (ATR + ADX): OK
Liquidity Confidence: WARN
Score: 93 / 65 → ENTER SHORT
Important: “Liquidity = WARN” is not a “no-trade.”
It means nearby liquidity pools exist, so the trade may include wick risk / stop-sweep behavior, and execution must be disciplined (no FOMO entries, no oversized risk).
2) Signal vs Framework: What the Master Engine confirmed
MARAL didn’t just show “short.” It confirmed the internal quality of the short context:
Last Signal: SHORT
Direction: Bearish
H1 / H4 / Daily Bias: Bearish alignment
Structure: Bear Structure
Short Score: 93 (A++)
Trend Probability: 93%
Reversal Probability: 7%
This is the key difference:
MARAL doesn’t “tell” you to trade — it grades the environment so your entry is not emotional.
3) Execution Board: What happened AFTER entry (the real value)
Post-entry, the Execution Board shifted into execution guidance:
Execution State (Holding Logic)
Trade Status: VALID
Market Phase: CONTINUATION
TP Probability: HIGH
Obstacle Ahead: NO
Exit Pressure: LOW
Momentum Health: STRONG
Score Trend: Stable / Improving
Active Window: ON
Action: HOLD
Trade Age: FRESH
This is execution intelligence:
VALID + CONTINUATION = trend conditions still supportive
Obstacle Ahead: NO = fewer immediate barriers in path
Exit Pressure: LOW = no urgent reason to panic-exit
Action: HOLD = stay in trade as long as structure remains intact
4) Risk State: Why “OVEREXTENDED” matters even in a VALID trade
MARAL showed:
Risk State: OVEREXTENDED
This does not mean reversal.
It means:
“The move is mature / extended relative to volatility. Continuation can happen, but holding requires risk-managed behavior.”
Execution behavior under OVEREXTENDED:
Don’t add to position (no stacking late)
Protect profits (tighten or trail logically)
Expect wicks/pullbacks even if trend remains bearish
Prefer partials / controlled exits near objectives
5) My exit decision (0.01196): Execution > greed
Even though MARAL was still VALID / HOLD, I chose to exit at 0.01196 to:
Lock a clean capture (~3.1%)
Respect OVEREXTENDED risk
Avoid giving back profit during possible liquidity reaction / mean-reversion
This is exactly what MARAL is designed for:
Stay in when the environment is valid — but exit like a risk manager, not like a gambler.
6) What would invalidate the HOLD (how MARAL helps you stay objective)
For me, a HOLD becomes questionable if MARAL starts flipping these:
Trade Status: VALID → RISKY/WEAK
Exit Pressure: LOW → RISING
Obstacle Ahead: NO → YES
Momentum Health: STRONG → WEAK
Score Trend: IMPROVING → DETERIORATING
Active Window: ON → OFF
That’s the execution framework in action: no emotions, only conditions.
Due to TradingView attachment limitations, the full chart is shared via the link below.

XAUUSD H1 Trading with Volume Profile Ahead of CPI RiskXAUUSD H1 Trading with Volume Profile Ahead of CPI Risk
Gold is slowing down as the market awaits news and liquidity is fragmented, so prioritize trading according to Volume Profile zones to choose advantageous entry points instead of chasing prices.
PRIORITY SCENARIO
Strategy to buy at POC and VAL zones according to Volume Profile, suitable for a medium-term perspective.
Buy zone: 4314 – 4317
SL: 4307
TP: 4328 – 4345 – 4363 – 4370
Technical context:
On H1, the price is accumulating and reacting around the value area. The 4314–4317 area is the POC and VAL zone, often a liquidity attraction point and likely to see buying pressure if the structure maintains support.
Expected movement:
Price holds the 4314–4317 zone, absorbs short-term selling pressure, then rebounds to the above TP levels. When approaching 4345, monitor reactions as this is an area prone to selling pressure.
Position management:
If the price quickly rises but fails to hold above 4328, consider reducing risk. If the price clearly breaks below 4307, prioritize stopping the buy scenario and wait for a deeper zone.
ALTERNATIVE SCENARIO
Sell scalping strategy at short-term resistance zone, higher risk as the larger trend still favors buying.
Sell scalping zone: 4343 – 4346
SL: 4353
TP: 4325 – 4310 – 4290
Technical context:
The 4343–4346 area is a sell scalping zone on the chart, suitable for short-term trading when the price rebounds to resistance and clear rejection signals appear.
Note:
Sell should only be a scalping order. Do not prioritize holding long sell positions if the market is still in an accumulation phase awaiting news.
MAIN REASON
Volume Profile shows that POC and VAL zones are advantageous entry points during a sideways market lacking a clear trend.
The 4314–4317 zone acts as a value support area for finding buy points, while 4343–4346 is suitable for sell scalping when the price rebounds to resistance.
When the market awaits news, the likelihood of liquidity sweeps increases, so trading by zones will be more effective than chasing candles.
MACRO CONTEXT AND CPI DATA
The upcoming US CPI release during the North American session will be the main variable guiding Fed policy expectations, directly impacting USD and gold. Ahead of data risk, dovish expectations from the Fed are causing USD to lack strong upward momentum, but volatility may spike suddenly at the time of the news release, creating spikes and sweeping SL on both ends.
RISK MANAGEMENT AND MONITORING
Do not open orders when the price is between zones and has not reached the exact levels of 4314–4317 or 4343–4346.
Prioritize reducing volume before CPI or only maintain positions that are already profitable and manage tightly.
Focus on observing price reactions at POC VAL and sell scalping zones, as these are decisive points for short-term direction.

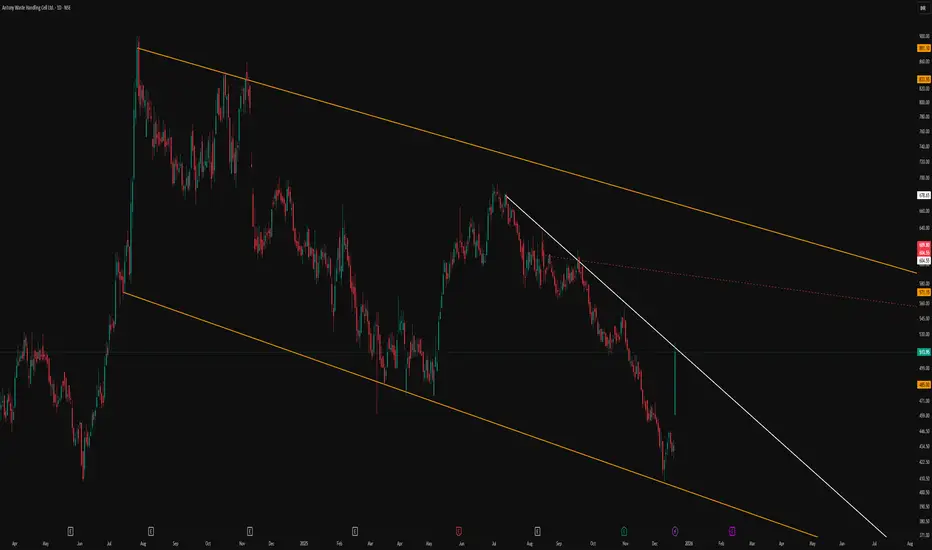
Classic Descending Channel With Clear Structural LevelsThe primary feature of this chart is the broad descending parallel channel marked by the orange lines, which frames the entire corrective phase in a neat, orderly manner. Price has repeatedly respected both the upper and lower boundaries, reinforcing the relevance of this channel as a dominant structure.
A trend‑changing resistance line is drawn in white, connecting swing highs and visually separating the prevailing downtrend from any potential shift in behavior. This line serves as a clear reference for how price has reacted to supply zones within the channel, without implying any future breakout or directional bias.
The red dotted line acts as an internal, hidden line derived from prior price interaction, helping to map out the internal rhythm of the move. Overall, the chart is intended purely as a structural illustration of how price respects channels and internal reference lines, without any forecast or trade signal.
Mastering Complex Techniques for Consistent Market ProfitsAdvanced Option Strategies
Options trading goes far beyond simple call buying or put selling. While basic strategies help beginners understand direction-based trades, advanced option strategies are designed for experienced traders who want to profit from volatility, time decay, range-bound markets, and risk asymmetry. These strategies focus not just on predicting price direction, but on managing probability, risk, and reward with precision.
This guide explores advanced option strategies in a structured way, helping you understand when to use them, how they work, and why professionals rely on them.
1. The Philosophy Behind Advanced Option Strategies
Advanced option strategies are built on three core option variables, often called the Option Greeks:
Delta – sensitivity to price movement
Theta – impact of time decay
Vega – sensitivity to volatility
Professional traders don’t trade opinions; they trade probabilities. Advanced strategies aim to:
Control downside risk
Benefit from time decay
Capture volatility changes
Maintain flexibility under different market conditions
These strategies are especially effective in sideways, low-volatility, or event-driven markets, where simple directional trades fail.
2. Multi-Leg Option Structures
Advanced strategies typically involve multiple option legs (combination of calls and puts). These structures allow traders to:
Reduce capital required
Hedge risk efficiently
Improve probability of success
Generate steady income
Unlike naked options, multi-leg strategies define risk upfront, making them suitable for disciplined traders.
3. Iron Condor Strategy
The Iron Condor is one of the most popular advanced strategies for range-bound markets.
Structure:
Sell one out-of-the-money call
Buy one higher strike call
Sell one out-of-the-money put
Buy one lower strike put
Market View: Neutral
Profit Source: Time decay (Theta)
Risk: Limited on both sides
This strategy works best when:
Volatility is high and expected to fall
The underlying asset stays within a defined range
No major news or events are expected
Iron Condors are widely used by institutional traders to generate consistent income.
4. Butterfly Spread Strategy
A Butterfly Spread is designed for situations where the trader expects very low volatility and price consolidation.
Structure (Call Butterfly):
Buy one lower strike call
Sell two at-the-money calls
Buy one higher strike call
Market View: Neutral
Profit Zone: Near the middle strike
Risk: Very low, predefined
Butterflies offer:
High reward-to-risk ratio
Low capital requirement
Precision-based trading
However, timing is critical—this strategy performs best close to expiry.
5. Calendar Spread (Time Spread)
Calendar spreads exploit differences in time decay between near-term and far-term options.
Structure:
Sell a near-expiry option
Buy a far-expiry option at the same strike
Market View: Mild directional or neutral
Profit Source: Faster decay of short-term option
Best Environment: Low volatility, stable price
This strategy is commonly used before:
Earnings announcements
Economic events
Policy decisions
Traders benefit when the underlying price stays close to the strike while time passes.
6. Ratio Spread Strategy
A Ratio Spread involves unequal numbers of bought and sold options.
Example:
Buy one call
Sell two higher strike calls
Market View: Moderately bullish or bearish
Risk: Can be unlimited if unhedged
Ratio spreads are used when traders expect:
Controlled price movement
Volatility contraction
Strong resistance or support levels
This strategy demands active monitoring and deep understanding of risk.
7. Backspread Strategy
The Backspread is a volatility-focused strategy, often used ahead of major market moves.
Structure (Call Backspread):
Sell one at-the-money call
Buy two out-of-the-money calls
Market View: Strong directional move expected
Profit Source: Volatility expansion
Risk: Limited
Backspreads are ideal when:
Volatility is low but expected to rise sharply
Big news or events are approaching
Traders want asymmetric payoff
This strategy can deliver explosive profits if the market moves aggressively.
8. Diagonal Spread Strategy
Diagonal spreads combine different strikes and different expiries, offering more flexibility than calendar spreads.
Benefits:
Directional bias with time decay advantage
Adjustable risk profile
Better control over delta and theta
Traders use diagonal spreads for slow trending markets, where price moves steadily over time.
9. Advanced Volatility-Based Strategies
Professional traders focus heavily on volatility rather than direction.
Key volatility strategies include:
Long straddle/strangle (volatility expansion)
Short straddle/strangle (volatility contraction with strict risk control)
Vega-neutral portfolios
Understanding Implied Volatility (IV) is crucial:
Buy options when IV is low
Sell options when IV is high
This single principle separates amateurs from professionals.
10. Risk Management in Advanced Option Trading
No advanced strategy works without disciplined risk management.
Key rules:
Always define maximum loss before entry
Avoid over-leveraging
Adjust positions proactively
Exit when probabilities shift
Advanced traders treat option strategies like business setups, not gambling tools.
11. Common Mistakes Traders Make
Ignoring volatility environment
Holding short options into major events
Overtrading complex structures
Focusing only on profit, not probability
Simplicity with discipline often outperforms unnecessary complexity.
12. Final Thoughts: Becoming a Professional Option Trader
Advanced option strategies are not about predicting markets perfectly. They are about positioning intelligently based on probability, volatility, and time.
By mastering these strategies, traders can:
Generate income in sideways markets
Protect capital during uncertainty
Achieve consistent long-term performance
The real edge lies not in the strategy itself, but in execution, patience, and risk control. When used correctly, advanced option strategies transform options trading from speculation into a structured, professional trading approach.
Pair Trading and Statistical ArbitrageMarket-Neutral Strategies for Consistent Alpha
Pair trading and statistical arbitrage are advanced trading strategies rooted in quantitative analysis, probability, and mean reversion. Unlike directional trading, which depends on predicting whether markets will rise or fall, these strategies focus on relative price movements between securities. Their core strength lies in being market-neutral, meaning profits can be generated in both bullish and bearish market conditions if executed with discipline and robust statistical models.
Understanding Pair Trading
Pair trading is one of the simplest and most widely used forms of statistical arbitrage. It involves identifying two highly correlated or economically related instruments—such as stocks from the same sector, index constituents, or companies with similar business models—and trading the price divergence between them.
The basic logic is straightforward:
When two related assets historically move together, any temporary divergence from their normal relationship is assumed to be temporary.
The trader simultaneously buys the underperforming asset and sells the outperforming asset.
When prices revert to their historical relationship, the trader exits both positions, capturing the spread profit.
For example, if two banking stocks that typically trade in tandem suddenly diverge due to short-term news or market inefficiency, pair trading seeks to exploit that mispricing rather than predicting overall market direction.
Core Principles Behind Pair Trading
The effectiveness of pair trading depends on several statistical and economic assumptions:
Correlation and Cointegration
While correlation measures how two assets move together, cointegration goes a step further by ensuring that their price relationship remains stable over time. Successful pair trading strategies rely more on cointegration than simple correlation.
Mean Reversion
Pair trading assumes that deviations from the historical price spread are temporary. The spread eventually reverts to its mean due to market forces, arbitrage, or fundamental alignment.
Simultaneous Long and Short Positions
By holding both long and short positions, the trader minimizes exposure to broader market movements, interest rate changes, or macroeconomic shocks.
What Is Statistical Arbitrage?
Statistical arbitrage is a broader, more sophisticated extension of pair trading. While pair trading usually focuses on two securities, statistical arbitrage may involve dozens, hundreds, or even thousands of instruments. It relies heavily on quantitative models, historical data analysis, and automated execution.
Statistical arbitrage strategies search for probabilistic mispricings rather than guaranteed arbitrage opportunities. These mispricings are identified using statistical techniques such as:
Regression analysis
Z-scores
Principal component analysis (PCA)
Machine learning models
Time-series forecasting
The objective is to exploit small pricing inefficiencies repeatedly, generating consistent returns over time.
How Statistical Arbitrage Works in Practice
A statistical arbitrage system typically follows a structured workflow:
Data Collection and Cleaning
Large volumes of historical price, volume, and sometimes fundamental data are gathered and standardized.
Model Construction
Quantitative models are developed to identify relationships, predict expected returns, and estimate deviations from equilibrium.
Signal Generation
Trading signals are generated when prices move beyond statistically significant thresholds, such as when a Z-score exceeds ±2.
Risk Management and Position Sizing
Positions are sized dynamically to maintain portfolio neutrality and control volatility.
Automated Execution
Because inefficiencies can be short-lived, trades are often executed algorithmically to minimize slippage and latency.
Key Differences Between Pair Trading and Statistical Arbitrage
While closely related, the two approaches differ in scope and complexity:
Pair Trading focuses on two assets and is easier to understand and implement.
Statistical Arbitrage operates at the portfolio level and may involve multiple asset classes.
Pair trading can be discretionary or semi-systematic, whereas statistical arbitrage is usually fully systematic and model-driven.
Statistical arbitrage often requires advanced computing power, robust backtesting, and continuous model refinement.
Despite these differences, both strategies share the same philosophical foundation: exploiting market inefficiencies through statistical evidence rather than speculation.
Advantages of Market-Neutral Strategies
Pair trading and statistical arbitrage offer several compelling advantages:
Reduced Market Risk
Since positions are hedged, overall market direction has limited impact on returns.
Consistency Across Market Cycles
These strategies can perform in volatile, range-bound, or trending markets.
Diversification Benefits
They complement traditional directional strategies and reduce portfolio volatility.
Objective Decision-Making
Trades are based on data and statistical thresholds, minimizing emotional bias.
Risks and Challenges
Despite their appeal, these strategies are not risk-free:
Model Risk: Historical relationships may break down due to structural changes, regulation, or company-specific events.
Execution Risk: Slippage, transaction costs, and liquidity constraints can erode profits.
Crowding Risk: Popular pairs and models may become overcrowded, reducing effectiveness.
Tail Risk: Extreme market events can cause correlations to collapse, leading to unexpected losses.
Successful practitioners continuously monitor performance and adapt models to evolving market conditions.
Risk Management in Pair Trading and Statistical Arbitrage
Effective risk management is critical. Common techniques include:
Stop-loss limits on spread deviations
Time-based exits if convergence fails
Diversification across multiple pairs or strategies
Dynamic rebalancing and volatility targeting
Position sizing based on statistical confidence rather than fixed capital allocation further enhances stability.
Role of Technology and Automation
Modern statistical arbitrage is inseparable from technology. High-quality data feeds, backtesting frameworks, and automated execution systems are essential. Machine learning and artificial intelligence are increasingly used to detect nonlinear relationships and adapt to changing market regimes.
However, complexity does not guarantee success. Simpler, well-tested models with disciplined execution often outperform overly complex systems.
Conclusion
Pair trading and statistical arbitrage represent a powerful class of quantitative, market-neutral strategies designed to profit from relative mispricing rather than market direction. Pair trading offers a focused, intuitive entry point, while statistical arbitrage scales the concept into a diversified, model-driven approach suitable for professional and institutional traders.
When supported by strong statistical validation, disciplined risk management, and continuous monitoring, these strategies can deliver consistent alpha across market cycles. In an increasingly efficient and competitive trading environment, pair trading and statistical arbitrage remain essential tools for traders seeking precision, objectivity, and long-term sustainability in the financial markets.

Understanding Market Phases to Anticipate the FutureOutlook Cycle Secrets
In the world of investing, trading, and economic decision-making, success is rarely driven by luck alone. It is shaped by the ability to understand where the economy and markets stand in a broader cycle and how that position influences future outcomes. The concept of the outlook cycle refers to the recurring phases through which economies, industries, and financial markets move over time. These cycles are not random; they are influenced by human behavior, policy decisions, capital flows, innovation, and external shocks. Unlocking the “secrets” of the outlook cycle allows investors, businesses, and policymakers to make informed, forward-looking decisions rather than reacting emotionally to headlines.
What Is an Outlook Cycle?
An outlook cycle represents the collective expectations about the future—growth, inflation, profits, employment, and stability—and how those expectations evolve over time. Markets are inherently forward-looking. Prices today often reflect what participants believe will happen six months, one year, or even several years ahead. As expectations rise or fall, they drive asset prices, capital allocation, and risk appetite.
Typically, outlook cycles align with broader economic cycles and can be divided into four main phases: recovery, expansion, slowdown, and contraction. Each phase carries distinct characteristics in terms of sentiment, liquidity, policy stance, and asset performance. Understanding these phases is the foundation of mastering outlook cycle dynamics.
Phase One: Recovery – The Birth of Optimism
The recovery phase begins after a downturn or crisis. Economic data is still weak, unemployment may be high, and corporate earnings are often depressed. However, the outlook starts to improve because the pace of deterioration slows. This is a crucial secret of the outlook cycle: markets often bottom out when conditions look the worst, not when they look good.
During recovery, central banks usually maintain accommodative policies such as low interest rates and liquidity support. Governments may introduce stimulus measures to revive growth. Investor sentiment remains cautious, but early movers begin positioning for future improvement. Historically, equities and risk assets perform strongly in this phase because valuations are low and expectations are modest.
The key insight here is that improving expectations matter more than absolute conditions. Those who wait for “clear confirmation” often miss the most powerful part of the cycle.
Phase Two: Expansion – Confidence Takes Control
Expansion is the most comfortable and visible phase of the outlook cycle. Economic growth becomes broad-based, corporate earnings rise, employment improves, and consumer confidence strengthens. Credit flows freely, business investment increases, and innovation accelerates.
Market sentiment during expansion is optimistic. Risk appetite is high, and capital rotates into equities, commodities, and growth-oriented sectors. Media narratives reinforce positive outlooks, often highlighting long-term growth stories and structural transformations.
However, one of the hidden secrets of the outlook cycle is that the seeds of future slowdown are often planted during expansion. Excessive leverage, asset bubbles, rising costs, and overconfidence can quietly build beneath the surface. While expansion can last for years, it is also the phase where discipline becomes most important.
Phase Three: Slowdown – The Turning Point
The slowdown phase is subtle and often misunderstood. Growth does not collapse immediately; instead, it decelerates. Inflationary pressures may rise, prompting central banks to tighten monetary policy. Interest rates increase, liquidity conditions tighten, and borrowing becomes more expensive.
Corporate margins may start to compress as costs rise faster than revenues. Leading indicators—such as purchasing manager indices, yield curves, and credit spreads—begin to signal stress even while headline economic data still looks healthy.
The critical secret in this phase is recognizing that markets respond to the rate of change, not the level. Even strong growth can lead to weak market performance if expectations peak and begin to decline. Defensive sectors, quality assets, and cash preservation strategies become increasingly important during this stage.
Phase Four: Contraction – Fear and Opportunity
Contraction is marked by falling economic output, declining profits, rising unemployment, and reduced consumer spending. Sentiment turns pessimistic, risk appetite collapses, and capital seeks safety. This phase often follows a policy mistake, financial imbalance, or external shock such as geopolitical conflict or a global crisis.
While contraction is emotionally difficult, it holds some of the most powerful opportunities for long-term investors. Valuations reset, inefficient businesses are cleared out, and new cycles begin to form. Policy responses—rate cuts, stimulus packages, and reforms—lay the groundwork for the next recovery.
The ultimate outlook cycle secret is this: every contraction contains the blueprint for the next expansion. Those who can detach emotionally and focus on long-term fundamentals are best positioned to benefit.
The Role of Psychology in Outlook Cycles
Human psychology plays a central role in shaping outlook cycles. Fear and greed amplify market movements, often pushing prices far beyond intrinsic value in both directions. During expansions, optimism can become complacency. During contractions, fear can turn into despair.
Understanding behavioral biases—such as herd mentality, confirmation bias, and loss aversion—helps decode why outlook cycles tend to overshoot. Markets do not simply reflect economic reality; they reflect collective belief systems about the future.
Using Outlook Cycles as a Strategic Tool
Mastering outlook cycle secrets is not about predicting exact tops or bottoms. It is about positioning intelligently across phases. Traders may focus on short-term momentum shifts, while long-term investors align portfolios with the dominant phase of the cycle.
Diversification, risk management, and flexibility are essential. As cycles evolve, so should strategies. Static thinking is one of the biggest enemies of success in cyclical markets.
Conclusion: Thinking Ahead of the Crowd
The outlook cycle is a powerful framework for understanding how economies and markets evolve over time. By focusing on expectations, sentiment, policy direction, and the rate of change rather than headlines alone, one can gain a meaningful edge.
The real secret lies in thinking independently and ahead of the crowd—buying when optimism is scarce, exercising caution when confidence is excessive, and always remembering that cycles are inevitable. Those who respect the rhythm of the outlook cycle are better equipped not only to protect capital but also to grow it consistently across changing market environments.

XAUUSD H1 Analysis Before Key NewsXAUUSD H1 Analysis Before Key News
During the Asian-European session, gold is likely to move sideways awaiting news as the market enters a sensitive phase with data and political factors, amidst a clearly formed short-term downtrend structure.
PRIORITY SCENARIO
Trading strategy according to the current structure, prioritizing short-term sell and buy at lower liquidity zones.
Main sell zone: around 4323, coinciding with the POC of the Volume Profile.
Technical context: price is moving below the equilibrium zone, clear H1 downtrend structure; the POC area often acts as a "pullback to sell" price zone.
Expected movement: early European session may see a pullback of about 40–50 points, then price returns to sideways movement and faces downward pressure again.
Position management:
Sell should only be held short-term and tightly managed when price reacts at 4323. If price surpasses POC and holds above this zone, risk should be reduced and avoid holding sell positions.
ALTERNATIVE SCENARIO
Strategy to buy at lower liquidity zones, suitable for medium-term trading.
Buy zone 1: around 4242, important VAH zone.
Buy zone 2: around 4215, Buy Zone according to Volume Profile.
Technical context: these are two price zones with high liquidity density, often attracting buying force when the market needs to rebalance after a decline.
Expected movement: price sweeps liquidity below, creating a new accumulation base and seeking recovery opportunities.
MAIN REASON
On H1, a downtrend structure has formed after a distribution phase, indicating short-term advantage leans towards the sell side.
Volume Profile clearly identifies POC 4323 as a reasonable pullback zone to sell, while 4242 and 4215 are price zones with high probability of buying reaction.
Sideways scenario before news fits the market context awaiting important macroeconomic and political information.
MACRO CONTEXT AND POLITICAL NEWS
Political factors are strongly impacting the currency market, especially the USD. The US is said to have proposed a security guarantee mechanism for Ukraine similar to NATO's Article 5 to promote negotiations to end the conflict with Russia, although territorial issues have not yet reached consensus.
These signals are putting weakening pressure on the USD, thereby continuing to support gold in the medium term. However, in the short term, strong volatility around news release time is something to be particularly noted.
RISK MANAGEMENT AND MONITORING
Do not prioritize trading when price is between the equilibrium zone and has not reached important Volume Profile levels.
Sell orders should only be considered short-term trades before news, avoiding holding through data release or important political speeches.
Medium-term buy strategy will have more advantage if price reacts clearly at 4242 or deeper at 4215.
Closely monitor USD fluctuations as current political news is the main driving factor.

Two Powerful Approaches to Understanding Financial MarketsTechnical Analysis vs Fundamental Analysis
In the world of trading and investing, decision-making is driven by analysis. Among the many methods available, technical analysis and fundamental analysis stand out as the two most widely used and debated approaches. Both aim to identify profitable opportunities in financial markets, yet they differ significantly in philosophy, tools, time horizon, and interpretation of market behavior. Understanding the strengths, limitations, and appropriate use of each method is essential for traders and investors seeking consistency and clarity in their strategies.
Understanding Technical Analysis
Technical analysis is the study of price movements, volume, and market patterns to forecast future price behavior. It is based on the belief that all available information—economic, political, and psychological—is already reflected in the price. Therefore, instead of focusing on why a price moves, technical analysts focus on how it moves.
At its core, technical analysis relies on charts and indicators. Traders examine historical price data to identify trends, support and resistance levels, chart patterns, and momentum signals. Common tools include moving averages, Relative Strength Index (RSI), MACD, Bollinger Bands, Fibonacci retracements, and candlestick patterns.
One of the foundational principles of technical analysis is that price trends tend to repeat due to human psychology. Fear, greed, hope, and panic create recognizable patterns over time. For example, breakouts, pullbacks, and reversals often occur in similar ways across different markets and time frames.
Technical analysis is especially popular among short-term traders, such as intraday traders, scalpers, and swing traders. These participants need precise entry and exit points, which technical tools provide. Since technical analysis can be applied to any tradable instrument—stocks, forex, commodities, cryptocurrencies, or indices—it is highly versatile.
However, technical analysis has limitations. Indicators are often derived from past prices, which means they can lag in fast-moving markets. False breakouts and whipsaws can lead to losses if risk management is poor. Additionally, technical analysis does not directly account for major fundamental events such as earnings surprises, policy changes, or geopolitical shocks.
Understanding Fundamental Analysis
Fundamental analysis focuses on evaluating the intrinsic value of an asset by examining economic, financial, and qualitative factors. The goal is to determine whether an asset is undervalued, fairly valued, or overvalued compared to its current market price.
In stock markets, fundamental analysis involves studying a company’s financial statements, including revenue, profit, cash flow, debt, and margins. Key metrics such as earnings per share (EPS), price-to-earnings (P/E) ratio, return on equity (ROE), and growth rates play a crucial role. Beyond numbers, analysts also assess management quality, competitive advantage, industry position, and long-term business sustainability.
In other markets, such as forex or commodities, fundamental analysis revolves around macroeconomic indicators. Interest rates, inflation, GDP growth, trade balances, central bank policies, and global supply-demand dynamics are central to valuation.
Fundamental analysis is most commonly used by long-term investors and positional traders. These market participants believe that, over time, prices will converge toward intrinsic value. For example, an investor may buy shares of a fundamentally strong company during temporary market weakness and hold them for years.
The strength of fundamental analysis lies in its ability to identify long-term wealth creation opportunities. It helps investors stay aligned with economic reality and business performance rather than short-term market noise.
However, fundamental analysis also has drawbacks. Markets can remain irrational longer than expected, meaning undervalued assets may stay undervalued for extended periods. Fundamental data is often released quarterly or monthly, making it less useful for short-term timing. Additionally, interpreting fundamentals requires assumptions about future growth, which may not always materialize.
Key Differences Between Technical and Fundamental Analysis
The most important difference between the two approaches lies in their focus. Technical analysis focuses on price behavior and market action, while fundamental analysis focuses on underlying value and financial strength.
Another major distinction is time horizon. Technical analysis is generally used for short- to medium-term trades, whereas fundamental analysis is better suited for medium- to long-term investments.
The data used also differs. Technical analysts rely on charts, indicators, and price history, while fundamental analysts study financial statements, economic reports, and industry trends.
In terms of decision-making, technical analysis emphasizes timing—when to enter and exit—while fundamental analysis emphasizes selection—what to buy or sell.
Which Is Better: Technical or Fundamental Analysis?
The debate over which approach is superior has existed for decades, but the reality is that neither is universally better. Their effectiveness depends on the trader’s goals, personality, and market conditions.
Short-term traders often prefer technical analysis because price movements and momentum matter more than long-term value in the near term. Long-term investors tend to rely on fundamental analysis because business performance and economic growth drive returns over time.
Many successful market participants adopt a hybrid approach, combining both methods. For example, an investor may use fundamental analysis to identify strong companies and then apply technical analysis to time entries and exits. This combination helps align value with market timing, reducing risk and improving consistency.
Conclusion
Technical analysis and fundamental analysis represent two different lenses through which financial markets can be understood. Technical analysis interprets market behavior through price and patterns, making it ideal for timing and short-term strategies. Fundamental analysis evaluates intrinsic value and economic strength, making it essential for long-term investment decisions.
Rather than viewing them as opposing philosophies, traders and investors should see them as complementary tools. Mastering both provides a deeper, more balanced understanding of markets, enabling better decisions across different market phases. In a complex and ever-changing financial world, the ability to adapt and integrate multiple perspectives is often the true edge.

Thematic and Sectoral Rotation TradingRiding Market Cycles with Strategic Precision
The financial markets do not move in a straight line. They evolve through cycles driven by economic growth, interest rates, inflation, government policies, technological innovation, and investor psychology. Within these cycles, leadership constantly shifts from one sector to another and from one powerful theme to the next. Thematic and sectoral rotation trading is a strategy that seeks to identify these shifts early and allocate capital to the areas of the market most likely to outperform at a given phase of the cycle. Instead of focusing on individual stock stories alone, this approach looks at the bigger picture, aligning trades with macroeconomic trends and structural changes in the economy.
Understanding Sectoral Rotation Trading
Sectoral rotation trading is based on the idea that different sectors perform better at different stages of the economic cycle. The economy typically moves through phases such as recovery, expansion, peak, slowdown, and recession. Each phase creates a favorable environment for specific industries.
For example, during an economic recovery, sectors like banking, real estate, automobiles, and capital goods often lead because credit growth picks up and consumer demand improves. In the expansion phase, IT services, consumer discretionary, and industrials may outperform as corporate profits grow. During periods of high inflation or uncertainty, defensive sectors such as FMCG, pharmaceuticals, and utilities tend to attract investor interest because of stable earnings. Sectoral rotation traders study these patterns and shift capital accordingly, aiming to stay invested in market leaders rather than laggards.
This approach reduces the risk of being stuck in underperforming sectors during unfavorable cycles. Instead of predicting which single stock will do well, traders focus on which sector has the wind at its back.
What is Thematic Trading?
Thematic trading goes a step beyond sectoral rotation. While sectors are broad classifications like banking, IT, or energy, themes are cross-sectoral narratives driven by long-term structural changes. A single theme can impact multiple industries simultaneously.
Examples of themes include digital transformation, renewable energy, electric vehicles, infrastructure development, defense manufacturing, China-plus-one supply chain shift, financial inclusion, and consumption growth in emerging markets. These themes often play out over several years rather than months. Thematic traders aim to identify these powerful narratives early and invest in companies that are direct or indirect beneficiaries.
Unlike sectoral rotation, which is more closely linked to economic cycles, thematic trading is driven by structural shifts that may continue even during economic slowdowns. For instance, digitization and automation can continue regardless of short-term GDP fluctuations.
The Role of Macroeconomics and Policy
Both thematic and sectoral rotation trading rely heavily on macroeconomic analysis. Interest rates, inflation, fiscal spending, monetary policy, and global economic trends act as triggers for rotation. In the Indian market, government policies play a particularly important role. Budget allocations, production-linked incentive (PLI) schemes, infrastructure spending, and reforms in banking or energy can create strong sectoral and thematic tailwinds.
For example, a rising interest rate environment may hurt rate-sensitive sectors like real estate but benefit banks through improved net interest margins. Similarly, a government push toward renewable energy can create a multi-year theme benefiting solar, wind, power equipment, and green financing companies. Traders who understand these macro-policy linkages gain a significant edge.
Time Horizon and Trading Style
Sectoral rotation trading is usually medium-term in nature, ranging from a few weeks to several months. Traders actively rebalance portfolios as leadership changes. Thematic trading, on the other hand, often suits positional or long-term investors who are willing to stay invested for years while tolerating short-term volatility.
However, both strategies can be adapted for trading if supported by technical analysis. Many traders combine top-down analysis (macro and sector/theme identification) with bottom-up analysis (stock selection and technical timing). This hybrid approach helps in entering themes and sectors at optimal points rather than chasing momentum blindly.
Tools Used in Rotation Trading
Successful thematic and sectoral rotation traders use a combination of tools:
Relative strength analysis to compare sector performance against benchmark indices
Sector indices and ETFs to track broad sector movements
Economic indicators such as PMI, inflation data, interest rates, and GDP growth
Technical indicators like moving averages, trendlines, and momentum oscillators
Earnings trends and valuations to avoid overpaying for popular themes
Relative strength is especially critical. A sector may be fundamentally strong, but if it is underperforming the broader market, capital is likely flowing elsewhere. Rotation trading is ultimately about capital flow analysis.
Advantages of Thematic and Sectoral Rotation Trading
One of the biggest advantages of this approach is alignment with market leadership. Markets reward sectors and themes where institutional money flows. By positioning in these areas, traders increase the probability of outperforming the benchmark.
Another advantage is diversification with direction. Instead of spreading capital randomly across stocks, traders diversify across high-conviction sectors or themes, reducing unsystematic risk while maintaining focus. This strategy also helps traders avoid emotional attachment to stocks and encourages a dynamic, adaptive mindset.
Risks and Challenges
Despite its advantages, thematic and sectoral rotation trading is not without risks. Themes can become overcrowded, leading to sharp corrections once expectations peak. Sectoral leadership can also change abruptly due to unexpected macro events such as geopolitical tensions, policy reversals, or global financial shocks.
Timing is another major challenge. Entering a theme too early can lead to long periods of underperformance, while entering too late can expose traders to sharp drawdowns. This is why discipline, risk management, and continuous review are essential.
The Indian Market Perspective
In India, thematic and sectoral rotation trading has gained popularity due to strong retail participation and clear policy-driven narratives. Sectors like PSU banks, infrastructure, defense, renewables, and manufacturing have shown how powerful rotations can be when aligned with economic and political trends. Indian markets are particularly sensitive to liquidity conditions and foreign institutional investor flows, making rotation strategies highly relevant.
Conclusion
Thematic and sectoral rotation trading is a sophisticated yet practical approach that bridges macroeconomic understanding with market execution. It encourages traders and investors to think beyond individual stocks and focus on where growth, capital, and narratives are converging. When executed with proper research, timing, and risk management, this strategy can help market participants stay ahead of cycles, capture leadership trends, and build sustainable performance over time. In a world of ever-changing markets, the ability to rotate intelligently is not just a skill—it is a necessity.
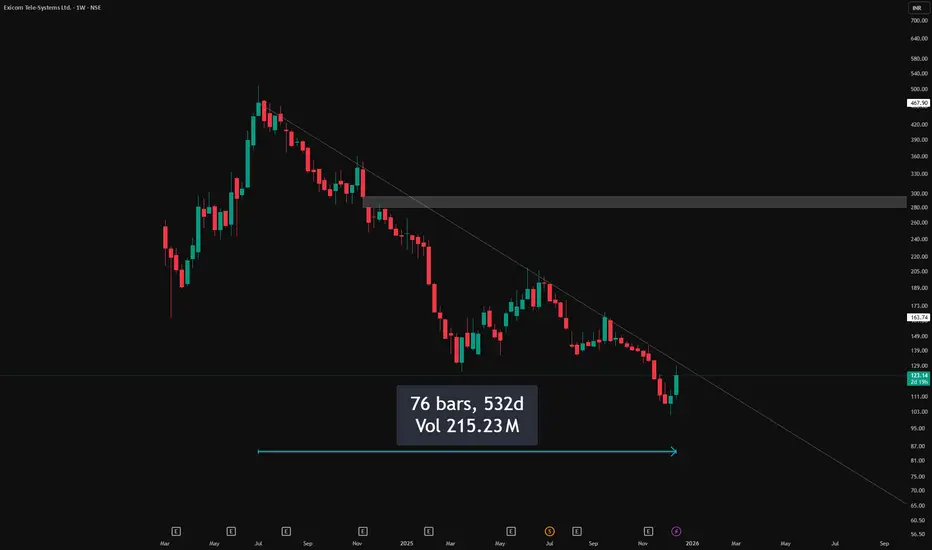
Clean Trendline Respect on Weekly Chart – 500 DaysPattern Context
Price has been respecting a well-defined descending trendline on the weekly timeframe, with each rally stalling below the previous swing high and reinforcing the broader lower‑high, lower‑low sequence.
Candlestick Behavior
Showing how supply continues to respond at the same diagonal zone. This reaction visually confirms how aggressively the market has been defending the pattern’s upper boundary without implying what comes next, keeping the focus strictly on how price has behaved historically around this line.
Observational Takeaway
This chart serves as a clear example of how a simple, clean trendline can organize price behavior over multiple months and frame where participation repeatedly shifts. The emphasis here is on observing how consistently the structure has been respected and how each touch has shaped the ongoing sequence, allowing traders to study price interaction with a dominant trend rather than anticipate future outcomes.
Disclaimer
This post is for educational and informational purposes only and is not investment advice, stock tips, or a recommendation to buy or sell any security. Readers should do their own research, consider their personal risk tolerance, and consult a registered financial professional if needed before making any trading or investment decisions.
Bearish Hammer - Ema and Rsi Confirmation🔎 Overview
The Bearish Hammer with EMA and RSI Confirmation is a structure-based reversal setup that focuses on price rejection at higher levels, supported by EMA positioning and RSI behavior. This setup helps filter weak candles and highlights situations where selling pressure begins to emerge after an upward move.
────────────────────────────
📘 EMA & RSI
EMA (Exponential Moving Average)
• EMA represents short-term price balance and dynamic support/resistance.
• The EMA High–Low Band defines the acceptable price zone for healthy trend structure.
RSI (Relative Strength Index)
• RSI measures momentum strength.
• The RSI MA (signal line) helps confirm whether momentum is sustaining or shifting.
────────────────────────────
🛠 How to Use
Bearish Hammer Formation Rules
• The Bearish Hammer must form at a swing high.
• The candle should show rejection from higher prices with a long upper wick.
• This indicates exhaustion of upward price movement.
────────────────────────────
✅ Validation & Devalidation Rules
Validation (Reversal Confirmation)
• A successive candle close below the low of the Bearish Hammer confirms the setup.
• This shows acceptance below the rejection zone.
Devalidation (Failure Protection)
• A successive candle close above the high of the Bearish Hammer invalidates the setup
────────────────────────────
📌 EMA Band Confirmation
• The Bearish Hammer must form completely above the EMA High–Low Band.
• The EMA High–Low Band should NOT touch the Bearish Hammer candle.
• This confirms that price is stretched away from value and rejection is valid.
────────────────────────────
📉 RSI Confirmation
• RSI should be above its MA line.
• This reflects mature momentum before rejection occurs.
• RSI alignment helps filter low-quality signals.
────────────────────────────
📊 Chart Explanation
• Bearish Hammer forms at a clear swing high.
• EMA High–Low Band remains below the candle, confirming price extension.
• Validation and devalidation lines define the decision zone.
• RSI supports momentum context during the setup.
────────────────────────────
📝 Summary
• Swing-high Bearish Hammer highlights rejection.
• EMA High–Low Band confirms price stretch.
• RSI MA alignment validates momentum context.
• Validation and devalidation levels provide clear structure.
• The setup emphasizes rule-based and disciplined analysis.
────────────────────────────
⚠️ Disclaimer
📘 For educational purposes only.
🙅 Not SEBI registered.
❌ Not a buy/sell recommendation.
🧠 Purely a learning resource.
📊 Not Financial Advice.

Part 1 Intraday Trading Master Class Covered Call Strategy (Moderately Bullish)
Concept: Hold shares and sell a call option.
Profit: Limited
Risk: Stock downside risk remains
Best Market Condition: Mild uptrend or sideways
Use Case:
Ideal for long-term investors to earn regular income.

Part 12 Trading Master Class Call Option Explained
A Call Option gives the buyer the right to buy the underlying asset at a fixed price (strike price) before or on expiry.
Example:
If NIFTY is trading at 22,000 and you buy a 22,200 Call Option, you expect the market to move up.
If NIFTY goes to 22,400 → You profit
If NIFTY stays below 22,200 → Option may expire worthless
Maximum loss = Premium paid
Profit potential = Unlimited
Call options are generally used when traders are bullish on the market.

Derivatives Trading SecretsMastering Leverage, Risk, and Market Psychology
Derivatives trading is often seen as a complex and high-risk area of financial markets, reserved only for professionals. However, when understood correctly, derivatives can become powerful tools for profit generation, risk management, and strategic positioning. The real “secrets” of derivatives trading are not hidden formulas or insider tricks, but a deep understanding of leverage, disciplined risk control, market structure, and trader psychology. This article раскрыts the core principles that successful traders consistently apply to gain an edge in derivatives markets.
Understanding the True Nature of Derivatives
Derivatives are financial contracts whose value is derived from an underlying asset such as stocks, indices, commodities, currencies, or cryptocurrencies. Common derivatives include futures, options, and swaps. The first secret of derivatives trading is recognizing that these instruments amplify both opportunity and risk. Because derivatives often require only a margin instead of full capital, traders gain leverage. This leverage magnifies profits, but it also magnifies losses with equal force.
Many beginners focus only on potential returns and overlook how quickly losses can accumulate. Successful traders, on the other hand, treat derivatives as precision instruments. They understand that derivatives are not investments in the traditional sense but tactical tools designed for specific objectives such as hedging, speculation, or arbitrage.
Leverage Is a Double-Edged Sword
One of the most important derivatives trading secrets is knowing how to use leverage responsibly. High leverage is attractive because it allows traders to control large positions with relatively small capital. However, excessive leverage is the primary reason most derivative traders fail.
Professional traders rarely use maximum leverage. Instead, they calculate position size based on acceptable risk per trade, usually limiting losses to a small percentage of total capital. They understand that survival comes first. In derivatives trading, staying in the game long enough is more important than chasing extraordinary gains in a single trade.
The secret lies in controlled leverage—using just enough to enhance returns while maintaining enough margin to withstand normal market volatility.
Risk Management Is the Real Edge
If there is one universal truth in derivatives trading, it is that risk management matters more than strategy. Many traders spend years searching for the perfect setup while ignoring basic risk principles. Successful traders think in probabilities, not certainties.
They define risk before entering a trade by setting stop-loss levels, understanding margin requirements, and planning exit strategies. They also account for gap risk, volatility spikes, and event-driven movements such as earnings, economic data, or policy announcements.
Another key secret is consistency. Instead of risking large amounts on a few trades, disciplined traders risk small, repeatable amounts over many trades. This approach allows the law of large numbers to work in their favor.
Volatility Is a Friend, Not an Enemy
In derivatives markets, volatility is not something to fear—it is something to understand. Futures and options traders, in particular, thrive on volatility. The secret is not predicting direction alone but understanding how volatility impacts pricing.
Options traders focus heavily on implied volatility, time decay, and volatility cycles. They know when to buy options during low volatility and when to sell or structure spreads during high volatility. Futures traders adjust position sizes based on volatility to avoid being shaken out by normal price swings.
Rather than avoiding volatile markets, experienced traders adapt their strategies to changing volatility conditions.
Market Structure and Liquidity Matter
Another often-overlooked secret is the importance of market structure. Liquidity, bid-ask spreads, open interest, and contract specifications play a major role in derivatives trading success. Highly liquid contracts such as index futures or major stock options offer tighter spreads and smoother execution, reducing trading costs.
Professionals prefer liquid markets because they allow quick entry and exit without significant slippage. They also pay attention to rollover dates in futures contracts and changes in open interest to gauge market sentiment and participation.
Understanding how institutions operate within derivatives markets provides insight into price behavior that retail traders often miss.
Timing Is More Important Than Prediction
Many traders believe success depends on predicting market direction accurately. In reality, timing and execution matter far more. Even a correct market view can result in losses if entries and exits are poorly timed.
Derivatives trading secrets include waiting for confirmation, trading with the trend, and aligning multiple time frames. Traders often enter positions when momentum aligns with broader market structure, rather than trying to catch tops and bottoms.
Patience is a hidden advantage. The ability to wait for high-probability setups separates professionals from impulsive traders.
Psychology Determines Long-Term Success
The most powerful secret in derivatives trading lies in the trader’s mindset. Fear, greed, overconfidence, and revenge trading are responsible for most losses. Because derivatives move quickly, emotional mistakes are amplified.
Successful traders develop emotional discipline. They accept losses as part of the business and do not attach ego to individual trades. They follow predefined rules even after a series of losses or wins.
Keeping a trading journal, reviewing mistakes, and focusing on process rather than outcome are common habits among consistently profitable derivatives traders.
Adaptability Is Essential
Markets evolve, and strategies that work today may fail tomorrow. Another critical secret is adaptability. Professional traders continuously monitor market conditions and adjust their strategies accordingly. They know when to be aggressive and when to step back.
They also understand that no single strategy works in all market environments. Trend-following strategies perform well in strong directional markets, while range-bound strategies work better during consolidation phases.
Flexibility and continuous learning keep traders aligned with the market rather than fighting it.
Conclusion
Derivatives trading secrets are not about shortcuts or guaranteed profits. They are about mastering leverage, respecting risk, understanding volatility, and maintaining psychological discipline. Derivatives offer immense potential, but only to those who approach them with preparation, patience, and professionalism.
By focusing on risk management, controlled leverage, market structure, and mindset, traders can transform derivatives from dangerous instruments into powerful tools. In the end, the true secret of derivatives trading is not predicting the market—but managing yourself within it.

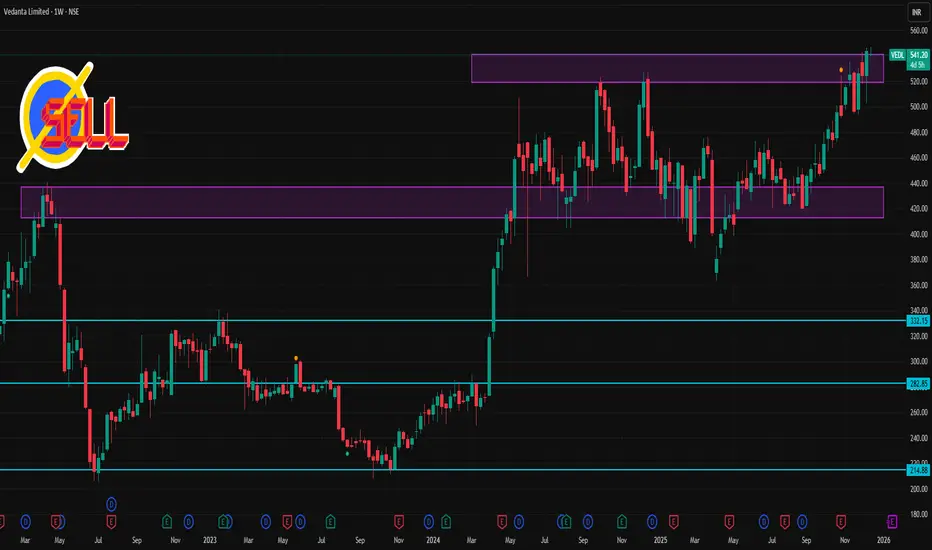
VEDL 1 Week Time Frame📍 Live price context
Vedanta is trading around ₹540 + on NSE.
📊 Weekly (1‑Week Timeframe) Key Levels
🧱 Resistance Levels (Upside)
These are levels where price may face selling pressure / struggle to break above:
R1: ~₹548 – ₹553 — short‑term technical resistance zone.
R2: ~₹555 – ₹560 — broader upside/wider resistance (weekly chart often reflects overhead supply near recent highs).
R3: ~₹565 + — psychological/upper projection zone if momentum continues.
📉 Support Levels (Downside)
Key floors where price may find buying interest / bounce:
S1: ~₹536 – ₹538 — immediate weekly support near pivot area.
S2: ~₹530 – ₹532 — next support cluster on weekly pivot levels.
S3: ~₹525 – ₹526 — deeper weekly support if price corrects further.