Survival First, Success LaterThere was once a stone that lay deep in the heart of a flowing river.
Every day, the water rushed past it, sometimes gently, sometimes with force. The stone wanted to stay strong, unmoved. It believed that by holding its ground, it could outlast the river.
For years, the stone resisted. It didn’t want to change. It believed that strength meant standing still, no matter how hard the current pulled.
But slowly, almost without noticing, the stone began to wear down. The river wasn’t trying to destroy it. The water wasn’t cruel. It was simply doing what rivers do - moving, shifting, carving its own path.
One day, the stone realised it wasn’t the same shape anymore. It was smoother now, smaller in places. It hadn’t won by resisting. It had survived by adapting. It had learned to let the river shape it without breaking it apart.
The stone couldn’t control the river. All it could do was endure without letting itself be shattered.
Trading is NOT so different.
The market moves like a river. It doesn’t care if you want it to go left or right. It doesn’t reward those who stand rigid against its flow. It rewards those who learn when to hold their ground, when to let go, and how to survive the constant pull of forces bigger than themselves.
This is NOT a story about rivers and stones. It’s a story about YOU.
About learning to endure without breaking. About understanding that survival comes not from fighting the current, but from learning how to live within it.
Much like the stone, every trader begins with the same illusion, that strength means control, that certainty can be conquered with enough knowledge or willpower.
But time in the markets teaches you otherwise. It shows you, again and again, that survival isn’t about resisting the flow. It’s about learning to move with it, to protect yourself from the inevitable storms without being broken by them.
And so, this is where the real story of trading begins.
Trading often appears simple from a distance. You buy, you sell, you make a profit, and then you repeat the process.
But anyone who has spent enough time in the markets will tell you the truth. This isn’t a game of certainty. This is a game of survival.
The market humbles you early. It doesn’t care how much you know, how brilliant you think you are, or how much confidence you bring. The market doesn’t reward ego; it breaks it down piece by piece.
Almost everyone starts with the same mindset. You want to win. You want to make money. You believe you can figure it out if you study hard enough, work smart enough, hustle more than the next person.
But eventually, reality steps in. You begin to understand this game isn’t about knowing where the price will go next. It’s about knowing where you will stop, where you will cut a loss, where you will step aside and wait.
The traders who survive are not the ones who chase perfection or seek to predict every move. They are the ones who learn how to lose properly - small losses, controlled losses. Losses that don’t bleed into something bigger, mentally or financially.
Most people can’t do that. They fight the market. They fight themselves. They refuse to accept small losses, believing they can somehow force a different outcome.
Those small losses eventually snowball. Blowups rarely come from one bad trade. They come from ignoring the small signs over and over again. The market isn’t cruel. It’s just indifferent. It’s your responsibility to protect yourself.
Good trading isn’t loud. It isn’t exciting. It isn’t full of adrenaline and big calls.
Good trading is quiet, repetitive, and frankly, a little boring. It’s built on discipline, not drama. Your job is to manage risk, protect your capital, and let time do its work.
There is no holy grail. There is only process. A process you can repeat with a clear head, day after day, year after year, without losing yourself in the noise.
Wins will come. Losses will come. Neither defines who you are. What defines you is how you respond.
⦿ Can you stay calm after a red day?
⦿ Can you follow your plan even after a mistake?
⦿ Can you sit on your hands when there’s nothing to do and trust the work you’ve already done?
Patience, in the end, is the real edge. Most won’t have it.
They’ll bounce between strategies, searching for certainty where none exists. They’ll burn out chasing shortcuts. They’ll forget that progress comes through small, steady steps taken over years, not through chasing big wins.
Trading is a mirror. It reflects your fear, your greed, your impatience. It shows you who you really are. Ignore what it reveals and you’ll keep paying for the same lesson until you finally learn it.
In the end, this game isn’t about the market. It’s about YOU.
⦿ Learn to protect yourself.
⦿ Learn to sit with boredom.
⦿ Learn to lose well.
⦿ Learn to wait without losing faith.
If you can do that, the market has a way of rewarding you in time.
Trading Plan
OHLC Monthly Magic🎯 Simple but Powerful Trading Concept – No Indicators, No Patterns Needed!
Dear viewers,
Today, I'm sharing something so simple that most traders completely overlook it. While everyone else is busy complicating trading with fancy indicators, patterns, and strategies — I want to take you back to the basics that actually work.
✅ I’m using a Nifty chart to explain this. I’ve highlighted the previous month’s candle, and using the drawing tool’s magnet mode, I’ve plotted simple horizontal lines at the:
• Open
• High
• Low
• Close
📊 That’s it! No indicators. No patterns. Just price action from the previous month.
Now, switch to the Weekly or Daily timeframe and observe what happens around those levels. You’ll see clear supply and demand zones forming — automatically. These are the real institutional levels where price reacts strongly.
🔒 Who Should Use This?
If you're a retail trader, I do not recommend getting into intraday or index options — they are high-risk and emotionally draining, especially for beginners.
However, if you're an experienced trader and can handle the volatility, here’s how you can use this method powerfully:
📅 After marking the previous month’s OHLC levels:
• Move to the current month
• Watch how price interacts with those levels
• Combine this with RSI for extra confirmation:
📈 RSI + OHLC = High-Probability Zones
• If RSI > 60 and price is nearing the previous high — there's an 80-90% chance of a breakout.
• If RSI < 40 and price is near the previous low — expect further downside.
• We ignore the 40–60 RSI range. It’s noise. We're only focused on strong bullish or bearish momentum.
✅ Try this on stocks, crypto, forex (EUR/USD) — anything.
Once you master this concept, you won’t need any fancy indicators or complicated supply-demand theories. Just price action and momentum will guide your trades.
Thanks for watching, and apply this to see the magic yourself. Check my previous post for deeper understanding of -
Positional Trading Setup
Swing Trading Setup
Stock Options Swing Setup
And - Investment Positional Trading Setup (coming soon)
Focus on which is simple. God Blesses you All!
Faraaz T
Sr. Exec. Research Analyst - Equity
Stockholm Securities - UK

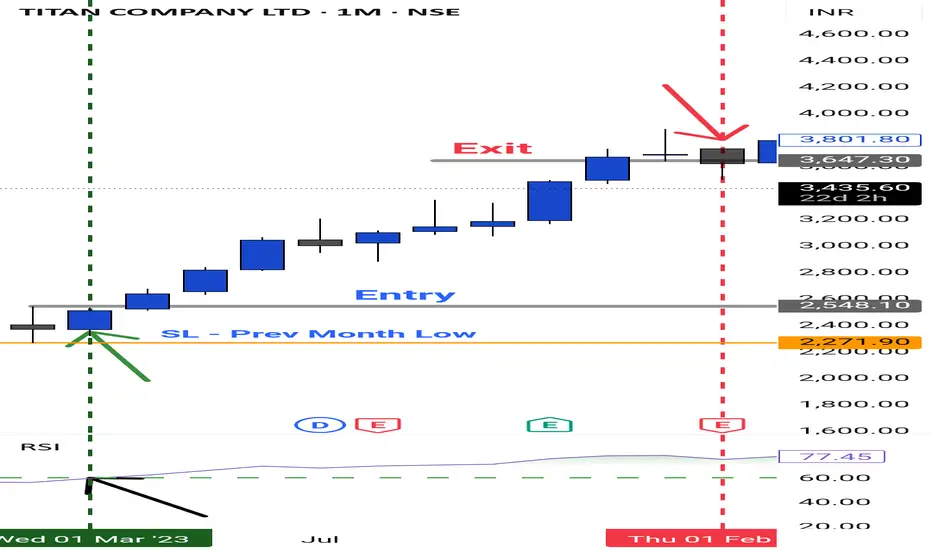
Swing & Positional Trading Simple High Momentum Strategy📌 Simple Positional Trading Strategy for Beginners & Intermediate Traders:-
Over the years, I’ve explored and tested a variety of advanced trading strategies. However, I’ve come to realize that for beginners and traders with 2–3 years of experience, complex strategies can often lead to confusion and unnecessary risk. To address this, I’m sharing a straightforward and effective positional strategy that operates solely on the monthly time frame—eliminating the noise of intraday volatility and focusing purely on major institutional trends.
🔹 Strategy Name:
Positional RSI Breakout – Cash or Options (Excludes Futures)
This method is tailored specifically for cash market positions or options trades (for those familiar with managing them). Futures are intentionally excluded to reduce leverage-related risks and complexity for new and learning traders.
✅ Strategy Rules
• Time Frame: Monthly Candlestick
• Indicator Used: RSI (Relative Strength Index)
📥 Entry Conditions:
• Monitor for RSI crossing above the 60 level on the monthly chart – this indicates strong bullish momentum.
• Once RSI is > 60, mark the high of the previous month’s candle.
• Place a buy order just above the previous month’s high.
🔒 Stop Loss:
• Set the first stop loss just below the previous month’s low when entering.
Trail your stop loss to the low of each month after closing of that monthly candle.
📤 Exit Conditions:
• Exit the trade only if a full monthly candle closes below the previous month’s low.
• Ignore daily price fluctuations—this strategy is built for positional swing trading, not short-term moves.
💡 Note for Options Traders:
If trading via options, ensure you exit your position before monthly expiry to avoid time decay and liquidity issues. If you're unfamiliar with options mechanics, it is advisable to stick with cash market trades.
📋 Stock Universe:
A curated list of 100 high-beta, highly liquid stocks is provided below for your assistance. These stocks:
• Offer consistent volume and volatility
• Are widely tracked by institutions
• Provide clean price action suited for both cash and options trades
🤝 Support & Queries:
If you have questions regarding execution, stock selection, position sizing, or risk management, feel free to reach out.
🔁 Final Thoughts:
Trading success doesn’t come from complexity—it comes from consistency, clarity, and discipline. Follow the process, manage your risks wisely, and let the strategy do its work.
Wishing you profitable trades and steady growth!
Please share this content with as many traders as possible and become a successful trader like PRO.
High Beta and Liquid Stocks List:-
🚗 Auto:
Bajaj-Auto, Balkrisind, Bharatforg, Boschltd, Eichermot, Exideind, Heromotoco, Mrf, M&M, Maruti, Motherson, Tvsmotor, Tatamotors, Tiindia
🏦 Banking & Financial Services:
Axis Bank Ltd., Bank Of Baroda, Canara Bank, Federal Bank Ltd., Hdfc Bank Ltd., Icici Bank Ltd., Idfc First Bank Ltd., Indusind Bank Ltd., Kotak Mahindra Bank Ltd., State Bank Of India, Bajaj Finance Ltd., Bajaj Finserv Ltd., Cholamandalam Investment And Finance Company Ltd.
⚗️ Chemicals:
Aarti Industries Ltd., Atul Ltd., Bayer Cropscience Ltd., Chambal Fertilizers & Chemicals Ltd., Coromandel International Ltd., Deepak Nitrite Ltd., Gujarat Fluorochemicals Ltd., Gujarat Narmada Valley Fertilizers And Chemicals Ltd., Himadri Speciality Chemical Ltd., Linde India Ltd., Navin Fluorine International Ltd., Pcbl Chemical Ltd., Pi Industries Ltd., Pidilite Industries Ltd., Srf Ltd., Solar Industries India Ltd., Sumitomo Chemical India Ltd., Tata Chemicals Ltd., Upl Ltd.
🛍️ FMCG:
Britannia Industries Ltd., Colgate Palmolive (India) Ltd., Dabur India Ltd., Emami Ltd., Godrej Consumer Products Ltd., Hindustan Unilever Ltd., Itc Ltd., Marico Ltd., Nestle India Ltd., Patanjali Foods Ltd., Radico Khaitan Ltd., Tata Consumer Products Ltd., United Breweries Ltd., United Spirits Ltd., Varun Beverages Ltd., Dmart
💊 Pharma & Healthcare:
Abbott India Ltd., Alkem Laboratories Ltd., Apollo Hospitals Enterprise Ltd., Aurobindo Pharma Ltd., Biocon Ltd., Cipla Ltd., Divi's Laboratories Ltd., Dr. Reddy's Laboratories Ltd., Fortis Healthcare Ltd., Glenmark Pharmaceuticals Ltd., Granules India Ltd., Ipca Laboratories Ltd., Laurus Labs Ltd., Lupin Ltd., Mankind Pharma Ltd., Max Healthcare Institute Ltd., Sun Pharmaceutical Industries Ltd., Syngene International Ltd., Torrent Pharmaceuticals Ltd., Zydus Lifesciences Ltd.
💻 IT & Tech:
Coforge Ltd., Hcl Technologies Ltd., Infosys Ltd., Ltimindtree Ltd., Mphasis Ltd., Oracle Financial Services Software Ltd., Persistent Systems Ltd., Tata Consultancy Services Ltd., Tech Mahindra Ltd., Wipro Ltd.
⚒️ Metals:
Apl Apollo Tubes Ltd., Adani Enterprises Ltd., Hindalco Industries Ltd., Hindustan Copper Ltd., Hindustan Zinc Ltd., Jsw Steel Ltd., Jindal Stainless Ltd., Jindal Steel & Power Ltd., Lloyds Metals And Energy Ltd., Nmdc Ltd., National Aluminium Co. Ltd., Steel Authority Of India Ltd., Tata Steel Ltd., Vedanta Ltd., Welspun Corp Ltd.
🏙️ Realty:
Anant Raj Ltd., Brigade Enterprises Ltd., Dlf Ltd., Godrej Properties Ltd., Macrotech Developers Ltd., Oberoi Realty Ltd., Phoenix Mills Ltd., Prestige Estates Projects Ltd., Raymond Ltd., Raymond Realty Ltd., Sobha Ltd.
🧱 Durables & Cement and Oil Gas:
Amber Enterprises India Ltd., Bata India Ltd., Blue Star Ltd., Century Plyboards (India) Ltd., Cera Sanitaryware Ltd., Crompton Greaves Consumer Electricals Ltd., Dixon Technologies (India) Ltd., Havells India Ltd., Kajaria Ceramics Ltd., Kalyan Jewellers India Ltd., Pg Electroplast Ltd., Titan Company Ltd., V-Guard Industries Ltd., Voltas Ltd., Whirlpool Of India Ltd., Acc, Ambuja Cements, Ultratech Cement, Shree Cements, Jk Cement, Reliance.
Swing & Positional Trade Setup Sector-wise Analys – Cash/Options✅ Swing and Positional Trade Setup
Sector-wise Analysis – Cash / Futures & Options Segment:-
Over the past 18+ years, I have developed a trading setup that revolves around sectoral analysis. My trades are taken in cash, futures, and options, based on which sector and which stock is showing strength.
Below, I’ve shared the complete sector-wise stock list. This will help you skip the most time-consuming part—stock selection—so you can focus purely on execution and discipline.
🔍 Stock Selection Criteria of mine:-
• Market Capitalization
• Liquidity and High Beta
• Volumes
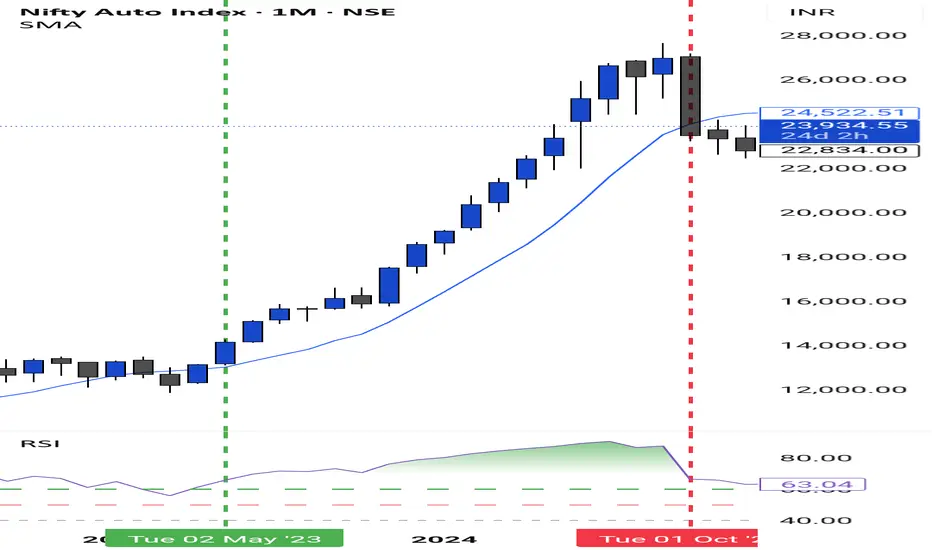
📊 1. Positional/Swing Trade Setups - Momentum Trading:-
This setup begins by identifying:
• Which sector is currently showing strength (e.g., Nifty Auto).
• Which stocks in that sector are outperforming the benchmark.
⚠️ Note for Beginners:
If your capital is below ₹20 lakhs, avoid trading in futures. Stick to cash market or stock options only.
🕒 Timeframes for Analysis:
• Monthly
• Weekly
• Daily
🛠️ Technical Tools Used:
• 9 SMA (Simple Moving Average)
• Volumes
• RSI (Relative Strength Index)
• Market Structure
(HH–HL for bullish, LH–LL for bearish)
📈 Entry Criteria (Bullish / Long Trades):
For Options (Call), Cash or Futures Buy:
• Price must be above 9 SMA on Monthly, Weekly, and Daily charts.
• Monthly and Weekly RSI > 50
• Daily RSI > 60 → This confirms a 7-Star Setup (Big Momentum Trade)
✅ Execution Plan:
• Entry: Above the high of the previous daily candle.
• Stop Loss: Below Daily 9 SMA or the recent swing low.
• Trailing Strategy:
• After 3 daily candles, trail stop loss to cost.
• Continue trailing below each new daily candle's low.
Exit Criteria:
• Daily close below 9 SMA
• OR RSI drops below 60
• OR both conditions occur
📉 Entry Criteria (Bearish / Short Trades – Put Option or Short in Futures):
• Daily and Weekly RSI < 50
• Price must be below 9 SMA on Daily and Weekly charts.
• Entry, stop-loss, and exit follow the same process in reverse.
📂 Sector-wise Stock List to Focus On:
🚗 Auto:
ASHOKLEY | BAJAJ-AUTO | BALKRISIND | BHARATFORG | BOSCHLTD | EICHERMOT | EXIDEIND | HEROMOTOCO | MRF | M&M | MARUTI | MOTHERSON | TVSMOTOR | TATAMOTORS | TIINDIA
🏦 Banking & Financial Services:
AU Small Finance Bank Ltd. | Axis Bank Ltd. | Bank of Baroda | Canara Bank | Federal Bank Ltd. | HDFC Bank Ltd. | ICICI Bank Ltd. | IDFC First Bank Ltd. | IndusInd Bank Ltd. | Kotak Mahindra Bank Ltd. | Punjab National Bank | State Bank of India | Bajaj Finance Ltd. | Bajaj Finserv Ltd. | Cholamandalam Investment and Finance Company Ltd.
⚗️ Chemicals:
Aarti Industries Ltd. | Atul Ltd. | Bayer Cropscience Ltd. | Chambal Fertilizers & Chemicals Ltd. | Coromandel International Ltd. | Deepak Nitrite Ltd. | E.I.D. Parry (India) Ltd. | Gujarat Fluorochemicals Ltd. | Gujarat Narmada Valley Fertilizers and Chemicals Ltd. | Himadri Speciality Chemical Ltd. | Linde India Ltd. | Navin Fluorine International Ltd. | PCBL Chemical Ltd. | PI Industries Ltd. | Pidilite Industries Ltd. | SRF Ltd. | Solar Industries India Ltd. | Sumitomo Chemical India Ltd. | Tata Chemicals Ltd. | UPL Ltd.
🛍️ FMCG:
Britannia Industries Ltd. | Colgate Palmolive (India) Ltd. | Dabur India Ltd. | Emami Ltd. | Godrej Consumer Products Ltd. | Hindustan Unilever Ltd. | ITC Ltd. | Marico Ltd. | Nestle India Ltd. | Patanjali Foods Ltd. | Radico Khaitan Ltd. | Tata Consumer Products Ltd. | United Breweries Ltd. | United Spirits Ltd. | Varun Beverages Ltd. | Dmart
💊 Pharma & Healthcare:
Abbott India Ltd. | Alkem Laboratories Ltd. | Apollo Hospitals Enterprise Ltd. | Aurobindo Pharma Ltd. | Biocon Ltd. | Cipla Ltd. | Divi's Laboratories Ltd. | Dr. Reddy's Laboratories Ltd. | Fortis Healthcare Ltd. | Glenmark Pharmaceuticals Ltd. | Granules India Ltd. | Ipca Laboratories Ltd. | Laurus Labs Ltd. | Lupin Ltd. | Mankind Pharma Ltd. | Max Healthcare Institute Ltd. | Sun Pharmaceutical Industries Ltd. | Syngene International Ltd. | Torrent Pharmaceuticals Ltd. | Zydus Lifesciences Ltd.
💻 IT & Tech:
Coforge Ltd. | HCL Technologies Ltd. | Infosys Ltd. | LTIMindtree Ltd. | MphasiS Ltd. | Oracle Financial Services Software Ltd. | Persistent Systems Ltd. | Tata Consultancy Services Ltd. | Tech Mahindra Ltd. | Wipro Ltd.
⚒️ Metals:
APL Apollo Tubes Ltd. | Adani Enterprises Ltd. | Hindalco Industries Ltd. | Hindustan Copper Ltd. | Hindustan Zinc Ltd. | JSW Steel Ltd. | Jindal Stainless Ltd. | Jindal Steel & Power Ltd. | Lloyds Metals And Energy Ltd. | NMDC Ltd. | National Aluminium Co. Ltd. | Steel Authority of India Ltd. | Tata Steel Ltd. | Vedanta Ltd. | Welspun Corp Ltd.
🏙️ Realty:
Anant Raj Ltd. | Brigade Enterprises Ltd. | DLF Ltd. | Godrej Properties Ltd. | Macrotech Developers Ltd. | Oberoi Realty Ltd. | Phoenix Mills Ltd. | Prestige Estates Projects Ltd. | Raymond Ltd. | Raymond Realty Ltd. | Sobha Ltd.
🧱 Durables & Cement:
Amber Enterprises India Ltd. | Bata India Ltd. | Blue Star Ltd. | Century Plyboards (India) Ltd. | Cera Sanitaryware Ltd. | Crompton Greaves Consumer Electricals Ltd. | Dixon Technologies (India) Ltd. | Havells India Ltd. | Kajaria Ceramics Ltd. | Kalyan Jewellers India Ltd. | PG Electroplast Ltd. | Titan Company Ltd. | V-Guard Industries Ltd. | Voltas Ltd. | Whirlpool of India Ltd. | ACC | Ambuja Cements | Ultratech Cement | Shree Cements | JK Cement
🛢️ Oil & Gas:
Adani Total Gas Ltd. | Aegis Logistics Ltd. | Bharat Petroleum Corporation Ltd. | Castrol India Ltd. | GAIL (India) Ltd. | Gujarat Gas Ltd. | Gujarat State Petronet Ltd. | Hindustan Petroleum Corporation Ltd. | Indian Oil Corporation Ltd. | Indraprastha Gas Ltd. | Mahanagar Gas Ltd. | Oil & Natural Gas Corporation Ltd. | Oil India Ltd. | Petronet LNG Ltd. | Reliance Industries Ltd.
✨ Final Thoughts
If you have any doubts or need help, feel free to ask. Take some time to reflect on this system. It offers clarity, discipline, and a pathway to wealth and peace of mind.
Don’t overconsume content. Stick to one tested process. Treat trading like a business, not a quick-money scheme.
🎯 Proven Success Rate: 80%
Add these stocks to your watchlist and follow the system diligently.
Wishing you successful trades ahead. May we all grow together. Happy to help always. 🙏
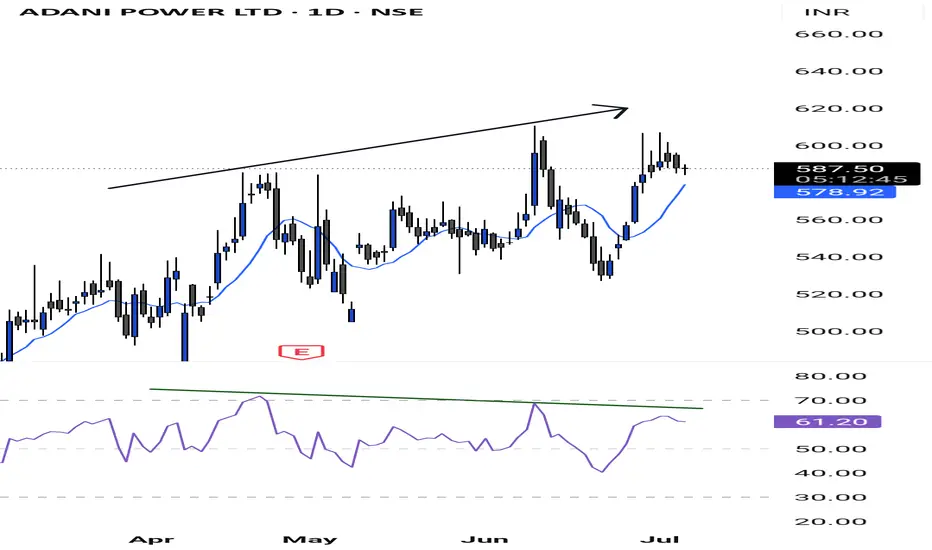
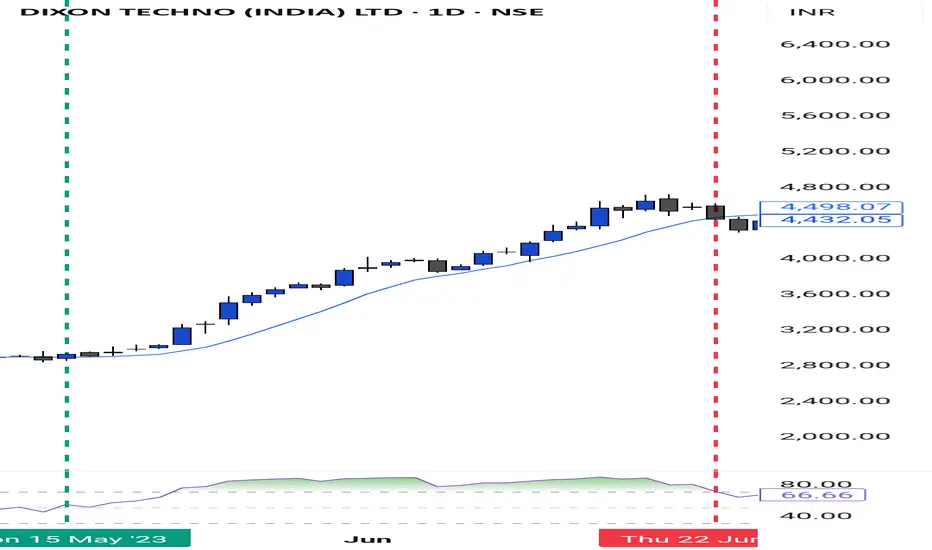
Swing Trading - Stock Options Strategy (Part 2)🔍Important Add-On: RSI Divergence Strategy in Swing Trading (Stock Options)
In the previous educational video on swing trading using stock options, one key element was missing — RSI Divergence.
📉 What is RSI Divergence?
RSI Divergence occurs when the price of a stock makes a higher high, but the RSI forms a lower high on the daily chart. This is a strong signal of weakening momentum and a potential reversal.
📌 Key Guidelines to Follow:
Avoid Taking Long Positions:
If you observe a higher high in price but a lower high in RSI (bearish divergence), avoid entering into a long (buy) trade — even if all other criteria align.
Use the Divergence as a Filter:
Among the pre-selected 25 liquid F&O stocks I provided, if you identify such bearish divergence on the daily chart, that stock should be kept aside and not considered for a long trade setup.
Look for PE (Put Option) Opportunities:
If a stock is showing RSI divergence to the upside while the monthly and weekly charts are above the 9 SMA, this could indicate an upcoming downside move. In such cases, consider PE (Put Option) selling or downside trades (with proper risk management).
🧠 Always Combine with Multi-Timeframe Confirmation:
While divergence is a powerful signal, always validate it alongside your existing strategy rules like 9 SMA and market structure.
Note - You can see in the chart that prices are forming higher highs, while RSI levels are making lower lows. In this case, even if the momentum or the monthly and weekly trends push the price above the 9 SMA, we will not consider this option for entry.
Any doubts, please ask in the comment section.
Swing Trading - Stock Options Buying Strategy📈 Swing Trading Strategy – Stock Options
Tools Used: 9 SMA, RSI, Market Structure
Stock Universe: 25 Pre-Selected High Beta, Highly Liquid F&O Stocks
🔒 No further filtering or stock selection is required. Trade only within this universe.
✅ Strategy Overview
This is a swing trading strategy focused on buying stock options, using a systematic multi-timeframe confirmation approach involving:
• 9-period Simple Moving Average (9 SMA)
• Relative Strength Index (RSI)
• Market Structure
📌 Rules of Engagement
1. 📅 Monthly Timeframe – Primary Trend Filter
• The monthly candle must close above the 9 SMA.
• The RSI must be greater than 50 on the monthly chart.
2. 📆 Weekly and Daily Timeframes – Trend Confirmation
• Both weekly and daily candles must close above the 9 SMA.
• The RSI must be above 50 on both the weekly and daily charts.
3. 🕒 Entry Trigger – 15-Minute Chart (Execution Timeframe)
Once higher timeframes align:
• Switch to the 15-minute chart.
• Wait for a pullback to the 9 SMA, and enter near this level.
4. 🛡️ Stop Loss – Initial Risk Management
• Set the stop loss just below the low of the daily candle that first closed above the 9 SMA.
5. 🏁 Exit & Re-Entry Criteria
• Exit the position if the daily candle closes below the 9 SMA.
• Re-enter only when the full setup aligns again across all timeframes.
🔁 Profit Trailing Strategy
🔒 Step 1: Lock-In at Cost
• After three consecutive bullish daily candles, trail your SL to breakeven (your entry price).
📉 Step 2: Dynamic Trailing
• For every 5 bullish daily candles,
➤ Trail your SL to the lowest low of the 1st candle in that group.
• Continue this until a daily close below the 9 SMA, at which point exit completely.
⏰ Option Expiry Guidelines
• Enter trades only after 2 days of expiry (e.g., from Friday onwards for weekly expiry on Thursday).
• Exit trades before the last 2 days of expiry to avoid theta decay.
• Choose liquid strike prices in 0.5 or 1-point intervals.
▸ Example: If the stock is at ₹439, pick ₹400 ITM or ₹450 for better liquidity.
⚠️ Additional Notes
• Strictly trade within the 25 pre-identified high beta, liquid F&O stocks.
• This strategy performs best in trending markets.
• Avoid overtrading or deviating from the setup rules.
• Maintain a trading journal to track entries, exits, and stop loss adjustments.
•
📊 High Beta, Liquid F&O Stocks (Current List)
Adani Enterprises Adani Power Axis Bank IndusInd Bank Bajaj Finance Kotak Mahindra Bank HDFC Bank Tata Motors Larsen & Toubro JSW Steel Reliance Industries IndiGo Tech Mahindra Titan Sun Pharma Cipla Bajaj Finserv BPCL Mahindra & Mahindra Aurobindo Pharma Dr Reddy’s Laboratories Shriram Finance Lupin Container Corporation (Concor) Siemens
VIMP - Same process will be followed for Downtrend/PE buying. Montly candle must give its closing below 9 SMA with RSI 50 crossing below
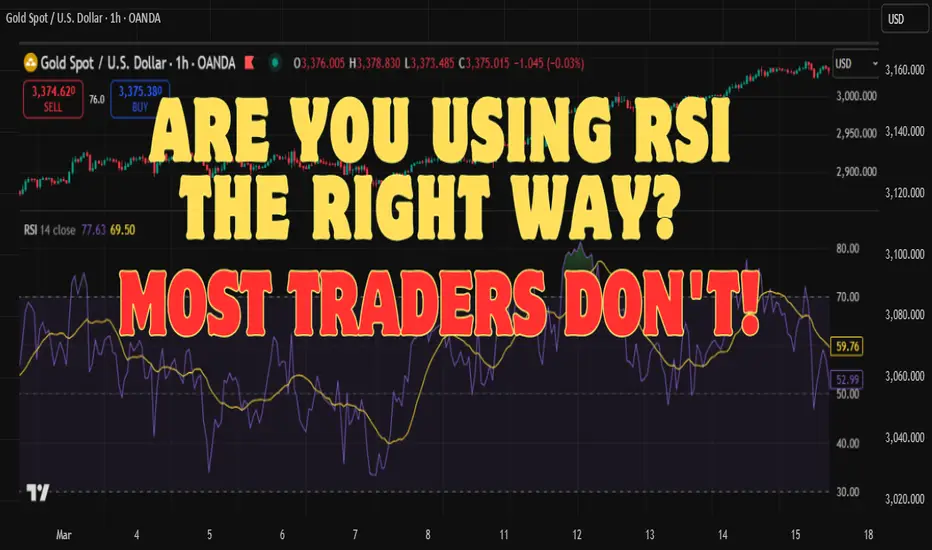
Are You Using RSI The Right Way ? Most Traders Don't !!!🧠 Are You Using RSI the Right Way? Most Traders Don't!
When we talk about the RSI (Relative Strength Index), most traders only look at the traditional levels — overbought at 70 and oversold at 30. But that’s only scratching the surface.
💡 Here’s the real power of RSI:
✅ Bullish Bias Above 50
❌ Bearish Bias Below 50
Let me explain 👇
📊 Traditional Way (Often Misleading):
Most beginners buy when RSI is below 30 (thinking it’s oversold) and sell when RSI is above 70 (thinking it’s overbought).
But markets can stay oversold or overbought for a long time — leading to early entries or false signals.
⚡ Smarter Way — Focus on the RSI Mid-Level (50):
* When RSI is above 50, momentum favors the bulls — it’s better to look for long setups.
* When RSI is below 50, momentum favors the bears — better to focus on short opportunities.
This approach helps you stay in sync with the dominant market trend and improves your trading timing.
🎯 Tip: Use RSI 50-level as a trend filter for your strategy. Combine it with price action or moving averages for stronger entries.
📌 Try it out on your favorite stock, crypto, or forex pair and see the difference for yourself.
💬 Let me know in the comments: Were you using RSI the right way before this?
Disclaimer :
This post is not financial advice, it's for educational purposes only highlighting the power of indicators and tools available in TradingView.
How to Use Heatmap in TradingView – Step by StepHeatmaps help you quickly see which stocks or cryptos are going up or down. In this guide, you'll learn how to use the heatmap on TradingView in a simple way.
📍 Step 1: Go to TradingView
Go to the website: (www.tradingview.com)
Make sure you're logged into your account.
Click on the Three lines located on the right top corner then click on "Products".
📍 Step 2: Open the Heatmap
Move your mouse to the top menu and hover over "Screeners"
Click on "Heatmaps" from the dropdown.
You’ll see two options:
Stock Heatmap 📈
Crypto Heatmap 💰
Pick the one you want to explore.
📍 Step 3: Choose Your Market
By default, it may show US stocks. You can change that.
Use the options at the top to filter by:
Exchange (like NSE, NYSE, etc.)
Sector (like Tech, Energy, Banks, etc.)
Market cap, price, or volume
📍 Step 4: Understand the Colors
Green boxes mean the price is going up ✅
Red boxes mean the price is going down ❌
Darker color means a stronger move
Bigger boxes mean bigger companies or higher volume
📍 Step 5: Hover Over a Box
When you move your mouse over a box, it shows more details:
Ticker symbol
Current price
% change
Market cap
If you click on a box, it will open the chart.
📍 Summary
The heatmap is a simple tool that gives a quick view of the market.
Use it daily to track market trends, find trade setups, and stay updated on what’s moving.
Disclaimer :
This Post is not financial advice, it's for educational purposes only highlighting the power of Tradingview and its features.

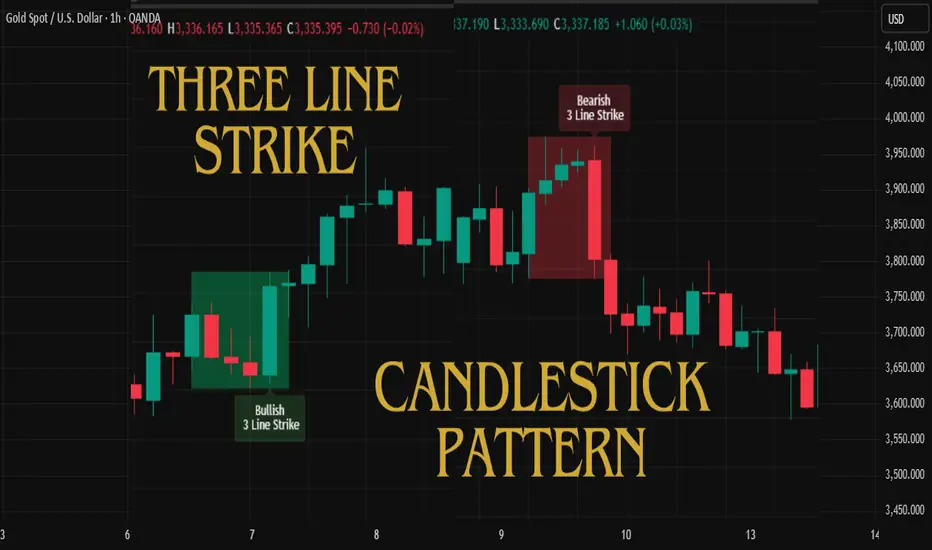
Understanding Three Line Strike Candlestick Pattern Pattern Logic:
The Three Line Strike is a 4-candle pattern that typically signals a sharp reversal after a sustained directional move. This script detects both bullish and bearish variations using strict criteria to ensure high probability.
Bullish Three Line Strike:
* Previous three candles must be bearish (red)
* Each of these candles must close progressively lower (indicating a strong downtrend)
* The current candle must Be bullish (green)
* Open below the prior close
* Completely engulf the previous three candles by closing above the first candle's open
* And make a higher high than the last 3 bars — confirming a strong reversal
Example Image :
Bearish Three Line Strike:
* Previous three candles must be bullish (green)
* Each must close progressively higher (indicating a strong uptrend)
* The current candle must Be bearish (red)
* Open above the prior close
* Completely engulf the prior three candles by closing below the first candle's open
* And make a lower low than the last 3 bars — confirming downside strength
Example Image:
Disclaimer:
This script is for educational purposes only and does not constitute financial advice. Trading involves risk, and past performance is not indicative of future results. Always do your own research and consult with a licensed financial advisor before making trading decisions.
Bulletproof Trading plan that keeps you Disciplined & ProfitableHello Traders! A solid trading plan is the backbone of long-term success in the stock market. Without a well-defined strategy, you're just gambling! Let’s break down how to create a bulletproof trading plan that keeps you disciplined and profitable.
1. DEFINE YOUR TRADING GOALS
Know Your Why – Are you trading for financial freedom, side income, or wealth creation? Define your primary objective before starting.
Set Realistic Expectations – Don’t aim for 100% returns in a month. Instead, set achievable goals based on your risk capacity and market conditions.
Time Commitment – Decide how much time you can dedicate to trading daily. Full-time traders have different goals than part-time traders.
Determine Risk Tolerance – Some traders are comfortable taking bigger risks, while others prefer slow and steady gains. Know what suits you best.
2. CHOOSE YOUR TRADING STYLE
Scalping – Quick in-and-out trades, usually within minutes. Requires a sharp focus and high execution speed.
Intraday Trading – Buying and selling within the same day. Ideal for traders who can monitor charts and execute trades during market hours.
Swing Trading – Holding trades for a few days to weeks. Best for those who want to capitalize on short-term trends without daily monitoring.
Positional Trading – A long-term approach where trades are held for months or years based on fundamental and technical analysis. Perfect for those who prefer low stress and bigger trends.
3. RISK MANAGEMENT IS EVERYTHING!
Position Sizing – Never risk more than 1-2% of your total capital per trade. This ensures you survive even after a losing streak.
Stop-Loss Discipline – Always place stop-loss orders to limit potential losses. Never trade without one!
Risk-Reward Ratio – Aim for a minimum 1:2 risk-reward ratio. This means risking ₹1 to potentially make ₹2, ensuring profitability over time.
Diversification – Avoid putting all your money in one stock or asset. Spread risk across different sectors or instruments.
4. DEVELOP YOUR ENTRY & EXIT STRATEGY
Entry Signals – Use technical indicators like moving averages, RSI, MACD, or price action patterns to confirm trade entries.
Predefined Exits – Set both stop-loss and take-profit targets before entering a trade. This removes emotions from decision-making.
Trend Confirmation – Don’t jump in randomly! Look for strong confirmation signs like higher highs & higher lows in uptrends, or lower highs & lower lows in downtrends.
Avoid Chasing – If you miss an entry, don’t jump in late. Wait for the next opportunity instead of chasing the price.
5. KEEP A TRADING JOURNAL
Record Every Trade – Note down entry price, exit price, stop-loss, profit/loss, and the reason for taking the trade.
Analyze Mistakes – Review losing trades to identify common errors, such as emotional trading or ignoring stop-losses.
Track Your Performance – Monitor win/loss ratios, average risk-reward ratios, and overall consistency.
Continuous Improvement – A journal helps refine your strategy over time, making you a better trader.
6. CONTROL YOUR EMOTIONS
Fear & Greed Control – Never let emotions dictate your trades. Follow your plan, not your feelings.
Avoid Revenge Trading – If you hit a loss, don’t immediately jump back in to "recover." This often leads to bigger losses.
Stay Disciplined – The best traders follow strict rules and don’t deviate based on market noise.
Take Breaks – If you’re feeling frustrated, step away from the charts. A clear mind leads to better decisions.
Final Tip: A trading plan is only as good as your discipline to follow it. Stick to your strategy, and let consistency bring you profits!
Do you have a trading plan in place? Let me know in the comments! 👇

Time-Tested Tips for Better Risk Management in Trading
📝 Develop a Trading Plan
• Start with a Plan: Avoid jumping into trades without preparation. A solid trading plan is
your blueprint for success.
• Key Components: Define your entry points, stop-loss levels (to limit losses), and target
profit levels in advance.
• Why It Matters: A structured plan provides clarity during stressful trading situations and
ensures consistency with your risk tolerance.
________________________________________
🧘♂️ Understand Your Risk Tolerance
• Self-Reflection: Assess your emotional and psychological response to risk.
Know your comfort level with losses, market fluctuations, and stress.
• Financial Awareness: Factor in your income, savings, debts, and expenses to
gauge how much risk you can afford.
• Personalization is Key: There’s no one-size-fits-all strategy.
Tailor your risk management approach to your account size, goals,
and unique circumstances.
________________________________________
📚 Follow Your Trading System
• Have a Clear System: Establish rules for entering and exiting trades to maintain discipline
and avoid impulsive decisions.
• Backtest and Research: Test your system against historical data and simulate performance
in different market conditions.
• Stick to It: If your system has a proven edge, trust it. Jumping between strategies after
losses often leads to bigger losses.
________________________________________
🚨 Use a Stop-Loss
• What is a Stop-Loss? A predefined price level where you exit a trade to
limit potential losses.
• Why It’s Important: Prevents emotional decision-making and ensures you
quantify your risk before entering a trade.
________________________________________
✂️ Manage Your Position Size
• Avoid Overexposure: Adjust your position size to manage risk effectively and
avoid putting too much capital into one trade.
• Diversify: Don’t put all your eggs in one basket unless you fully understand and
accept the risks.
Risk-Reward Ratios: Quick Reference
1:2 Risk-Reward
• Risking $1 to make $2
• Win 33% of the time to break even.
• Common for day and swing traders aiming for moderate profits.
• Example: Stop-loss at 10 pips, target profit at 20 pips.
________________________________________
1:3 Risk-Reward
• Risking $1 to make $3
• Win 25% of the time to break even.
• Ideal for trades with a high-probability setup and larger moves.
• Example: Stop-loss at $50, target profit at $150.
________________________________________
1:5 Risk-Reward
• Risking $1 to make $5
• Win 17% of the time to break even.
• Suitable for trend-following strategies or breakout trades with significant momentum.
• Example: Stop-loss at 5% of capital, target profit at 25%.
________________________________________
❌ Don’t Overtrade or Revenge Trade
• Control Impulses: Avoid the urge to overtrade or recover losses through high-risk trades.
• Stay Rational: Emotional trading can lead to poor decisions and bigger losses.
Trade with a clear head and logic.
________________________________________
📔 Maintain a Trading Journal
• Track Your Trades: Document your trades to identify patterns, mistakes, and
areas for improvement.
• Enhance Strategies: Regular reviews help refine your approach,
improve risk management, and evolve as a trader.
• Accountability: A journal instils discipline and serves as a learning tool for future trades.
________________________________________
✅ Final Reminders
• Trade with discipline, not emotions.
• Always align your strategies with your risk tolerance and financial situation.
• Remember, trading is a marathon, not a sprint—stay consistent and patient.
________________________________________
Note- The Magic Formula for Lot Size Calculation (1% Risk)
Formula = 1% of Capital/Stop Loss in Pips/10
Example Scenarios:
Capital = $5,000 | Stop Loss = 30 pips: in XAUUSD
1% of capital = 50$
Lot size = 1% of Capital/Stop Loss in Pips/10 = 50/30/10 = 0.16
🚀 Thanks for reading!
Drop your thoughts or additional tips in the comments below. Let’s grow and trade smarter together! Cheers! 🌟

HOW LIQUIDITY WORKS!In trading, liquidity refers to how quickly and easily an asset can be bought or sold in the market without significantly affecting its price. It reflects the availability of buyers and sellers and the volume of trading activity for a particular asset.
Key Aspects of Liquidity:
1. High Liquidity:
The asset can be traded easily with minimal price changes.
Common in popular markets like major stocks (e.g., Apple, Tesla), forex pairs (e.g., EUR/USD), and widely traded cryptocurrencies (e.g., Bitcoin).
2. Low Liquidity:
It’s harder to find buyers or sellers, leading to potential delays or price changes during transactions.
Common in niche markets, lesser-known stocks, or illiquid crypto tokens
Importance in Trading:
Efficient Price Discovery: High liquidity ensures prices reflect market demand and supply.
Lower Risk: Traders face less risk of slippage (unintended price changes during execution) in liquid markets.
Flexibility: Allows traders to enter or exit positions quickly, especially important for day traders and scalpers.
In summary, liquidity is crucial for smooth and cost-effective trading.
#Stockmarketeducation

Types of entry in the marketsTypes of entry in the markets
1- Aggerasive entry for high rewards
2- Conservative entry
3- Highly confirmed entry

Bajaj Hindusthan Sugar - Cup and Handle (Weekly Chart)A cup and handle pattern on a stock chart is an pattern which resembles a cup with a handle, where the cup is in the shape of a "u" and the handle has a slight downward drift or consolidation.
The cup and handle is considered a bullish signal, with the right-hand side of the pattern typically experiencing lower trading volume.
A cup and handle is considered a bullish signal extending an uptrend, and it is used to spot opportunities to go long.
Target Measurement - The depth (which is the bottom price of the cup till neckline) is measured and placed on the neckline to get the final target
Technical traders using this indicator should place a stop buy at the bottom of the handle on closing basis

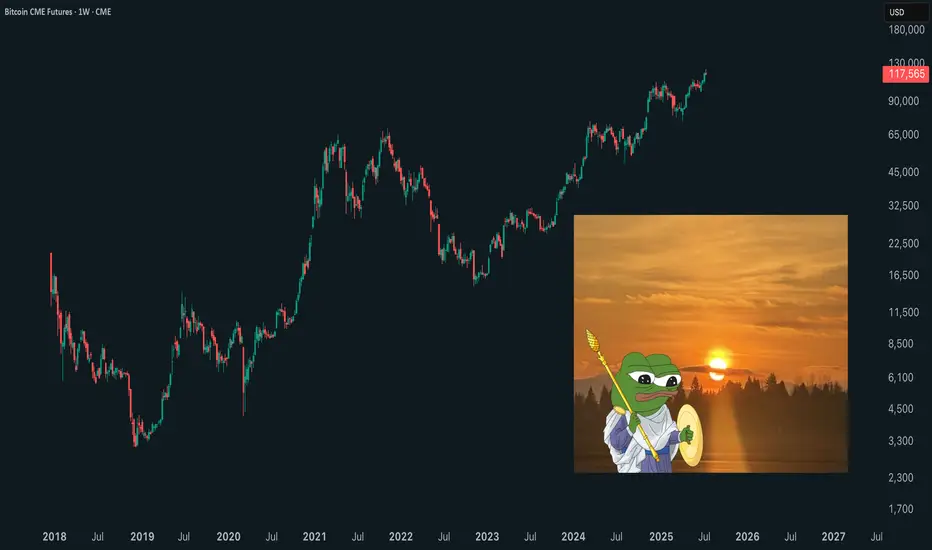
Nifty - Market Sentiment Cycle on Actual ChartThere are 14 stages of market sentiment cycle, the 2 stages which are the most interesting and which every seasoned trader tries to identify are Euphoria and Despondency / Depression.
Euphoria stage - This is the point of maximum financial risk
Despondency / Depression - Point of maximum financial opportunity
Have tried to plot the best estimate to understand where are we currently in the market sentiment cycle. Markets are completely unpredictable and the shared chart is only for an understanding to try and plot the sentiment cycle in real-world scenario

#Intraday trading strategy #BB Band A Bollinger Band is a technical analysis tool defined by a set of trendlines plotted two standard deviations (positively and negatively) away from a simple moving average (SMA) of a security's price, but which can be adjusted to user preferences. Bollinger Bands are a highly popular technique. Many traders believe the closer the prices move to the upper band, the more overbought the market, and the closer the prices move to the lower band, the more oversold the market.
Key takes
Bollinger Bands are a technical analysis tool developed by John Bollinger for generating oversold or overbought signals
There are three lines that compose Bollinger Bands: A simple moving average (middle band) and an upper and lower band.
The upper and lower bands are typically 2 standard deviations +/- from a 20-day simple moving average (which is the centre line), but they can be modified.
When the price continually touches the upper Bollinger Band, it can indicate an overbought signal while continually touching the lower band indicates an oversold signal

Emotions should not affect our trade management systemTrader should identify emotions that are affecting our trading management decisions, and find genuine solution to over come from the same to become a better trader.
Most investors treat trading as a hobby because they have a full-time job doing something else.
However, If you treat trading like a business, it will pay you like a business. If you treat like a hobby, hobbies don't pay, they cost you...!
Disclaimer.
I am not sebi registered analyst.
My studies are for educational purpose only.
Please Consult your financial advisor before trading or investing.
I am not responsible for any kinds of your profits and your losses.

Let's Know Top 10 Chart Patterns With Most Success RatesBefore it, let's learn about types of chart patterns because it's important to know that the pattern is a reversal or continuation because it will help us decide whether the market is making a reversal or a continuation pattern.
1. Continuation patterns : A Pattern which gives you an indication of continuation meaning continuing the trend.
For example :- flag patterns, wedges patterns or a pennant pattern can be classified into this.
2. Reversal Patterns : Patterns which give you an indication of reversal meaning if the market is going up and then a reversal pattern forms then it should go down.
For Example : Head and Shoulders Pattern, Double Top and Bottom Pattern can be classified into this.
Now Let's Learn about the Top 10 Chart Patterns With the most Success rates
1. Head and shoulders
2. Double top or bottom
3. J Pattern
4. Rounding bottom or Top
5. Cup and handle
6. Wedges
7. Pennant
8. Descending Triangle or Ascending Triangle
9. Bullish Flags or Bearish Flags
10. Symmetrical triangle or A Symmetrical Triangle
--------------------------------------------------------------------------------------------------------------------------------------------------------------------------------------
1. Head and Shoulders :-
Traders use the head and shoulders pattern in technical analysis chart to anticipate likely changes in a price trend. After a bullish trend, it is common to see a bearish pattern emerge that is renowned for its accuracy in predicting a trend reversal.
There are three peaks in the pattern where the middle one is the highest and the remaining two are known as "shoulders" with similar and lower heights. Once the price passes over the "neckline," which is a trendline tying the lowest points between the peaks of the two troughs, the design is finished. The head and shoulders pattern indicates the end of an uptrend, causing traders to use it as a sell signal.
There is a possibility that a decline will occur afterwards. The pattern is utilized by certain traders as an indication to engage in short positions, while keeping a stop loss above the neckline. It should be kept in mind that the occurrence of a head and shoulders pattern does not necessarily guarantee a reversal, therefore traders should rely on supplementary technical analysis and implement risk management strategies before trading.
2. Double top or bottom :-
A double top pattern occurs when the price of a stock reaches its peak, declines, then surges back up to the peak level but is unable to surpass it before falling once more. A resistance level formed by two peaks is encountered by the price, which is unable to break through it. When the price drops below the valley level that existed in between the two peaks, the pattern is over. The double top pattern is thought to be a bearish sign, indicating a possible price decline. A double bottom pattern, on the other hand, is the polar opposite of a double top pattern and resembles a mirror image. The price decreases to a certain level, rebounds, drops back down to the same level, but does not surpass it, and subsequently recovers again. The support level created by the two valleys is a point that cannot be breached by the price. The pattern is only finished when the price surpasses the peak level that was established between the two valleys.
It is crucial to remember that depending solely on these patterns for trading decisions is not recommended, as they are only among several instruments applied in technical analysis. It is advisable for traders to take into account additional elements aside from technical analysis, such as fundamental analysis.
When making investment decisions, take into consideration both market trends and the management of risk.
3. J Pattern :-
The term "J pattern" denotes a distinct chart pattern that may manifest over a duration of time in the movement of a particular stock's price. The J-shaped trend seen in a company's stocks entails an abrupt decline in value that is succeeded by a more protracted rehabilitation.
The name of the pattern originates from its formation on a price chart, which bears a similarity to the letter "J". Frequently, this trend can be observed in shares that encounter adverse circumstances or updates leading to the first decline in value, and later, garner support as investors regain trust in the potential profitability of the stocks.
4. Rounding bottom or Top :-
In technical analysis of financial markets, there are two patterns referred to as rounding top and bottom.
The pattern on a chart known as a rounding top signifies a gradual transition in the market from an upward pattern to a downward one. A gentle decrease in pricing is followed by a gentle increase, resulting in a curved contour. The pattern reveals that the market seems to be losing its force, implying that there could be a potential drop in prices.
Conversely, a chart pattern known as a rounding bottom indicates a change in the market direction, from a downtrend to an uptrend. The observed trend exhibits a gentle decrease in values accompanied by a gentle growth, creating a curvilinear appearance. The indication is that the market is growing based on this trend.
5. Cup and Handle The cup and handle pattern serves as a tool in technical analysis utilized in the stock market for detecting potential chances to purchase. This formation signifies the continuation of a bull market; it is observed after a stock has undergone a notable increase and then encountered a phase of stabilization.
The shape of the design, which resembles a container with a grip, is what the pattern is named for. A cup-shaped pattern forms when, following a strong upward trend in stock prices, there is a significant decrease that creates a rounded bottom resembling a U. The handle section on the chart emerges once the stock price remains within a tight range for several weeks or months without any significant rise, before finally breaking out and reaching new highs.
I Think That's too much we will continue the remaining 5 in the next one
I hope you learned something new if then pls do like and follow us
Thank you ♥

The Ultimate Rules for Options Day Trading SuccessNSE:BANKNIFTY
Introduction
If you want to be a successful options day trader, it's not just about having a good strategy. You also need to develop your expertise, seek guidance when needed, and be dedicated to your goals. To do this, you need to be disciplined and follow some options day trading rules. These rules can help you avoid common mistakes and take away the guesswork. Here are some rules that every options day trader should know and if you use them in a disciplined manner then they have been proven to help beginners become winning options day traders.
Some important rules are :-
Rule 1 Setting Realistic Goals for Options Day Trading
One of the most important rules for success in options day trading is to have realistic expectations. Options trading is not a way to get rich quickly, but it can be a profitable career if you put in the time and effort to learn and master the craft. You need to be prepared for a learning curve and be willing to stick with it even when it gets tough. You should also expect losses, as no strategy can guarantee gains all the time. Good money and risk management can help minimize losses.
Rule 2 Start Small to Grow Big
When you're new to day trading options, it's important to be cautious. You're still learning about options trading and the financial market, so take your time. Don't rush into things, even if you're excited. Start by practicing with paper trading and then move on to smaller options positions. Gradually increase your positions as you become more familiar with day trading options. This approach helps you minimize your losses and develop a systematic method for entering positions.
Rule 3 Know your limits
You may be tempted to trade as much as possible to develop a winning monthly average but that strategy will have the opposite effect and land you with a losing average. Remember that every options trader needs careful consideration before that contract is set up. Never overtrade and tie up your Capital.
Overtrading will make money for your broker not you.
Rule 4 Get Prepared Mentally, Physically, and Emotionally for Options Trading
To succeed in options day trading, you need to take care of your mental, physical, and emotional health. This means getting enough sleep, eating a healthy diet, exercising regularly, avoiding excessive alcohol and smoking, and reducing stress in your environment. These habits will help you stay alert and focused throughout the day. So, take the time to care for yourself and perform at your best every day.
Rule 5 Do Your Homework Daily – Plan your day
Before the market opens, study the financial environment and news to develop a daily trading plan. This is called pre-market preparation and it's essential to stay competitive and align your strategy with the day's conditions. Develop a pre-market checklist that includes evaluating support and resistance, checking the news, assessing volume and competition, determining safe exits for losing positions, and considering market seasonality.
Rule 6 Analyse Your Daily Performance
Track your options day trading performance daily to notice patterns in your profits and losses. This will help you understand why you're gaining or losing money and fine-tune your processes for maximum returns. Reviewing your daily performance will also help you make long-term decisions for your options day trading career.
Rule 7 Pay Attention to Volatility
Volatility is how likely the price will change over time in the financial market. It can be good or bad for an options day trader, depending on their goals and position. Many factors affect volatility, like the economy, world events, and news reports. Straddle and strangle strategies are helpful in volatile markets. There are three types of volatility: price, historical, and implied. Price is based on supply and demand, historical looks at past performance, and implied predicts future performance.
Rule 8 Use Option Greeks
Greeks are measures that help to determine an option's price sensitivity in relation to other factors. They are represented by letters from the Greek alphabet and are used in complex formulas to determine option pricing. Despite their complexity, Greeks can be calculated quickly and efficiently, allowing options day traders to use them to improve their trades for maximum profit.
Delta, Gamma, Vega, Theta, Rho
Learn about option greeks from here
I hope you found this helpful.
Please like and comment.
Keep Learning,
Happy Trading!

5 Tips For Managing Losing Trades (It Happens To Everyone)Losing trades happen. They are a part of the journey. There is simply no such thing as a trader or investor who wins all the time. All the famous investors or traders you know have LOST many times in their careers. It is perfectly normal. Did you know the famed hedge fund manager Ray Dalio lost everything in his 30s? He went broke. He had to start over from scratch.
This post will address what losing trades really mean and how to deal with it.
Before we begin, let us state the obvious:
- Be careful of people who claim they don't lose.
- Avoid people who flaunt win rates or success rates that are simply not possible.
- Losing trades happen to everyone! You are not alone.
Now, let's talk about what bad trades mean and 5 tips for managing them:
Number 1: A losing trade is different from a bad trade
The most experienced traders are well aware of their risk before they ever place a trade. Each losing trade is a small component of a bigger process that relates to a system, plan or strategy that has been thoroughly tested and studied. A losing trade is a calculated event for experienced traders. They defined their risk, position size, stop loss, and profit target. 🎯
A bad trade is very different. A bad trade implies someone risked their hard-earned money with no plan or process. A bad trade is reckless and indiscriminate trading. This often happens to new investors or traders who do not yet understand the time, studying, and research that goes into making a rock-solid plan. Be sure to remember the difference between a calculated losing trade and a bad trade with no plan or process.
TradingView Tip: there are several ways to get started with a plan, system or process. Paper trading, backtesting and/or working with proficient traders who give valuable feedback are all ways to get started. Don't risk your money without first doing research.
Number 2: Every losing trade provides data to get better
As we've mentioned several times now, losing trades happen to everyone. But remember, losing trades are also filled with insightful information and data. You can learn a lot from analyzing losing trades. 🔍
At the end of each trading day, week or month, experienced traders will analyze their losing trades in detail. What patterns are appearing? What do they share in common? Why did they happen? With this information, a trader or investor can adjust their strategy based on what they've uncovered.
Number 3: Do not let losing trades impact your health
Your mental and physical health are just as important as your financial health. Do not let losing trades impact either of those.
If your system is breaking down or several losing trades are starting to impact your emotions, step away from the computer or phone. Turn everything off and walk away. The markets have been open for hundreds of years and are not going away. When you're ready to come back, they'll be there.
Get up, get some fresh air, and get back in the arena when you're ready.
Number 4: Share your experiences with others
Traders and investors across the globe want to learn from your stories and losing trades. These are invaluable experiences that we all share in common. Social networks allow you to chat, share, and meet people who are going through similar things. We can all learn from each other.
Sure, the temptation to share your winners or act like the best trader who ever existed is tempting 😜 - but it's clear we learn together and get better when we share lessons from the loses. This is where the deepest insights are found, and together, it's where we can grow as a community of traders all trying to outperform the market.
Share and ask for constructive feedback!
Number 5: Keep Going
Markets are a game of learning, relearning, and progressing forward. New themes, trends, and stories appear and disappear daily. The journey is long and it never stops. When implementing your trading plan or investing plan, it's important to do it with the long-term in mind. One or two losing trades in a single day or week is a small fraction of what's to come many months and years down the road. 🌎
Keep going. Keep building. Keep refining your plan. Study the data.
We hope you enjoyed this post!
We hope you learned something new or informative!
Please leave any comments below and our team will read them.
- TradingView ❤️
Feel free to check us out on Instagram , and Twitter for more awesome content!

'Shades' of 'Trades' - color of the marketIn this color season let's have an insight into how the market plays 'Holi' with traders with its binary colors.
The above line sounds fascinating but it's not let me elaborate a bit more. Yes, the market plays with colors with traders
but the market uses only binary colors. Many of you may think of white and black as binary colors, but this is not the case here.
The market only uses two primary colors green and red to play with traders but we play with colors only on 'Holi' it seems that markets are very fond of playing with colors so it does probably every trading day it either colors the trader's position page with the green of red.
Though we have only two colors in markets which can be divided into four shades which are the following:-
-> Light Green - symbolizes a small profit
-> Dark Green - symbolizes a big profit ( Trader's Favorite )
-> Light Red - symbolizes a small loss
-> Dark Red - symbolizes a big loss ( Hazardous to account )
In this article let's dive into the depth of these colors and the reason for incurring such colors on your position page.
-->How to get light green color -- Aimed for steady and regular profits .
-> Trader can incur this only if they are consistent and aims for regular profit cause markets aren't trending every day.
-> Discipline is the key to consistency.
I think many of you have heard of the story of sage Vishwamitra who was meditating for a purpose and Menka was used to break the meditation and misguide him from his path. The same is the case of markets if you are in the market to generate regular profits then you must be disciplined as markets have negative behavior of creating illusions to trap the traders just like Menka .
-> I suggest developing a trading system or set of rules on which you are going to take the trade if you want to generate regular and steady profits cause if the system is profitable you will also be profitable. Don't rely on price action on an intraday basis unless you're a champ in the same.
-->How to get dark green color -- Aimed for sporadic and occasional profits.
-> Though everyone wants profits it's not obvious as said earlier markets aren't trending every day.
-> But if you are keen on watching market movements, you could probably catch these sporadic days and generate
big profits.
-> Fear should reside out to ride big profits.
I think why many of us aren't able to ride big profits because of the opulence of loss that has developed fear in our minds due to which we try to book profits early without getting any sign of weakness in our trades. Our mindset says to us "Something is better than nothing".
-> To overcome this fear I suggest backtesting your trades which can help you in gaining self-confidence if anyhow you can develop faith in yourself then fear naturally resides.
-->Reasons to get light red color -- Quite obvious as a part of the game.
-> It's quite obvious if you getting small losses as loss is a part of the trade game.
-> There is nothing to be stressed about or to ponder upon these small losses if it comes along with profits as there is no such trading system or trader which only gives or generates profit.
-> This usually happens when stop-loss is hit and you must be thankful to yourself that you had placed a stop and accept the small loss.
Markets reward traders who admit their errors and change their ways whereas punish traders who are obstinate and won't change.
I think everyone must check the reason for each loss they incur if it's due to the system you are following and the system is profitable in long run then the loss is fine but if it's due to your own mistake, learn from it and rectify the same as quick as possible.
-->Reasons to get dark red color -- Hazardous and may lead to termination.
-> One must avoid these big losses at all costs; otherwise, you may find yourself in a situation where you are unable to pay any costs.
-> Most hazardous and may sometimes lead to the termination of your trading journey.
-> This usually happens due to the stubborn nature of traders where they don't accept that they are wrong or don't have the guts to book their stop losses.
I think why many of us incur big losses because of neglecting the use of system stop-loss. Traders have realized the significance of stop-loss hence they decide on the sl before entering into the trade but what they do is keep sl in mind rather than the system and when the price reaches the sl level they don't have the guts to book the loss due to which small loss turn into a big loss.
This is the reason why everybody should place system stop-loss as a computer doesn't have emotion.
As stated earlier Markets reward traders who admit their errors and change their ways whereas punish traders who are obstinate and won't change. That means that if the trader does not recognize their mistake and book, the sl market will penalize them with a large loss.
I suppose that all of you have got great knowledge of the 'Shades' of 'Trades' and an insight into all outcomes of a trade.
And I think that I was able to explain to you how the market also likes to play with color and now the first line doesn't seem to be fascinating but obvious.
I hope this 'Holi' market colors you all with dark green, and wish you all a 'Happy Holi'.

How to select the Right Time Frame for Day Trading (Intraday) ?The selection of right time frame for day trading (Intraday) is a very subjective question and is frequently asked by the novice traders. The selection of the time frame depends on many parameters. But according to my experience it depends on mainly two parameters.
1. Stoploss
2. Signal strength of your trading strategy.
The time frame from 1 minute to 1 hour is best for day trading. Let us discuss these parameters in detail.
1. Stoploss: Each time frame has a different stoploss level. The higher time frame has a deep stoploss level as compared to the lower time frame. So, we have to select the time frame according to the stoploss or we can say that the right time frame depends on the amount of money you afford to lose in one trade . Before entering into the trade, check the stoploss for different time frames and then choose the time frame according to the bearable amount of money to lose in one trade.
2. Signal strength of your trading strategy: Whatever strategy you choose to trade, the entry and exit signals are always strong on the higher time frame as compared to the lower time frame because the lower time frames has high volatility as compared to the higher time frames. It means the success rate is high on the higher time frames as compared to the lower time frames.
Both of these parameters are directly proportional to each other. So, the selection of the time frame for day trading must depend on both of these parameters. We have to select the time frame on which our signal strength is good and also the comfortable amount of money which we afford to lose in one trade.
Thanks

If you are not 'INSIDE' you are 'OUTSIDE' In the stock market, if you are not inside, you are outside.
I expect all those reading this article wants to be inside the market.
So, if you want to participate in the market then you must develop a deep insight into
the key market players i.e. your competitors who drive day to day movement of the market.
Key Market Players:-
The following are the three types of market participants.
->Retail - general public also called clients
->High Net Worth Investors - commonly known as HNI clients.
->Proprietary Trading - also called 'Pro' are firms.
->Institutions - referred to as trading organizations.
Let's dive into the details of each of them listed above .
Retail Investors :- They are the general public who invest or trade in the market individually with very
small capital as compared to other participants. They are at the bottom of the market food chain when considered individually
but in recent few years, the retail participants as a whole have seen a significant rise in numbers.
High Net Worth Investors: - They are also an individual but with big sums in their pockets. They have a deeper access to
the markets, inside news, and all. They don't participate in day-to-day trading.
Proprietary Traders :- Also known as 'Pro 'are those firms/banks which also trade in the daily market with the firm's funds.
They are at the middle of the market food chain i.e. above retail but below institutions. Actively participate
in daily market movements.
Institutional Investors :- They are organizations taking part actively in market movements. They are at the top of the market food chain.
They can be further divided into two groups:
->FII (Foreign Institutional Investors): Institutions whose origin is outside India but still they invest in Indian markets. Actively participate
in daily market movements.
->DII (Domestic Institutional Investors): Institutions whose origin is India. They are inactive in the derivatives segment.
Among the participants listed above Retail, Pro & FII are actively involved in the daily market trading and encourage
derivatives segment.
We all have seen everyone in markets talking about FIIs that are bearish/bullish on markets but why?
The above figure is of FII+Pro & Client correlation with nifty, this describes the reason why the positions of FII are significant.
We can draw the following conclusion:-
1. Majority of the time FII is correct to predict the market movement.
2. Clients generally build position against FII and max times have an opposite correlation with market movements.
Now, have a look at how the FII and client positions affect the market movement
The above figure justifies the correlation.
We can draw the following conclusions:-
1. Maximum time FII are net short in nifty whereas clients are net long in nifty.
2. When FII cover their shorts and deploys the longs we see an uptrend but at the same time, the client unwinds long
and deploys shorts which are generally against the trend i.e. client likes to drive in opposite direction.
3. And when FII positions converge with the Client there is previous trend exhaustion and the arrival of a sideways market or
sometimes a new trend.
As of now the index is clearly explained but what about stocks how much significant is FII in stocks?
To answer the above question let's take an example of a very famous stock ITC:-
The above figure says that FII has increased holding in the interval of Jun2022 - Sep2022 from 12.7% to 44.5%
and by the time client has decreased the holding from 44.5% to 14.8%.
Does the change in position affect the stock price of ITC? let's have a look
Now it's clear that FII have ultimate power because when they started to increase their holding in ITC
the price shoot up during this time Public who were holding it for the last 2yrs exited when ITC has just begun to move.
Hope the readers had understood the mightiness of FII and the oppositeness of the Public and also have got a deep insight
about their competitors .
Also, thanks to @biswapatra for requesting me to write an article on this topic. You can also suggest an topic on which you
want to have analysis.
