GBPUSD – Support Holding, Watching Reaction From RangeGBP/USD has reacted from a well-defined support zone, an area where buyers have stepped in multiple times before. Price is currently trading between clear support and resistance, indicating a short-term range environment.
As long as this support holds, upside reactions toward the resistance zone remain possible. A clean break below support, however, would weaken this structure and change the short-term bias.
This is a reaction-based zone, not a prediction. Let price confirm the next move.
Disclaimer: This analysis is for educational purposes only and does not constitute financial advice. Trading involves risk. Please manage risk responsibly.
Trend Analysis

Bitcoin at Demand: Where Most Traders Panic and Smart Money WaitWhen I look at this chart, I don’t see weakness.
I see price reacting exactly where it should .
Bitcoin is sitting above a clearly defined demand zone, and instead of collapsing, price is slowing down and compressing.
That usually tells me the market is absorbing liquidity, not distributing .
Key things I’m focusing on:
Price is holding above ascending demand , which shows buyers are still defending structure.
Reactions from the demand zone are clean , not impulsive, a sign of controlled participation.
Overhead supply is present , which explains the compression instead of an instant breakout.
RSI bullish divergence adds confidence that downside momentum is weakening near demand.
My mindset here:
I’m not chasing moves.
I’m not panicking into demand.
I’m simply watching how price behaves here , because this zone decides whether the next move expands or fails.
As long as structure holds, patience matters more than prediction.
Disclaimer:
This analysis is for educational purposes only. Not financial advice. Always manage your risk.

Types of Breakout in the Markets ( Monthly Time Frame )In this video I will showcase different type of Breakouts you can see in the markets, mostly Horizontal types and Trendline Types but even inside them which ones are best to follow
I have used charts older than 3 months to showcase this information

BTC 4H UpdateAre we breaking out or faking out? 📉📈
Bitcoin is at a massive crossroads today, and the $91k level is the only thing that matters right now. We’ve seen some intense "chop" as the market prepares for today's FOMC decision.
My Technical Take:
Bullish Scenario: We need a clean flip of $91,195. If we hold that as support, I’m eyeing $95,621 as the first stop, with a potential run to $98k liquidity.
Bearish Scenario: If $91k stays as a ceiling, we likely visit the $86,355 support again. Keep a close eye on the $83k–$84k demand zone—if we drop there, that's where the real "dip-buying" begins.
The Game Plan: Volatility is the name of the game today. Don’t chase the initial wick; wait for the 4H candle close for confirmation. February is historically strong for BTC, so a breakout here could ignite a massive Q1 rally.
What’s your move? 👇 Are you Longing the breakout or Waiting for the $84k dip? Let’s talk in the replies!
#Bitcoin #BTC #CryptoTrading #FOMC #TechnicalAnalysis #TradingView #Web3

SENSEX Monthly EXP IntraSwing level Analysis for 29th JAN 2026SENSEX Monthly EXP IntraSwing level Analysis for 29th JAN 2026
⚠️82285 - 82325 Lo0kks Crucial⚠️
As SENSEX Last EXP. Before BUDGET, Market may more Choppy
Put OI: 17,93,824, Call OI: 18,39,826, PCR: 0.97. Data Shows: TAG of WAR
Intraday Put OI Chg: 8,00,027, Intraday Call OI Chg: 8,11,105, Intraday Change OI PCR: 0.99
Due to Delayed Data Chart will Updated 10-15 mins later.
Plot levels to Own Software / real time data provider's chart.
_____________^^^^^^^^^^^^^________________
💥Level Interpretation / description:
L#1: If the candle crossed & stays above the “Buy Gen”, it is treated / considered as Bullish bias.
L#2: Possibility / Probability of REVERSAL near RLB#1 & UBTgt
L#3: If the candle stays above “Sell Gen” but below “Buy Gen”, it is treated / considered as Sidewise. Aggressive Traders can take Long position near “Sell Gen” either retesting or crossed from Below & vice-versa i.e. can take Short position near “Buy Gen” either retesting or crossed downward from Above.
L#4: If the candle crossed & stays below the “Sell Gen”, it is treated / considered a Bearish bias.
L#5: Possibility / Probability of REVERSAL near RLS#1 & USTgt
HZB (Buy side) & HZS (Sell side) => Hurdle Zone,
*** Specialty of “HZB#1, HZB#2 HZS#1 & HZS#2” is Sidewise (behaviour in Nature)
Rest Plotted and Mentioned on Chart
Color code Used:
Green =. Positive bias.
Red =. Negative bias.
RED in Between Green means Trend Finder / Momentum Change
/ CYCLE Change and Vice Versa.
Notice One thing: HOW LEVELS are Working.
Use any Momentum Indicator / Oscillator or as you "USED to" to Take entry.
━━━━━━━━━━━━━━━━━━━━━━━━━━━━━━━━━━━━━━━━━━━
⚠️ DISCLAIMER:
The information, views, and ideas shared here are purely for educational and informational purposes only. They are not intended as investment advice or a recommendation to buy, sell, or hold any financial instruments. I am not a SEBI-registered financial adviser.
Trading and investing in the stock market involves risk, and you should do your own research and analysis. You are solely responsible for any decisions made based on this research.
"As HARD EARNED MONEY IS YOUR's, So DECISION SHOULD HAVE TO BE YOUR's".
━━━━━━━━━━━━━━━━━━━━━━━━━━━━━━━━━
❇️ Follow notification about periodical View
💥 Do Comment for Stock WEEKLY Level Analysis.🚀
📊 Do you agree with this view?
✈️ HIT THE PLANE ICON if this technical observation resonates with you. It will Motivate me.
━━━━━━━━━━━━━━━━━━━━━━━━━━━━━━━━━
💡 If You LOOKING any CHART & want for Level and ANALYZE?
Share your desired stock names in the comments below! I will try to analyze the chart Levels, patterns and share my technical view (so far my Knowledge).
If Viewers think It can identify meaningful setups. Looking forward to hearing from all of you — let's keep this discussion going and help each other make better trading decisions.

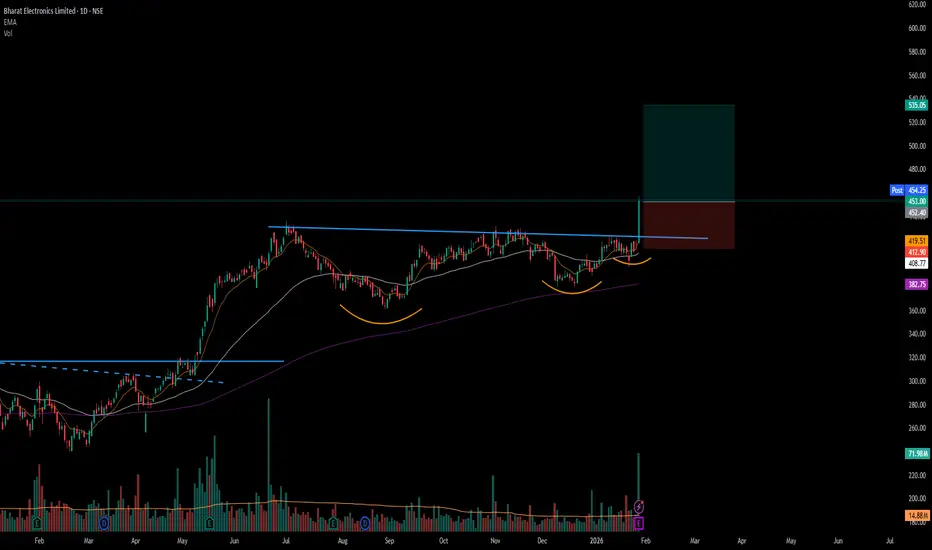
#BEL - VCP BreakOut in Daily Time Frame Script: BEL
Key highlights: 💡⚡
📈 VCP BreakOut in Daily Time Frame
📈 Volume spike during Breakout
📈 Base BreakOut
📈 RS Line making 52WH
📈 MACD Crossover
⚠️ Important: Market conditions are BAD, Avoid entering any Trade. Protect Capital Always
⚠️ Important: Always Exit the trade before any Event.
⚠️ Important: Always maintain your Risk:Reward Ratio as 1:2, with this RR, you only need a 33% win rate to Breakeven.
✅ Boost and Follow to never miss a new idea!✅
Disclaimer: I am not SEBI Registered Advisor. My posts are purely for training and educational purposes. Not a BUY or SELL recommendation.
Eat🍜 Sleep😴 TradingView📈 Repeat 🔁
Happy learning with MMT. Cheers!🥂
XAUUSD – Bullish Continuation, ATH Expansion Still in PlayGold continues to trade within a strong bullish channel, maintaining its ATH expansion structure. The recent pullback is corrective in nature and shows clear signs of liquidity absorption rather than distribution.
On the macro side, sustained USD weakness, safe-haven flows, and a still-cautious Fed outlook keep gold supported at elevated levels.
➡️ This environment favors trend continuation, not top-picking.
Structure & Price Action
H1 structure remains bullish with Higher Highs and Higher Lows intact.
The recent drop has respected key demand zones and the ascending trendline.
No bearish CHoCH confirmed → downside moves remain corrective.
Price is rebalancing after an impulsive leg, preparing for the next expansion.
Key takeaway:
👉 Pullbacks are opportunities to position with the trend, not signs of reversal.
Trading Plan – MMF Style
Primary Scenario – BUY the Pullback
Focus on patience and structure confirmation.
BUY Zone 1: 5,045 – 5,020
(Rebalance area + intraday demand)
BUY Zone 2: 4,985 – 4,960
(Trendline confluence + deeper liquidity)
➡️ Only execute BUYs after bullish reaction (rejection wicks / structure hold).
➡️ Avoid chasing price at highs.
Upside Targets (ATH Extension):
TP1: 5,106
TP2: 5,198 (upper extension zone)
Alternative Scenario
If price holds firmly above 5,106 without a meaningful pullback, wait for a break & retest to join continuation BUYs.
Invalidation
A confirmed H1 close below 4,960 would weaken the bullish structure and require a reassessment.
Summary
Gold remains in a controlled ATH expansion phase. As long as structure and demand zones hold, the path of least resistance stays to the upside.
The MMF approach remains unchanged: buy pullbacks, follow structure, and let the trend do the work.

DLF going to touch 613DLF is currently entering a critical price cluster between 611 – 620. This zone will likely dictate the trend for the coming days.
The Pivot Point: 613 (Mean Level)
Bullish Scenario: A sustained move above 613 backed by strong volume confirmation and a breakout of the descending trendline could trigger a rally toward 637.
Bearish Scenario: If the price fails to clear the trendline and slips below 613, expect a retracement toward the support at 596.
Note: Watch for a clean break of the converging trendlines for additional confirmation if you need.

SOLARIND 30% upside possible in next 6-8 Months.SOLARIND 30% upside possible in next 6-8 Months.
Fundamentals:
Company has reduced debt.
Company has delivered good profit growth of 35% CAGR over last 10 years.
Technicals:
Stock has been correcting from high of 17800 Since 7 Months.
Looks like the bottom should be formed near 11800-12500 region taking the stock back to last highs of 17800+
LTP - 13200
Target - 18000+
SL - 11500
Timeframe - 6-8 Months
Happy Investing.

BEL 1 Day Time Frame 📌 📊 BEL 1‑Day Key Technical Levels
Approx Current Price (latest quotes today):
Around ₹415–₹419 range on NSE/BSE today (daily range seen ~₹415.85–₹424.55).
📈 How to Read These Levels (Daily Chart)
Bullish bias: Price holding above Pivot (~₹403–₹417) and especially above R1 (~₹409–₹421) suggests strength and scope to test R2/R3 (~₹423–₹426+).
Support guard: S1/S2 zones (~₹396–₹412) act as key intraday floors — break below these may extend selling.
High‑probability range: Most of the day’s action tends to unfold between S1 and R2 before breakout/ breakdown.
📊 Daily Price Context
Recent day’s low ~₹408.50 and high ~₹419.00 shows volatility and testing of higher supply near ₹421+.
52‑week range remains between ~₹240 and ~₹436, so current price is near upper band historically.
⚠️ Quick Notes
These are technical reference levels (support/resistance/pivots) and not buy/sell calls.
Markets move quickly; for live tick‑by‑tick data use a brokerage platform or real‑time charting tool.

CHFJPY 4HR T/F ANALYSIS----
chfjpy 4hr t/f analysis----- in this image we have a new retesting area which are sell side retesting here we do measure top recent demand and demand will be also completed so now we can see recent full supply here so we can go with supply let`s see---

Gold Trading Strategy for 28th January 2026🟡 GOLD ($) TRADING PLAN
📊 TREND TRADING (Intraday)
📈 BUY SETUP
🟢 Condition:
➡️ Buy above the high of 30-min candle
➡️ Candle must close above $5244
🎯 Targets:
💰 $5255
💰 $5266
💰 $5277
🛑 Stop Loss:
🔻 Below the low of the breakout candle
📉 SELL SETUP
🔴 Condition:
➡️ Sell below the low of 1-hour candle
➡️ Candle must close below $5125
🎯 Targets:
💰 $5115
💰 $5105
💰 $5095
🛑 Stop Loss:
🔺 Above the high of the breakdown candle
⚡ SCALPING STRATEGY
🔻 SELL SCALPING (Resistance – $5244)
❌ Price tests $5244 zone
❌ 15-min candle rejection observed
📍 Entry:
➡️ Sell below the low of rejected 15-min candle
🛑 Stop Loss:
🔺 Above the high of rejected candle
⏱️ 5–10 points max or trail SL
📌 Trade Management:
🔄 Trail stop once price moves in favor
🔺 BUY SCALPING (Support – $5125)
✅ Price tests $5125 zone
✅ 15-min candle rejection observed
📍 Entry:
➡️ Buy above the high of rejected 15-min candle
🛑 Stop Loss:
🔻 Below the low of rejected candle
⏱️ 5–10 points max or trail SL
📌 Trade Management:
🔄 Trail stop once price moves in favor
⚠️ DISCLAIMER
🚨 This is not investment advice.
📉 Trading in commodities involves high risk.
💸 Past performance does not guarantee future results.
🧠 Trade only with proper risk management.
📌 Always consult your financial advisor before trading.
❗ Author is not responsible for any profit or loss.

$PUMP MACRO SETUP | 1,000%+ UPSIDE IF HTF BASE HOLDSNYSE:PUMP MACRO SETUP | 1,000%+ UPSIDE IF HTF BASE HOLDS
#PUMP Is Trading Inside A HTF Accumulation Zone After Completing A Long-Term Descending Wedge, Signaling A Potential Macro Trend Reversal.
Technical Structure:
✅ Multi-Month Descending Wedge Breakout Confirmed
✅ Clean Breakout + Retest Of HTF Neckline
✅ Inverse H&S Pattern NeckLine Very Close to Breakout
✅ Strong Demand Holding Inside $0.0025 – $0.0022
✅ Structure Invalidate Below $0.00168 (HTF Close)
✅ Sustained Acceptance Above Accumulation Signals Continuation
CryptoPatel Expansion Targets: $0.00504 → $0.00867 → $0.01500 → $0.02297+
High R:R Setup If HTF Demand Holds And Expansion From The Base Continues.
❌ Invalidation: HTF Close Below $0.00168 Opens Downside Risk And Invalidates The Reversal Structure.
TA Only. Not Financial Advice. ALWAYS DYOR.

UPL Short Trade Setup UPL has broken a prior pivot low signaling potential weakness. Price is retracing toward supply zone which aligns with the 50 and 21 EMA confluence on the daily chart—a strong area of resistance.
This zone offers a high-probability short entry, targeting a move back toward the higher time frame demand zone.
Trade Plan:
- Entry: On rejection from the zone
- Stop Loss: Above supply zone at 15 % Datr
- Target: (1:3 RR)
Trade entry remains invalid if price moves down before retracement creating a lower low and lower high.

Dynamic Price & Time Calculations ( Logical approach) One can see the change in the Price % during Positive Movement in the Market
it also show the No of days consumed in the directional move which are ideally known as
motive waves in technical approach
The Speed of Rate of change one must calculate related to No of days
I have made some efforts in Explaining putting the both % tool & No of days Tool on the chart
what you can notice is when speed is moderate
1st Phase Dynamic CAGR is 123.68 % Per Year
2Nd Phase increase in time & increase in Price Movement which results in Dynamic CAGR 170.70%
3ed Phase Speed increase in price displacement but % remain Lower then Previous Two Movements resulting Dynamic CAGR 83.80 %
Now by this time I am not completely agreeing on market trend termination
but if markets turns then it will Give very less revenue in all of the Motive Movements
This is education Content
Goodluck

MFSL at Channel Support — Bounce or Breakdown?MFSL is moving inside a well-defined rising channel, showing a healthy and controlled uptrend.
The stock has respected this structure multiple times, with buyers stepping in near the lower support and selling pressure appearing near the upper resistance.
Currently, price is approaching the lower boundary of the channel — a crucial zone where trend continuation usually happens if buyers defend it.
As long as this support holds, the overall trend remains positive.
A clear breakdown below the channel could signal further weakness.

DXY : Decisive Move ComingDXY is stuck in a range for long and ascending triangle type formation can be seen on weekly charts. Any break either upside or downside can bring a big move and sharp move

NIFTY Analysis for 29th JAN 2026: IntraSwing Spot levelsNIFTY Analysis for 29th JAN 2026: IntraSwing Spot levels
For coming Days 25270 - 25316 Looks Crucial.
Todays Close above that Zone suggests Bull Power.
If Breaks Below 25270 & Sustain for 15 - 30 mins, Bears can take Advantage.
Due to SENSEX Last EXP before BUDGET, Volatility must have Crucial role.
CAUSIOUS TRADE ADVISABLE.
👇🏼Screenshot of NIFTY Spot All-day(27th Jan 2026) in 5 min TF.
🚀Follow GIFTNIFTY Post for NF levels
_________________:::__________________
💥Level Interpretation / description:
L#1: If the candle crossed & stays above the “Buy Gen”, it is treated / considered as Bullish bias.
L#2: Possibility / Probability of REVERSAL near RLB#1 & UBTgt
L#3: If the candle stays above “Sell Gen” but below “Buy Gen”, it is treated / considered as Sidewise. Aggressive Traders can take Long position near “Sell Gen” either retesting or crossed from Below & vice-versa i.e. can take Short position near “Buy Gen” either retesting or crossed downward from Above.
L#4: If the candle crossed & stays below the “Sell Gen”, it is treated / considered a Bearish bias.
L#5: Possibility / Probability of REVERSAL near RLS#1 & USTgt
HZB (Buy side) & HZS (Sell side) => Hurdle Zone,
*** Specialty of “HZB#1, HZB#2 HZS#1 & HZS#2” is Sidewise (behaviour in Nature)
Rest Plotted and Mentioned on Chart
Color code Used:
Green =. Positive bias.
Red =. Negative bias.
RED in Between Green means Trend Finder / Momentum Change
/ CYCLE Change and Vice Versa.
Notice One thing: HOW LEVELS are Working.
Use any Momentum Indicator / Oscillator or as you "USED to" to Take entry.
━━━━━━━━━━━━━━━━━━━━━━━━━━━━━━━━━━━━━━━━━━━
⚠️ DISCLAIMER:
The information, views, and ideas shared here are purely for educational and informational purposes only. They are not intended as investment advice or a recommendation to buy, sell, or hold any financial instruments. I am not a SEBI-registered financial adviser.
Trading and investing in the stock market involves risk, and you should do your own research and analysis. You are solely responsible for any decisions made based on this research.
"As HARD EARNED MONEY IS YOUR's, So DECISION SHOULD HAVE TO BE YOUR's".
━━━━━━━━━━━━━━━━━━━━━━━━━━━━━━━━━
❇️ Follow notification about periodical View
💥 Do Comment for Stock WEEKLY Level Analysis.🚀
📊 Do you agree with this view?
✈️ HIT THE PLANE ICON if this technical observation resonates with you. It will Motivate me.
━━━━━━━━━━━━━━━━━━━━━━━━━━━━━━━━━
💡 If You LOOKING any CHART & want for Level and ANALYZE?
Share your desired stock names in the comments below! I will try to analyze the chart Levels, patterns and share my technical view (so far my Knowledge).
If Viewers think It can identify meaningful setups. Looking forward to hearing from all of you — let's keep this discussion going and help each other make better trading decisions.

REVERSED but will it sustain!? As we can see NIFTY did reversed exactly as analysed in our previous analysis as it was trading at important demand zone and a psychological level but the reversal wasn’t strong enough hence we may see weakness continuing in the index if fails to sustain itself above the psychological level so plan your trades accordingly and keep watching everyone.

TATACONSUMER | Daily TF – RISING WEDGE BreakdownTATACONSUMER is showing short-term weakness after breaking below the rising trendline and failing to hold above 1160.
As long as price stays below this level, the probability increases for a move towards 1120–1100, which aligns with a higher time-frame Bullish Order Block (Demand Zone) and Fibonacci support.
This zone is important because it previously showed strong buying interest.
Plan: No aggressive longs yet.
Wait for price reaction, structure shift, or confirmation inside the demand zone before considering fresh buys.
Market always gives confirmation—patience pays.
Not investment advice.
Regards
Bull Man

SOLARINDS — Clean Trendline Breakout After Multiple RejectionsPrice respected the descending resistance trendline multiple times, showing strong selling pressure at higher levels.
Over time, buyers kept stepping in with higher lows, compressing price into a tight range — a classic sign of accumulation.
The recent strong breakout above the trendline confirms a shift in control from sellers to buyers.
This kind of simple structure-based breakout often leads to fresh momentum when followed by good volume and follow-through.
No indicators.
Just price doing what it always does.

#NIFTY Intraday Support and Resistance Levels - 27/01/2026A gap-up opening near the 25200 zone in Nifty indicates an attempt by the market to stabilize after recent selling pressure, but the broader structure still suggests a range-bound to weak undertone unless key resistance levels are decisively crossed. The gap-up itself is not a confirmation of trend reversal; instead, it places the index right at an important decision-making area, where both buyers and sellers are active. The initial 30 minutes of trade will be critical to judge whether the gap sustains or starts filling.
From a technical perspective, the 25250–25300 region is acting as a major intraday resistance. This zone has previously seen supply and rejection, which means any upside move without volume support may struggle here. A reversal long setup becomes valid only if Nifty sustains above 25250, with follow-through buying. In such a case, upside targets can be projected towards 25350, 25400, and 25450+, where partial profit booking is advisable due to overhead supply and previous breakdown levels.
On the downside, 25200–25150 is the immediate support band. Failure to hold above this level, especially if the gap starts getting filled, can invite fresh selling pressure. A breakdown below 25200 opens up a short-selling opportunity, with downside targets around 25100, 25050, and 25000. These levels are psychologically and technically important, and price reactions here should be watched closely for potential intraday bounces.
If selling momentum intensifies and Nifty breaks below 24950, it would signal continuation of the broader bearish structure. Below this level, the index may slide towards 24850, 24800, and 24750, where stronger demand zones are placed. These lower levels can act as temporary support, but trend reversal should only be considered after clear price confirmation and structure change.
Overall, the market is showing a gap-up within a corrective or consolidation phase, not a confirmed bullish trend yet. Traders should remain level-driven, avoid chasing the opening move, and wait for price acceptance above resistance or breakdown below support. Tight stop-losses, partial profit booking, and disciplined risk management are essential, as volatility and false breakouts are likely around the current zone.

Part 2 Intraday Institutional TradingRisks in Option Trading
1. High Volatility
Premium spikes can trap traders.
2. Time Decay
Especially dangerous for option buyers.
3. Liquidity Issues
Wide spreads can cause losses.
4. Margin Risk for Sellers
Sudden market moves can cause big losses.
