XAUUSD (H3) – Liam Weekly Trading PlanStructure has shifted | Early-week focus stays SELL on rallies
Quick summary
Gold has completed a sharp downside expansion after a prolonged bullish run, breaking the prior structure decisively. The current price action shows weak recovery attempts, suggesting the move lower is corrective-to-distributive rather than a completed reversal.
For the start of the week, the bias remains clear: sell the structure, not chase bounces.
Market structure
The previous uptrend has been fully disrupted by an impulsive sell-off.
Price is now trading below former support, which has flipped into resistance.
Current rebounds lack momentum and show characteristics of corrective pullbacks, not accumulation.
This keeps the market in a sell-on-rallies environment until proven otherwise.
Key technical zones
Primary sell FVG / resistance: 4970 – 5000
This zone aligns with imbalance and prior liquidity and is the preferred area for sell reactions.
Secondary sell FVG: 4795 – 4820
A lower reaction zone where price may stall before continuing lower.
Deeper liquidity target: 4340 – 4350
This remains the main downside objective if the structure continues to unwind.
Upper invalidation zone: 5300+
Acceptance above this area would force a reassessment of the bearish bias.
Early-week scenarios
Primary scenario – SELL rallies
As long as price remains capped below the 4970–5000 zone, any rebound should be treated as corrective. The expectation is for further downside continuation toward lower liquidity.
Secondary scenario – Deeper pullback
If price fails to reclaim the first sell zone cleanly, a slow grind lower into the 4795–4820 area may occur before continuation.
Reassessment condition
Only a strong reclaim and acceptance above 5300 would invalidate the current sell structure.
Key notes
Early-week price action often clears residual liquidity.
Avoid counter-trend longs inside resistance.
Let price come to the level, then execute.
Structure > opinion.
Weekly focus:
selling corrective rallies into FVG and resistance, or waiting for price to show a clear structural shift before changing bias.
— Liam
Trendtrading

XAUUSD – H2 Technical AnalysisLiquidity Pullback Within a Strong Bullish Structure | Lana ✨
Gold continues to trade within a well-defined bullish structure on the H2 timeframe. The recent surge was impulsive, followed by a healthy retracement that appears to be rebalancing liquidity rather than signaling a trend reversal.
Price action remains constructive as long as the market respects key structural levels and the ascending trendline.
📈 Market Structure & Trend Context
The overall trend remains bullish, with higher highs and higher lows still intact.
Price continues to respect the ascending trendline, which has acted as reliable dynamic support throughout the uptrend.
The recent pullback occurred after an aggressive upside expansion, fitting the classic sequence:
Impulse → Pullback → Continuation
No clear distribution pattern is visible at this stage. As long as structural support holds, the bias remains BUY on pullbacks, not selling strength.
🔍 Key Technical Zones & Value Areas
Primary Buy POC Zone: 4764 – 4770
This area represents a high-volume node (POC) and aligns closely with the rising trendline.
It is a natural zone where price may rebalance before resuming the bullish trend.
Secondary Value Area (VAL–VAH): 4714 – 4718
A deeper liquidity zone that could act as support if sell pressure temporarily increases.
Near-term resistance: 4843
Acceptance above this level strengthens the continuation scenario.
Psychological reaction zone: 4900
Likely to generate short-term hesitation or profit-taking.
Higher-timeframe expansion targets:
5000 (psychological level)
2.618 Fibonacci extension, where major liquidity may be resting.
🎯 Trading Plan – H2 Structure-Based
✅ Primary Scenario: BUY the Pullback
Buy Entry:
👉 4766 – 4770
Lana prefers to engage only if price pulls back into the POC zone and shows bullish confirmation on H1–H2 (trendline hold, strong rejection of lower prices, or bullish follow-through).
Stop Loss:
👉 4756 – 4758
(Placed ~8–10 points below entry, beneath the POC zone and the ascending trendline)
🎯 Take Profit Targets (Scaled Exits)
TP1: 4843
First resistance zone — partial profit-taking recommended.
TP2: 4900
Psychological level with potential short-term reactions.
TP3: 5000
Major psychological milestone and upside expansion target.
TP4 (extension): 5050 – 5080
Area aligned with the 2.618 Fibonacci extension and higher-timeframe liquidity.
The preferred approach is to scale out gradually and protect the position, adjusting risk as price confirms continuation.
🌍 Macro Context (Brief)
According to Goldman Sachs, central banks in emerging markets are expected to continue diversifying reserves away from traditional assets and into gold.
Average annual central bank gold purchases are projected to reach around 60 tons by 2026, reinforcing structural demand for gold.
This ongoing accumulation supports the idea that pullbacks are more likely driven by positioning and profit-taking, rather than a shift in long-term fundamentals.
🧠 Lana’s View
This remains a pullback within a bullish trend, not a bearish reversal.
The focus stays on buying value at key liquidity zones, not chasing price at highs.
Patience, structure, and disciplined execution remain the edge.
✨ Respect the trend, trade the structure, and let price come to your zone.

XAUUSD H4 – Gold Trading Strategy Next Week(Liquidity-Based Levels)
Gold is heading into a key decision week as price returns to a major reaction area. The market is currently best traded by waiting for liquidity reactions at the highlighted zones, rather than chasing moves in the middle of the range.
1) H4 Technical Context
Price has recovered and is now retesting a key pivot region around the 4.45xx area.
The chart shows clear supply zones overhead, while the 4445–4449 zone stands out as the highest-probability buying reaction area.
If price holds this buying zone, the preferred path is continuation higher toward the upper supply region near 4632–4637.
2) Key Levels to Watch
Main BUY zone: 4445 – 4449
Liquidity confluence area with strong probability of bullish reaction if structure remains intact.
Mid resistance: 4550 – 4560
A reaction zone where buyers may take partial profits and where price behavior matters.
Target SELL zone (scalping): 4632 – 4637
Strong overhead supply. Ideal for short-term selling reactions if price rallies sharply and shows rejection.
Strong support: around 4408
If the main buying zone fails, this level becomes the next key area that defines whether the pullback deepens.
3) PRIORITY SCENARIO – Main Plan (Buy with Structure)
Next week’s primary strategy remains trend-following, but execution should be level-based.
Buy area: 4445–4449
Best confirmation: H4/H1 candles hold the zone and close back above it without a strong breakdown.
Upside expectations: push toward 4550–4560 first, then extend toward 4632–4637.
4) ALTERNATIVE SCENARIO – If the Buy Zone Fails
If price breaks 4445–4449 cleanly and accepts below it:
A deeper correction can develop toward 4408 and potentially lower.
In that case, the plan is to wait for a clear reaction at support before looking for the next long setup.
5) SELL Scenario – Short-Term Only
Selling is not the primary strategy. It is only considered as a short-term scalp at premium supply.
Sell zone: 4632–4637
Only sell on clear rejection signals such as strong wicks, failed breakout, or a lower-timeframe structure shift.
6) Weekly Summary
Focus zone: 4445–4449 is the key decision area
Hold above it → prefer BUY toward 4550–4560 and 4632–4637
Lose it → watch 4408 for deeper correction reaction
Sell ideas are scalps only at the upper supply zone

XAUUSD (H4) – Monday StrategyGeopolitical shock risk, gold may spike | Trade liquidity and reaction zones only
Quick summary
News around Trump’s claim that Maduro has been detained, plus Venezuela’s response (they don’t know his and his wife’s whereabouts and are demanding proof of life), raises geopolitical uncertainty sharply. For gold, that’s a classic catalyst for a gap/spike at Monday open.
So my rule for Monday: no FOMO, only trade liquidity zones and confirmed reactions on the chart.
1) Macro context: Why gold can surge on Monday
Rising geopolitical tension often drives flows into safe-haven assets like gold.
When facts are unclear and tensions escalate, the market can open with:
✅ sharp spikes, ✅ liquidity sweeps, ✅ wider spreads.
➡️ Best approach: wait for price to hit levels, then trade the reaction — not the headline.
2) Technical view (H4 – based on your chart)
Gold is currently moving inside a larger structure after a heavy move, and your chart highlights the key zones clearly:
Key zones
Sell test support 4450 (pullback area where price may get sold)
Liquidity 4330 (major liquidity magnet)
OB 4309 (order block / short-term reaction zone)
Support 4277 (intermediate support)
Buy zone 4203–4206 (deep support / swing buy area)
3) Monday trading scenarios (Liam style: trade the level)
Scenario A (priority): Spike up → SELL around 4450
✅ If gold pumps on the headline at the open:
Sell around 4450 (sell-test zone)
SL: above the most recent swing high (refine on lower TF)
TP1: 4330
TP2: 4309
TP3: 4277
Logic: Headline-driven opens often spike to sweep buy-side liquidity first, then rotate back into value/liquidity.
Scenario B: Sweep down → BUY at liquidity zones
✅ If price gets pulled down first:
Buy around 4330 (Liquidity)
Buy confirmation at 4309 (OB)
SL (guide): below 4300
TP: 4380 → 4450 (scale out)
Logic: 4330 is a major liquidity magnet and often produces a sharp reaction bounce.
Scenario C (worst-case dump): BUY the deep support 4203–4206
✅ If volatility is extreme and price flushes:
Buy: 4203 – 4206
SL: 4195
TP: 4277 → 4330
Logic: This is a deep swing-buy area if the market does a hard liquidity reset.
4) Key notes for a headline-driven Monday open
Avoid trading the first 5–10 minutes if spreads widen.
Only enter once price hits the level and shows a clear reaction (rejection / engulf / MSS on M15).
Reduce size — geopolitical opens can whip hard.
Do you think Monday’s move sweeps up into 4450 first, or drops straight into 4330 liquidity?

Gold Update: Watching Channel Support for ContinuationGuys last trade of the year haha, let's see if we got something in this trade. Gold is trading inside a rising channel, and the overall structure remains positive. After the recent move up, price has pulled back toward the lower side of the channel, which is a normal and healthy behavior in an uptrend.
This pullback is bringing price closer to a key support area, where buyers have previously stepped in. As long as price holds above this support, the probability favors upside continuation rather than a breakdown.
This is not a breakout trade. It is a buy-on-pullback setup, where patience matters more than speed. A clear hold near support is what keeps this setup valid.
Disclaimer: This analysis is for educational purposes only and should not be taken as financial advice. Please do your own research or consult your financial advisor before investing.
Analysis By @TraderRahulPal | More analysis & educational content on my profile.
If this update helped, like and follow for regular updates.

XAUUSD (H1) – Early 2026 ForecastShort-term recovery inside a larger bullish cycle 💛
Quick market recap
2025 performance: Gold surged ~64%, the strongest annual gain since 1979
Recent move: Sharp year-end correction driven by profit-taking and margin adjustments, not trend reversal
Big picture: The multi-year bull market in precious metals remains intact
Fundamental context (why the trend still matters)
Despite the late-2025 pullback, the broader precious metals complex remains structurally strong. Gold, silver, platinum, and palladium all benefited from:
Fed rate-cut cycle expectations
Persistent geopolitical tensions
Strong central bank buying
Industrial demand and supply constraints (especially for silver and platinum)
Most analysts agree the recent correction was technical in nature. The long-term outlook still points toward gold potentially testing 5,000 USD/oz and silver approaching 100 USD/oz in 2026, although short-term volatility is expected to remain high.
Technical view (H1) – Based on the chart
After failing to hold above the ATH, gold experienced a sharp bearish displacement, followed by a stabilization phase near a strong support zone. Price is now attempting a recovery, but the structure suggests this is still a corrective move within a broader range.
Key observations:
Strong sell-off broke short-term bullish structure
Price is rebounding from major support, forming a potential higher low
Overhead liquidity and Fibonacci zones remain key reaction areas
Key levels Lana is watching
Buy zone – Strong liquidity support
Buy: 4345 – 4350
This is a strong liquidity zone where price already reacted. If price revisits this area and holds structure, it offers a favorable risk-to-reward buy aligned with the larger bullish cycle.
Sell zone – Short-term resistance (scalping)
Sell scalping: 4332 – 4336
This zone aligns with short-term resistance and Fibonacci reaction levels. If price fails here, a brief pullback toward support is possible.
Important overhead liquidity
Key liquidity: 4404 area
A clean break and hold above this level would signal stronger bullish continuation toward higher targets.
Scenarios to consider
Scenario 1 – Range correction continues
Price reacts at short-term resistance, rotates back into liquidity, and builds a base before the next directional move.
Scenario 2 – Bullish continuation resumes
A break above overhead liquidity opens the path toward higher levels, potentially retesting prior highs as the new year unfolds.
Lana’s approach 🌿
Trade zones, not headlines
Focus on price reaction at liquidity levels
Accept short-term volatility while respecting the long-term bullish structure
This analysis reflects Lana’s personal market view and is not financial advice. Please manage risk carefully and trade responsibly 💛

XAUUSD (H1) – Short-term Correction After ATH Lana focuses on sell rallies, waiting for a deeper buy zone 💛
Quick overview
Market state: Sharp sell-off after failing to hold above ATH
Timeframe: H1
Current structure: Strong bearish impulse → corrective rebound in progress
Intraday bias: Sell on pullbacks, buy only at major support
Technical picture (based on the chart)
Gold printed a clear distribution top near ATH, followed by a strong bearish displacement. This move broke the short-term bullish structure and shifted momentum to the downside.
Price is now attempting a technical rebound, but so far this looks corrective rather than impulsive. As long as price stays below key resistance, Lana treats this as a sell-the-rally environment.
Key observations:
Strong bearish candle confirms loss of bullish control
Current rebound is moving into prior liquidity + Fibonacci reaction zone
Market is likely building a lower high before the next move
Key levels to trade
Sell zone – priority setup
Sell: 4392 – 4395
This zone aligns with:
Prior structure resistance
Fibonacci retracement area
Liquidity resting above current price
If price reaches this zone and shows rejection, Lana will look for sell continuation.
Buy zone – only at strong support
Buy: 4275 – 4278
This is a higher-timeframe support zone and the first area where buyers may attempt to step back in. Lana only considers buys here if price shows clear reaction and stabilization.
Intraday scenarios
Scenario 1 – Rejection at resistance (preferred)
Price retraces into 4392–4395, fails to break higher, and rolls over → continuation to the downside, targeting deeper liquidity.
Scenario 2 – Deeper correction then recovery
If selling pressure extends, price may sweep liquidity into 4275–4278 before forming a base for a larger rebound into the new year.
Market tone
The recent move reflects profit-taking and risk reduction after an extended rally. With year-end liquidity thinning out, price action can remain volatile and deceptive, making zone-based trading essential.
This analysis reflects Lana’s technical view and is not financial advice. Always manage your own risk and wait for confirmation before entering trades 💛

Gold Holds Rising Channel – Upside Targets Still OpenGold is trading inside a clean rising channel, forming clear higher highs and higher lows, which confirms that the overall trend remains bullish. Instead of chasing breakouts, price is now doing what strong trends usually do, pause and consolidate before the next move.
The marked buying zone sits perfectly inside the rising channel and has already acted as a strong demand area. As long as Gold holds above this zone, buyers remain in control and upside continuation remains the higher probability scenario.
Upside targets are aligned with the channel resistance, which adds further confidence to this setup. These types of structures often reward traders who wait for pullbacks rather than reacting emotionally to fast candles.
A breakdown below the marked invalidation level would weaken this bullish view, but until then, the structure favors patience and trend-following.
Key Levels to Watch
Best Buying Range: 4519–4515
1st Target: 4535
2nd Target: 4553
Final Target: 4570
Structure Invalidation: Below 4497
Trend Bias: Bullish above support
Disclaimer: This analysis is for educational purposes only and should not be taken as financial advice. Please do your own research or consult your financial advisor before investing.

Chumtrades XAUUSD Any pullback is an opportunity to buy higher.This morning’s move was a corrective sell-off, best understood as profit-taking from BUY-side, not a trend reversal.
The overall structure remains within a rising trend channel, with no sign of a structural break → BUY bias stays intact, looking to buy pullbacks in line with the trend.
🟢 Key Support Zones
447x: near-term support (4476 – 4472 – 4470)
4450 – 4455
4430 – 4435
🔴 Key Resistance Zones
4548 – 4550
4560 – 4565
4599 – 4600 (upper resistance)
📌 Additional Note
453x is a mid-zone to watch closely for price reaction.
📊 Intraday Expectation
Price is expected to range sideways on the H2 timeframe
Range high: 4549
Range low: 4473
→ Possible BUY near the lower boundary and SELL near the upper boundary if the range holds.
⚠️ Risk Management
No major news at the moment; price is mainly driven by technical flows.
Holiday period → thin liquidity, higher risk of stop hunts.
Keep stops reasonable and avoid overtrading.
Wishing everyone a productive trading day.

XAUUSD H4 – Trading the Uptrend Channel with LiquidityXAUUSD H4 – Trading the Uptrend Channel with Liquidity and Volume Profile
Gold remains bullish on the H4 timeframe and continues to respect a well-defined rising channel. With price approaching extended areas, the higher-probability approach is to buy pullbacks at value zones and treat the upper boundary as a short-term profit-taking area rather than chasing momentum.
TECHNICAL CONTEXT
The uptrend structure is still intact, with price forming higher lows inside the channel.
After a strong impulsive leg, the market is now consolidating and rebalancing, which favours execution around Volume Profile and FVG zones.
The upper channel boundary often acts as a short-term exhaustion area, while value zones below offer better risk-to-reward long entries.
PRIORITY SCENARIO – MAIN PLAN
Buy the pullback at key value and liquidity zones
Buy POC: around 4485
Buy zone FVG support: around 4368
Rationale:
The 4485 POC is a high-volume area where price frequently reacts during pullbacks.
The 4368 FVG aligns with channel support and represents an imbalance area that price often revisits before continuation.
Expected behaviour:
A pullback into POC or the FVG zone, followed by a bullish reaction, can set up the next leg higher within the channel.
ALTERNATIVE SCENARIO – SECONDARY PLAN
Short-term sell scalp near the upper boundary
Sell scalping zone: around 4600
Note:
This is strictly a short-term scalp if price reaches the upper channel boundary and shows clear rejection. It is not a trend reversal thesis.
KEY TAKEAWAYS
The H4 trend remains bullish, but the channel range is wide, making chasing price riskier.
Volume Profile and FVG zones define higher-probability execution areas.
The best edge comes from buying pullbacks at value, while treating 4600 as a potential short-term reaction zone.

XAUUSD H1 – Trading Liquidity During the Year-End SessionXAUUSD H1 – Trading Liquidity During the Year-End Session
Gold remains in a bullish structure, but this is a holiday market with weaker liquidity as many banks are closed. The best approach here is to trade around liquidity and value areas, rather than chasing price during extended moves.
TECHNICAL OVERVIEW
On H1, price continues to respect an ascending channel, moving through expansion and pullback phases.
After the latest strong push, the market is now consolidating and rotating, which typically favours level-based execution.
Momentum remains positive overall, but it is not accelerating aggressively, suggesting selective buying and a higher probability of liquidity sweeps during thin conditions.
PRIORITY SCENARIO – MAIN PLAN
Buy the pullback at key liquidity zones inside the bullish channel
Buy liquidity zone: 4475 – 4478
Buy POC zone: 4409 – 4412
Technical rationale:
The 4475–4478 area is a near-term liquidity pocket within the channel where buyers often step in during technical pullbacks.
The 4409–4412 region aligns with the Volume Profile POC, a value area where price frequently stabilises and rebalances supply and demand.
Expected price behaviour:
A corrective move into these liquidity zones, followed by a bullish reaction, can set up the next leg higher within the channel structure.
ALTERNATIVE SCENARIO – SECONDARY PLAN
Short-term sell only at the upper boundary as a scalp
Sell zone: 4565 – 4469
Context:
This zone sits near the upper channel boundary where profit-taking is common, especially when liquidity is thin. Any sell idea should be treated as a short-term scalp rather than a trend reversal.
WHY LIQUIDITY-BASED TRADING MATTERS HERE
Holiday sessions can produce irregular flows, sharp spikes, and stop runs
Volume Profile helps define higher-probability execution areas instead of emotional entries
Trading around value and liquidity improves consistency when price action becomes less reliable
FUNDAMENTAL BACKDROP AND MARKET SENTIMENT
OANDA traders highlight multiple drivers behind the strength in precious metals, with longer-term projections pointing to further upside for gold and silver next year. The narrative remains supported by safe-haven demand, expectations of easier monetary conditions, and a softer USD tone.
Still, in the short term, the holiday environment can distort price action, making liquidity zones even more important for execution.

XAUUSD (H4) – Tuesday ForecastBroke the old ATH, trend continuation | Buy the pullback at 4442, sell premium at 4559
Strategy summary
Gold has broken the previous all-time high (ATH) and the bullish structure remains intact. Today my priority is still buying with the trend, but only on a clean pullback — no chasing. The secondary plan is a reaction sell at a premium Fibonacci zone if price extends too aggressively.
1) Technical view (based on your chart)
The breakout above the old ATH is a strong bullish signal: we have a clear higher high and price is building a new base.
The chart highlights a Buy VL / value area just below current price — a logical pullback zone to reload longs.
Above, there’s a 1.618 Fibonacci premium sell zone, where profit-taking often shows up.
Key point: The trend is bullish, but the higher we go, the more likely we see sharp wicks and quick pullbacks. Stay disciplined and trade the levels.
2) Trade plan for today (clear entry, SL, target)
Scenario A (priority): BUY the Asia pullback
✅ Buy: 4442
SL: 4435
Target: 4747 (your projected target)
Logic: This is a clean pullback into the session value area. If price holds here, continuation becomes the higher-probability path.
Scenario B: SELL the premium Fibonacci reaction
✅ Sell: 4559
SL: 4568
TP: scale out on the reaction (short-term profit-taking), or manage based on momentum after rejection
Logic: 4559 is a premium Fibonacci zone. If price spikes into it, a rejection move is very common — but only sell with reaction, not by chasing.
3) Macro context (why gold stays supported)
XAU/USD is building on yesterday’s strong rally (+2%) and is printing fresh record highs for a second day.
Price is pushing toward the 4,500 psychological level during Asia, supported by multiple safe-haven drivers.
Comments from US Treasury Secretary Scott Bessent add uncertainty around the long-term reliability of Fed policy — and uncertainty typically supports gold.
4) Risk management (Liam rule)
Don’t chase after breakout. Only buy at 4442 as planned.
Risk per trade: max 1–2%.
If stopped out, wait for the next structure — no revenge trading.
What’s your bias today: buying the 4442 pullback, or waiting for a 4559 reaction sell?

XAUUSD H1 Trading with Volume Profile Ahead of CPI RiskXAUUSD H1 Trading with Volume Profile Ahead of CPI Risk
Gold is slowing down as the market awaits news and liquidity is fragmented, so prioritize trading according to Volume Profile zones to choose advantageous entry points instead of chasing prices.
PRIORITY SCENARIO
Strategy to buy at POC and VAL zones according to Volume Profile, suitable for a medium-term perspective.
Buy zone: 4314 – 4317
SL: 4307
TP: 4328 – 4345 – 4363 – 4370
Technical context:
On H1, the price is accumulating and reacting around the value area. The 4314–4317 area is the POC and VAL zone, often a liquidity attraction point and likely to see buying pressure if the structure maintains support.
Expected movement:
Price holds the 4314–4317 zone, absorbs short-term selling pressure, then rebounds to the above TP levels. When approaching 4345, monitor reactions as this is an area prone to selling pressure.
Position management:
If the price quickly rises but fails to hold above 4328, consider reducing risk. If the price clearly breaks below 4307, prioritize stopping the buy scenario and wait for a deeper zone.
ALTERNATIVE SCENARIO
Sell scalping strategy at short-term resistance zone, higher risk as the larger trend still favors buying.
Sell scalping zone: 4343 – 4346
SL: 4353
TP: 4325 – 4310 – 4290
Technical context:
The 4343–4346 area is a sell scalping zone on the chart, suitable for short-term trading when the price rebounds to resistance and clear rejection signals appear.
Note:
Sell should only be a scalping order. Do not prioritize holding long sell positions if the market is still in an accumulation phase awaiting news.
MAIN REASON
Volume Profile shows that POC and VAL zones are advantageous entry points during a sideways market lacking a clear trend.
The 4314–4317 zone acts as a value support area for finding buy points, while 4343–4346 is suitable for sell scalping when the price rebounds to resistance.
When the market awaits news, the likelihood of liquidity sweeps increases, so trading by zones will be more effective than chasing candles.
MACRO CONTEXT AND CPI DATA
The upcoming US CPI release during the North American session will be the main variable guiding Fed policy expectations, directly impacting USD and gold. Ahead of data risk, dovish expectations from the Fed are causing USD to lack strong upward momentum, but volatility may spike suddenly at the time of the news release, creating spikes and sweeping SL on both ends.
RISK MANAGEMENT AND MONITORING
Do not open orders when the price is between zones and has not reached the exact levels of 4314–4317 or 4343–4346.
Prioritize reducing volume before CPI or only maintain positions that are already profitable and manage tightly.
Focus on observing price reactions at POC VAL and sell scalping zones, as these are decisive points for short-term direction.

XAUUSD H1 Analysis Before Key NewsXAUUSD H1 Analysis Before Key News
During the Asian-European session, gold is likely to move sideways awaiting news as the market enters a sensitive phase with data and political factors, amidst a clearly formed short-term downtrend structure.
PRIORITY SCENARIO
Trading strategy according to the current structure, prioritizing short-term sell and buy at lower liquidity zones.
Main sell zone: around 4323, coinciding with the POC of the Volume Profile.
Technical context: price is moving below the equilibrium zone, clear H1 downtrend structure; the POC area often acts as a "pullback to sell" price zone.
Expected movement: early European session may see a pullback of about 40–50 points, then price returns to sideways movement and faces downward pressure again.
Position management:
Sell should only be held short-term and tightly managed when price reacts at 4323. If price surpasses POC and holds above this zone, risk should be reduced and avoid holding sell positions.
ALTERNATIVE SCENARIO
Strategy to buy at lower liquidity zones, suitable for medium-term trading.
Buy zone 1: around 4242, important VAH zone.
Buy zone 2: around 4215, Buy Zone according to Volume Profile.
Technical context: these are two price zones with high liquidity density, often attracting buying force when the market needs to rebalance after a decline.
Expected movement: price sweeps liquidity below, creating a new accumulation base and seeking recovery opportunities.
MAIN REASON
On H1, a downtrend structure has formed after a distribution phase, indicating short-term advantage leans towards the sell side.
Volume Profile clearly identifies POC 4323 as a reasonable pullback zone to sell, while 4242 and 4215 are price zones with high probability of buying reaction.
Sideways scenario before news fits the market context awaiting important macroeconomic and political information.
MACRO CONTEXT AND POLITICAL NEWS
Political factors are strongly impacting the currency market, especially the USD. The US is said to have proposed a security guarantee mechanism for Ukraine similar to NATO's Article 5 to promote negotiations to end the conflict with Russia, although territorial issues have not yet reached consensus.
These signals are putting weakening pressure on the USD, thereby continuing to support gold in the medium term. However, in the short term, strong volatility around news release time is something to be particularly noted.
RISK MANAGEMENT AND MONITORING
Do not prioritize trading when price is between the equilibrium zone and has not reached important Volume Profile levels.
Sell orders should only be considered short-term trades before news, avoiding holding through data release or important political speeches.
Medium-term buy strategy will have more advantage if price reacts clearly at 4242 or deeper at 4215.
Closely monitor USD fluctuations as current political news is the main driving factor.

XAUUSD H1 Analysis Based on Volume ProfileXAUUSD H1 Analysis Based on Volume Profile
Gold is moving sideways and consolidating around the 4,300 USD/oz area. The short-term direction remains unconfirmed and requires clear reactions at key liquidity zones.
PRIORITY SCENARIO – MAIN SCENARIO
Medium-term trend-following buy strategy at price areas with Volume Profile advantage
Primary buy zone: around 4284 based on VAL
Technical context: this is the lower value area where buying interest is likely to appear as the market continues to consolidate
Price expectation: price holds above VAL, absorbs short-term selling pressure, and gradually rotates back toward the upper balance area
Position management:
If price reacts positively and H1 candles hold above the 4284 level, a medium-term bullish bias in line with the main trend can be maintained.
If price breaks clearly below VAL, caution is required and deeper reaction zones should be monitored.
ALTERNATIVE SCENARIO – SECONDARY SCENARIO
Deeper buy opportunity in the event of additional liquidity sweep
Alternative buy zone: around 4242, based on the VAH of the previous value area
Technical context: this area represents the upper value zone of the prior consolidation and may act as strong support during a deeper pullback
Price expectation: downside liquidity sweep followed by a recovery, restoring market balance
SELL SCENARIO – HIGH RISK
Sell positions should only be considered as short-term trades, not a primary strategy
Short-term sell zone: around 4378, based on the 2.618 Fibonacci extension
Note: sells should only be considered if clear price rejection signals appear. Avoid holding short positions for extended periods while the broader trend remains bullish.
KEY REASONS
On the H1 timeframe, price is consolidating, indicating the market needs additional liquidity before confirming the next directional move
Volume Profile clearly highlights high-probability trading zones, particularly VAL at 4284 and VAH at 4242
The 4378 level represents an extended resistance zone suitable for profit-taking or short-term countertrend sells
MACRO CONTEXT AND MARKET SENTIMENT
Gold continues to hold strong near the 4,300 USD/oz level, supported by expectations of continued monetary easing from the Federal Reserve and rising safe-haven demand.
Meanwhile, silver has faced short-term profit-taking pressure after reaching record highs, reflecting a more cautious market tone.
This week’s focus is on the US Nonfarm Payrolls report. Weak data may reinforce gold’s bullish trend, while strong data could trigger a short-term correction amid ongoing policy uncertainty within the Fed.
RISK MANAGEMENT AND MONITORING
Avoid trading while price remains in the middle of the consolidation range and away from key Volume Profile levels.
The medium-term buy strategy loses its edge if price breaks clearly below 4242 and fails to reclaim the level.
Closely monitor volatility around the Nonfarm release, as sharp spikes and liquidity sweeps are highly likely.

XAUUSD H4 Medium Term Rising Channel and Key Liquidity ZonesXAUUSD H4 – Medium-Term Rising Channel and Key Liquidity Zones
Gold reacted sharply after touching the trendline, with the primary focus next week on buying pullbacks in line with the dominant trend
PRIORITY SCENARIO – MAIN STRATEGY
Trend-following buy strategy on a corrective move into key support and liquidity areas
Primary buy zone: 4175 – 4203
Technical context: this area represents a previously validated support zone and a clear pool of downside liquidity
Price expectation: a corrective dip into support, absorption of selling pressure, followed by a potential rebound back toward the upper balance area
Position management:
If price shows a strong reaction and H4 candles hold above the support zone, maintaining a swing-long bias remains favoured.
If price breaks decisively below support, risk should be reduced and deeper levels monitored.
ALTERNATIVE SCENARIO – SECONDARY STRATEGY
Deeper pullback buy opportunity near the lower trendline of the rising channel
Alternative buy zone: near the lower boundary of the rising channel, aligned with long-term liquidity
Technical context: this area acts as the last line of defence for the medium-term bullish structure and is suitable for longer-term positioning
Price expectation: a deeper liquidity sweep followed by recovery, reaffirming the rising channel
KEY TECHNICAL POINTS
On the H4 timeframe, price continues to trade within a rising channel. The sharp 100-point drop after touching the upper trendline highlights profit-taking pressure at higher levels
The 4175 area and the lower channel trendline remain the most important liquidity zones for trend-aligned buying
Upper resistance and the FVG-liquidity zone are better suited for trade management rather than aggressive new longs
MACRO AND MARKET CONTEXT
Markets are reacting to growing expectations of a potential shift in future Federal Reserve leadership and policy direction.
The probability of Kevin Warsh becoming the next Fed Chair has increased, alongside comments indicating a preference for significantly lower interest rates.
Such expectations may remain supportive for gold in the medium term, although short-term technical corrections should still be respected after strong upside moves.
RISK MANAGEMENT AND MONITORING
Avoid chasing price near the upper boundary of the rising channel.
Any sell positions should be treated as short-term countertrend trades and only considered with clear rejection signals.
The bullish scenario weakens if price breaks and fails to reclaim the rising channel structure.
Remain alert to volatility around policy-related headlines and key economic data, as liquidity sweeps are likely.

XAUUSD H1 Volume Profile and Key Price AreasXAUUSD H1 – Volume Profile and Key Price Areas
Gold remains in a strong uptrend, with the primary strategy focused on buying pullbacks
PRIORITY SCENARIO – MAIN STRATEGY
Buy-the-dip approach aligned with the dominant trend using Volume Profile levels
Expected buy zone: around 4253 based on VAH
Short-term range to monitor: 4263 – 4285
Price expectation: rebound from VAH toward the upper range before further expansion
Position management:
If price holds above the 4263 area and shows clear bullish reaction, maintaining long exposure remains favorable.
If price is strongly rejected near 4285, risk should be reduced as this zone represents an important short-term resistance.
ALTERNATIVE SCENARIO – SECONDARY SETUP
Short-term countertrend opportunity at an extended resistance level
Sell zone for the alternative scenario: around 4310 at the Fibonacci extension
This setup is only considered if clear rejection signals appear at the level
KEY REASONS
The bullish structure on the H1 timeframe remains intact
Volume Profile highlights the VAH near 4253 as a high-probability reaction zone
The 4310 area represents an extended resistance suitable for profit-taking or short-term pullback reactions
MACRO CONTEXT
The Federal Reserve continues its rate-cutting cycle and maintains a dovish stance, putting pressure on the US dollar and supporting gold prices.
Geopolitical tensions and concerns about US economic slowdown further reinforce safe-haven demand.
Markets are now focused on the upcoming Nonfarm Payrolls report, where weaker data could drive further upside, while stronger data may trigger a short-term correction.
RISK MANAGEMENT AND MONITORING
Avoid chasing price while gold trades within the 4263 – 4285 range.
The bullish scenario becomes invalid if price breaks clearly below the support area beneath the VAH.
Expect increased volatility around major economic data releases and manage exposure accordingly.

XAUUSD – Brian | Volume Profile before FedXAUUSD – Brian | Volume Profile before Fed: watch for a rebound to sell down
Market snapshot
Ahead of the Fed's interest rate announcement, gold is moving sideways within a fairly wide range, not yet choosing a clear direction.
In the H1 timeframe, the price fluctuates around the value area, making it very suitable for short-term trading according to the Volume Profile instead of trying to predict the meeting outcome.
Volume Profile – Key price areas
Nearest VAL: around 4.197 – the bottom of the current value area, where there was previous buying support.
Above, the FVG area + VAH/POC cluster is around 4.210 – this is an "air pocket" area where selling pressure can easily appear when the price fills the liquidity gap.
Below, the target for a downward wave if the Fed is not too dovish is around 4.13x (area 4.130–4.135) – coinciding with the old buy zone on the chart.
Trading scenario according to Volume Profile
Watch for a light Buy reaction at VAL 4.197
If the price slides to 4.197 and a nice rejection candle appears on H1/M15, a short scalp buy can be considered:
Idea: capture the rebound from VAL back to the middle/top of the value area, do not hold the position long.
Sell when the price fills FVG around 4.210 (priority scenario)
After the rebound from VAL, the FVG area 4.210 will be where Brian prioritizes watching for a Sell:
Reference sell entry: around 4.208–4.212
TP1: 4.185–4.180
TP2: 4.165–4.160
TP3: area 4.13x (4.130–4.135) if a strong sell-off occurs after the Fed
SL should be placed neatly above the FVG/VAH area (e.g., 4.218–4.220), avoid setting it too far.
Fed context – Why trade cautiously?
The focus this week is the FOMC meeting:
The market is waiting to see if Chairman Powell can create enough consensus to continue cutting interest rates with very few members opposing, similar to the previous 25 bps cut.
If the Fed maintains a dovish tone → USD weakens, yields cool down, gold is likely to bounce back after the sweep.
If Powell signals a "hawkish rate cut" (concern about inflation, cut less – talk tough) → yields rise, gold may complete a deep decline to the 4.13x area before stabilizing again.

XAUUSD – Brian | H1 Volume ProfileXAUUSD – Brian | H1 Volume Profile: risk of deep decline as market awaits PCE data
Market snapshot
On H1, gold is declining in a rather "clean" structure, continuously creating lower highs and lower lows.
The 4.175 area is currently the nearest support – if breached, the decline could extend another 50–60 points to lower areas.
Price remains below 4.250 USD, as the market awaits PCE data (Fed's preferred inflation measure) to find a clearer direction.
Technical map – Volume Profile & price areas
Important areas today: 4.210 – 4.200 – 4.175 – 4.164 – 4.133
4.210–4.200: upper area, coinciding with the nearest POC/VAH cluster – selling pressure likely when price retraces here.
4.175: short-term support + area with sell-side liquidity; if this area is lost, price could be pulled to a deeper demand cluster.
4.164–4.133: potential Buy zone in a deep decline scenario – Volume Profile shows significant buying occurred around this area previously.
In short: on H1, the trend is down, prioritize selling according to volume; consider buying only when price falls to a lower discount area.
Trading scenario reference
(Not personalized advice – adjust volume & SL according to your account)
Scenario 1 – Sell following the downtrend structure (priority)
Sell area: 4.210–4.200 (POC/VAH + technical retracement area)
Idea: Wait for price to retrace to this area, observe H1/M15 for rejection candles (long upper tail, pin bar, engulfing…) before activating a Sell order.
Suggested take profit areas: TP1: 4.175
TP2: 4.164
TP3: 4.133 (in case of a strong 50–60 point decline)
Scenario 2 – Buy at deep discount area
Buy area: 4.164–4.133
Idea: Only consider buying when price has "dumped" deeply enough into the buy zone, with clear reversal candles on H1.
At that point, this is a technical retracement play, not trying to catch the bottom of a major trend.
Suggested take profit areas:
TP1: return to 4.175
TP2: 4.200
Macroeconomic context – Why is gold still hesitant?
Gold recorded a slight increase on Friday, but remains within the narrow trading range of the week.
Expectations of a dovish Fed continue to pressure the USD, generally supporting gold in the medium term.
However, buyers are waiting for US PCE data before taking larger positions:
If PCE cools significantly → reinforces the story of an early Fed rate cut → gold could easily rebound.
If PCE remains stubborn → market fears a "hawkish rate cut" scenario from the Fed → yields may rise, adding selling pressure on gold.
Risk management
For the Sell scenario, avoid chasing price in the middle of the area – prioritize waiting for a retracement to POC/VAH before entering, with a tight SL above the 4.210–4.215 area.
If participating in the Buy play at 4.164–4.133, consider splitting TP and moving SL to breakeven as soon as TP1 is reached to avoid constant chart monitoring.

Gap-Up Premium Continuation Observation | Intraday OptionsThis idea is based on a simple price behavior observation in option premium. When the option premium opens with a gap-up and continues to trade above the initial range with higher highs, it often shows bullish strength in that premium for the session.
In this setup, after the gap-up opening, the premium respected an upward trend structure and maintained strength throughout the day. This indicates sustained buying interest, which traders can observe for intraday momentum opportunities.
⚠️ This chart is shared only for educational and observational purposes.
It is not a buy/sell recommendation. Options trading involves high risk. Always use proper risk management and confirmation from your own analysis before taking any trade.
✅ Short Caption for Chart (Safe & Professional)
You can use any ONE of these directly on the chart:
“Gap-Up Premium with Intraday Strength – Bullish Continuation Observation”
“When Premium Gaps Up and Maintains Higher Structure, Strength Often Persists”
“Gap-Up + Trend Hold = Intraday Premium Momentum (Observational Setup)”
“Educational View: Gap-Up Premium Showing Sustained Buying Pressure”
✅ Disclaimer
“For educational purposes only”
“No guaranteed outcome”
“Use your own confirmation”

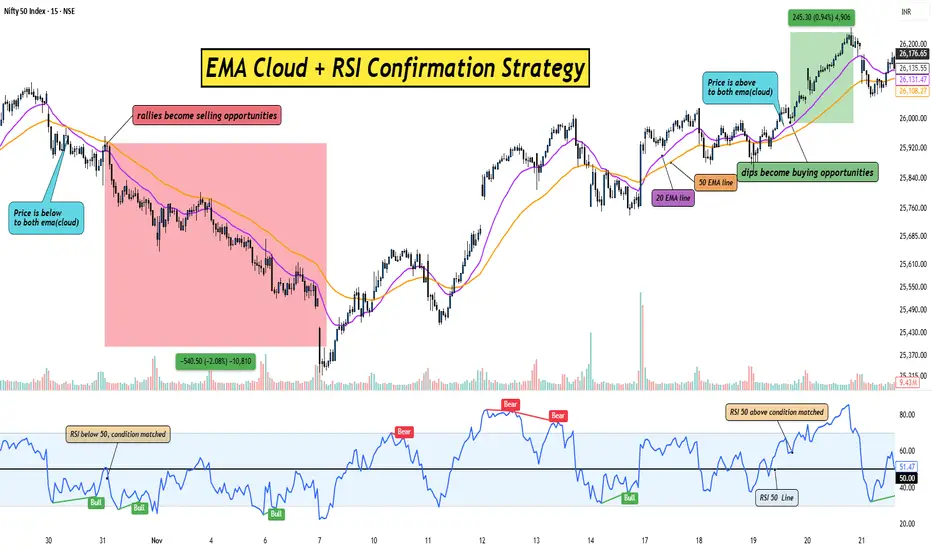
The EMA Cloud+RSI Combo That Traders Are Using to Catch Big MoveHello Traders!
If you struggle with false breakouts and early entries, this simple combination of the EMA Cloud and RSI Confirmation can help you filter noise and catch cleaner trend moves.
This setup works for Stocks, crypto, indices, forex, any market where trends matter.
Let’s break it down in the simplest way possible.
1. What Is the EMA Cloud?
The EMA Cloud is a zone created using two EMAs, commonly the 20 EMA and 50 EMA.
When price stays above the cloud, the trend is bullish and dips become buying opportunities.
When price stays below the cloud, the trend is bearish and rallies become selling opportunities.
The cloud visually shows where momentum is strong versus where price is losing strength.
2. Why Add RSI Confirmation?
RSI helps you avoid chasing overextended moves.
You only take a trade when RSI aligns with the cloud direction, giving you confirmation.
This reduces false entries and improves accuracy.
EMA Cloud gives the trend.
RSI gives the green signal to enter.
3. Entry Rules:– Simple and Clear
For Longs:
Price must stay above the EMA Cloud.
RSI should be above 50 to confirm bullish momentum.
Enter on a small pullback into the cloud or after a breakout candle closes above it.
For Shorts:
Price must stay below the EMA Cloud.
RSI should be below 50 for bearish confirmation.
Enter on a pullback toward the cloud or a breakdown candle.
This combination prevents you from buying too early or selling too late.
4. Exit Strategy:– Keep It Clean
Exit when price closes inside the EMA Cloud against your direction.
Aggressive traders can exit when RSI crosses back below 50 (for longs) or above 50 (for shorts).
Always trail your stop loss below the cloud to lock in gains.
The cloud helps you ride the trend longer with less stress.
5. Why This Strategy Works So Well
EMA Cloud filters the market trend.
RSI filters the momentum.
Together, they eliminate 70% of noise and give you only the smoothest trend trades.
It’s simple, visual, and beginner-friendly, yet powerful enough for advanced traders.
Rahul’s Tip:
Don’t rush entries just because the market is moving fast.
Wait for cloud direction + RSI confirmation, this patience alone can double your accuracy.
Conclusion:
The EMA Cloud + RSI Confirmation Strategy is a clean, reliable way to follow trends without second-guessing.
It removes emotional entries, filters noise, and gives you structured trade opportunities.
Use it consistently, and you’ll notice how much clearer your charts feel, and how much calmer your decision-making becomes.
If this post helped you understand a simple yet effective trend strategy, like it, comment your thoughts, and follow for more practical trading setups!
XAUUSD – Brian | Volume Profile & TrendlineXAUUSD – Brian | Volume Profile & Trendline: prioritize Sell, wait for a “good deal” in the liquidity zone
1. Market snapshot
On H1, gold is touching the trendline just as yesterday's scenario – this is an area where strong price reactions may occur.
The current structure shows that the price is gradually distributing below the trendline, with no clear signal that buyers have regained control.
In the short term, Brian prioritizes the Sell scenario, utilizing the POC – VAH – FVG areas of the Volume Profile to find entry points.
2. Volume Profile – Key price areas to note
Short-term POC/VAH area around 3,488–3,492 (according to his chart):
This is an area where dense trading occurred, the profile “bulges” out, indicating strong market interest.
When the price returns to this area, a reaction is expected – suitable for entering orders in the current priority direction.
Sell-side liquidity below: If gold cannot hold the POC/VAH area and is pushed down, the liquidity area below will become a reasonable target for the next downward move.
Gold is likely to fluctuate sideways on Friday to close the weekly candle below the trendline, then consider a clearer break at the start of next week.
3. Trading scenario for next week
Scenario 1 – Prioritize Sell at the Volume Profile area
Main mindset: When the price returns to the POC/VAH areas above, prioritize finding short signals instead of chasing buys.
Watch for clear candle reactions (long upper tail, pin bar, engulfing…) at the thick profile area.
Target: Gradually close towards lower liquidity areas (sell-side liquidity) below.
Depending on price behavior, the target can be expanded if selling pressure intensifies at the start of the week.
Scenario 2 – Break trendline & buy the retracement
If gold decisively breaks the downtrend line, closes above, and maintains the new structure:
Then, the strategy will shift to buying the retracement at the trendline itself (now acting as support).
The POC/VAL area below will then become a reasonable “buy zone” to follow the new upward trend.
In summary: before a clear break occurs, Brian still prioritizes selling at high liquidity areas, rather than rushing to catch the bottom.
4. Fundamental context – Large capital still supports gold
Central banks are increasing gold purchases:
In October, global central banks net purchased +53 tons of gold, the highest level since 11/2022.
This figure increased by +194% compared to July, marking the third consecutive month of increased purchasing speed.
This indicates: Short-term selling pressure may appear around the trendline/resistance, but long-term capital flow still favors gold.
Any deep declines later may still attract buying power from large institutions.
5. Risk management suggestions
Maintain the mindset: Sell is the current priority scenario, not the only option – if the structure changes, be ready to switch to buy.
Do not overlook the nearest liquidity/swing low area to place SL – avoid dragging SL too far due to emotions.

XAUUSD –| watch reaction at POC – VAL – VAH according to VolumeXAUUSD – Brian | watch reaction at POC – VAL – VAH according to Volume Profile
1. Market snapshot
Gold is entering a redistribution phase in the high price range, with fluctuations mainly revolving around large volume clusters on the Volume Profile. In this context, Brian's current priority scenario is to watch for a Sell when the price approaches the POC / VAL / VAH areas – where the market previously traded heavily.
2. Volume Profile – Notable price areas
POC – VAH area 4.217 is the price area where buyers/sellers previously "struggled" strongly, suitable for looking for sell signals if there is a rejection reaction.
VAL & the support area below around 4.134 is where short-term buying force may appear, suitable for a technical rebound buy scenario.
3. Trading plan (this week)
Scenario 1 – Sell according to Volume Profile (priority)
Sell: 4.217
SL: 4.125
TP: 4.200 – 4.182 – 4.150
Idea: wait for the price to rebound to the POC/VAH area around 4.217, observe the H1/M30 candle reaction. If a clear rejection signal appears (long upper tail, reversal candle...), the sell order can be activated according to the plan.
Scenario 2 – Short buy at VAL/support area
Buy: 4.134
SL: 4.125
TP: 4.155 – 4.180 – 4.200
Idea: if the price adjusts deeply near the VAL area and holds above 4.125, a technical rebound may occur. This is a short buy, not going too far against the trend, prioritizing partial profit-taking when the price returns to the upper POC area.
4. News to watch – Unemployment Claims
Today there are US Unemployment Claims figures, which are quite sensitive data for gold because:
The market will assess the strength/weakness of the US labor market.
Worse-than-expected figures → increase the likelihood of Fed easing → positive for gold.
Better-than-expected figures → support USD, may cause gold to face adjustment pressure.
Therefore, it is advisable to limit new orders close to the news release time, wait for the post-news candle to stabilize, and then reassess the structure.
5. Risk management (user-friendly for phone users)
Sell is the priority scenario but do not overlook SL 4.125, to avoid the case of a strong breakout above the current volume cluster.
With the Buy 4.134 scenario, it is advisable to split TP, move SL to breakeven when the price hits TP1 to reduce the pressure of having to "watch the chart" continuously on the phone.
If D1/H4 closes below the 4.125 area with large volume, Brian will consider it a signal to reduce short-term buying expectations and wait for a clearer new structure.
