US10Y
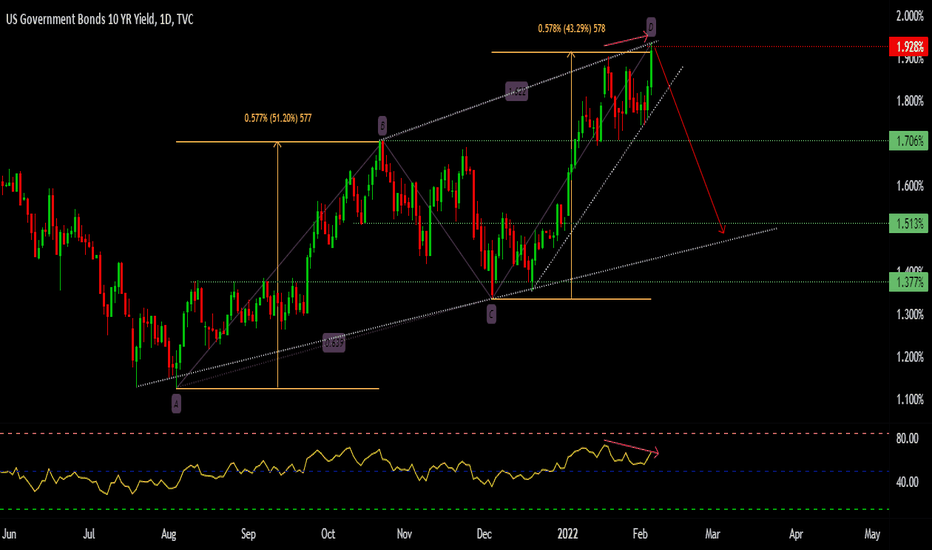
Bear Flag materializing in US 1O Year Yield (US10Y)US 10 Year yield suggests markets are moving towards risk off environment.
The fundamental causes for yields to fall are complex and difficult to disentangle - geopolitics, macro reasons, uncertainty, inflation risk, recession risk etc.
This will further put pressure on Stock Markets (equities).
The current trend looks bearish for US10Y.
Trade Safe
A Stock market crash can trigger a recessionSteepening cycles in the US yield curve have preceded stock market crashes in the past, and so far, this time is no different. As measured by the difference between the 10-year bond yield and the 2-year bond yield, the yield curve is now rising and made a higher high last night. The continued trend is toward a risk-off by investors out of equities into the safety of two-year or shorter-term bonds. Such stock market sell-offs have also resulted in a recession in the past so one follows the next.
US10Yrs. Bond Yield parallel channel. Nifty up move confirmationUS Government 10Yrs. Bond Yield trading in parallel channel. After fake break out it come down in channel again. As per chart it may correct up to 4%,3.79% and 3.06% level soon.
It has inverse relation with index, so nifty and bank nifty may give good up move in next 2-3 months as both charts suggested also the same.
Liz Truss, Rishi Sunak, Starmer - Lessons for India from UKIndian Budget will be presented in Jul 2024. This will be a coalition government budget, hence there is a chance of the government going populist and yielding to coalition partners demands. Indian government has done a fabulous job in the last decade of maintaining the public finances in a strong position.
This video tries to highlight where we stand due to our correct economic policies of the last decade - including a once in a century pandemic - against the global backdrop
US10Ythe fall started from 15% in Oct' 1981 until 0.533% in Jul 2020 has formed a parallel channel.
Though the rise has been sharp and with very little consolidation.
However it may start consolidating from 6-8%
retracement from that may not be much, however time correction is needed as bond yield has increase too much in little time.
End of rate hike cycleUS fed rare hike cycle is near about to end in next 6-9 months or it has already reached to the peak. Reversal in inversion from above 0% level had given signals of stoppages of rate hike cycle in last 3 incidents. 1-2 more hike may come but that's end of upmove in interest rate. Time to lock 10 year bond yield.
Disc : It's not an investment advise to buy or sell
Will bond spike again ?Bond yield looks to have bottomed out at 1.12. Daily close abv 1.38 will start bullish HHHL structure. In such scenario , price may adance to 2.02 (minimum) on conservative slope and 2.34 - 2.60 on steep slope.
Minimum deadline as of now is 22nd Jan but if it attempts for 2.60 then deadline could extend to May 2022.
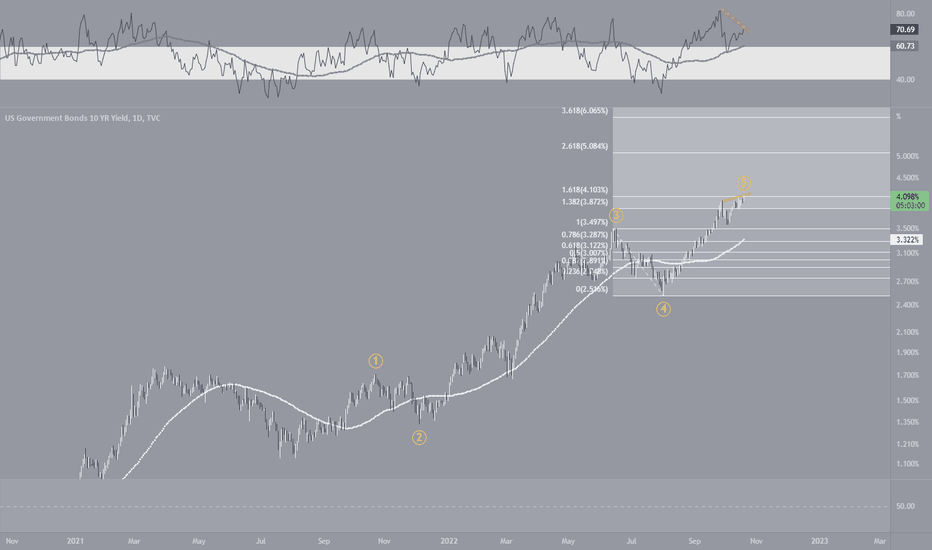
US10Y - Looks like a high is completedUS10Y could be in at its peak in current wave cycle to stary a ABC correction.
RSI on daily is also showing divergence indicating topping out sign. The correction in US10 will be good for equities.
View will be invalid if the high 4.123 is broken and wave 5 might get extended.
User discretion!
Head & Shoulder formation in #bankniftyAs can be seen, Head and shoulders formed on Daily chart of Banknifty. Neckline comes around 37500/450 levels. Total height of formation is 4275 points. Will be break or will give a false breakout. Only time will tell.
With bullish formation on US10y yield, quote possible it can break!!!
Please share your views too.
Happy trading
Rounding bottom (Cup & Handle) formation breakout?? #US10YCharts show breakout of rounding bottom formation on Weekly/Monthly charts of US 10year yields. Already got monthly closing above the breakout line.
If sustains above the breakout line minimum target for 10y yield will be around 5.5/6.5 pc. If so, there will bloodbath across all asset classes. Only below 3.4/3.3 negates the idea.
Brace! Brace! Brace! If true, difficult times ahead.
Hope I'm wrong.
Happy trading
US10Y aheading to cross 2% this timeUS10Y has been trending in a downward channel, currently aheading towards its resistance. It acts as a leading indicator to US equity indexes and works in contrast to major benchmarks.
Disclaimer: View for Educational purpose only, not to be taken as trading/investment advice.
US10Y scaring the markets again?I do not have the detailed economic understanding of this matter but have observed that a rise in the US 10 year treasury yields leads to a overall feeling of fear and turmoil in the markets. Back in the March and April of 2021, US10Y was continuously making news as it was reaching levels of about 1.75, with commentators discussing how a test of the levels of 2 and beyond could lead to a sharp sell off in the markets. But, it failed to move past decisively beyond the 1.75 levels as market on the chart.
_____________________________________________________________________________________________________________________________________________________
Since then I have been following this ticker, US10Y corrected back to levels of around 1.12 which it failed to break below in July and August. After that it had started forming higher lows leading to bullish structure. It was consolidating just below 1.38 trying to break through it, which it finally did on the 23rd of September.
_____________________________________________________________________________________________________________________________________________________
In short, if this trend continues upward leading the US10Y to the April highs of 1.75 and beyond, we could observe the markets struggling to move ahead, also possibly correcting. It would be prudent to keep watch.
Manage risks properly and trade your plan.
Like and follow for more. :)
US10YAt their policy meeting in December, FOMC participants agreed to double down on QE pace to close the same by Mar’22 amid growing concerns about hotter inflation. Fed officials also began discussing at the December meeting about balance sheet (bond holdings), and some policymakers are pushing to start shrinking them sooner and faster than they did after an earlier asset-purchase (QE) program after 2007-08 GFC. Markets would see that as a form of tightening monetary policy because it would signal the central bank’s desire to deliberately slow the economy.
Once the Fed stops buying bonds/assets (after QE tapering), it could keep the holdings steady by reinvesting the proceeds of maturing securities into new ones, which should have an economically neutral effect. Alternatively, the Fed could allow its holdings to shrink by allowing bonds to mature, or runoff (QT-Quantitative Tightening).
Good News for Bulls In the Market- H&S pattern in US 10 YR BondsHey Guys, Fingers crossed!! I Hope this Right shoulder gets complete on monday and again Bonds may get to hell. Reversal in bonds may happen from now on if this pattern gets rightfully completed. So, Monday is a very crucial day to decide what the stock market will be going to perform in the coming week and month.
Hope you all would have liked the analysis. Also see my recent analysis on Axis Bank and Berger paint as well.
Do follow me on trandingview for more analysis like this.


