Advance Option Trading vs. Master Institutional Trading🎯 What is Advance Option Trading?
Advance Option Trading means using complex option strategies to manage risk, take advantage of volatility, or make consistent income from the market.
You’re not just buying a Call or a Put here. You’re using combinations of options like:
Spreads (Bull Spread, Bear Spread)
Iron Condors
Butterflies
Ratio Spreads
Calendar Spreads
You're also learning to understand and control variables like:
Delta (directional movement)
Theta (time decay)
Vega (impact of volatility)
Gamma (rate of Delta change)
In short, it’s like playing chess with the market using tools that have defined risk and reward. You can win even if the market moves sideways or only slightly moves in your direction.
🧠 What is Master Institutional Trading?
Master Institutional Trading is about thinking and trading like big institutions – the banks, hedge funds, and FIIs (Foreign Institutional Investors). These players don’t trade like retail traders.
They control large volumes, manage millions or billions in capital, and have the ability to move markets. But here's the secret: they don’t chase price… they create price movement.
In this trading style, your focus is on:
Volume Profile
Order Blocks
Liquidity Zones
Market Structure
Smart Money Concepts (SMC)
Wyckoff Theory
You're not predicting price – you're following the footprints of big money. You’re trying to enter when institutions are entering, and avoid traps they set for retail traders.
🔄 Core Difference at a Glance
Feature Advance Option Trading Master Institutional Trading
Asset Used Options (CE/PE) Stocks, Futures, Options
Main Tool Option Greeks, Option Chain Volume Profile, Order Flow
Style Strategy-based Flow-based
Mindset Structured, mathematical Contextual, dynamic
Learning Curve High (requires math + logic) High (requires market psychology + vol read)
🧰 Tools Used
Tool Option Trading Institutional Trading
Option Chain ✅ ❌
Greeks (Delta, Theta, Vega) ✅ ❌
Volume Profile ❌ ✅
Market Structure (HH/LL) ❌ ✅
Implied Volatility (IV) ✅ ❌
Order Flow/Tape ❌ ✅
Liquidity Zones ❌ ✅
Expiry Analysis ✅ Sometimes
VWAP & POC Optional Core tool
🎯 Goals of Each Trader
🧪 Advance Option Trader:
Earn from time decay (Theta)
Use spreads to protect capital
Trade with defined risk
Take advantage of volatility crush
Scalp on expiry days using option premiums
🎯 Institutional Trader:
Trade in alignment with Smart Money
Ride major directional moves
Avoid retail traps
Use volume as a leading indicator
Trade price action with deeper logic
💥 Example in NIFTY
Let’s say NIFTY is at 22000.
✅ Option Trader's View:
Market is range-bound
Build an Iron Condor:
Sell 21800 PE, Buy 21700 PE
Sell 22200 CE, Buy 22300 CE
Max profit if NIFTY stays in range for next 3 days
✅ Institutional Trader's View:
Market faked a breakout above 22100
Big volume appeared at top, then reversed
Enters short after liquidity sweep
Targets zone near 21850, which is a demand block
🤔 Which One Should You Learn?
Your Profile Go for Option Trading Go for Institutional Trading
You like rules, logic, math ✅ ❌
You enjoy price-action & market behavior ❌ ✅
Want passive income from theta decay ✅ ❌
Want to scalp or swing big moves ❌ ✅
Prefer fixed risk/reward trades ✅ ❌
Want to track where big money trades ❌ ✅
You hate fake breakouts ❌ ✅
🧩 Can You Combine Both?
Absolutely!
In fact, many successful traders today use Institutional Trading concepts (like SMC or Volume Profile) to identify zones and then execute trades using option strategies.
Example:
Use institutional zone to identify support/resistance
Then sell options near those zones
Or place a directional option spread trade
This is called "confluence trading" – where different systems come together to build a stronger edge.
⚠️ Common Mistakes
🚫 In Option Trading:
Ignoring Greeks
Blindly buying options without IV analysis
Trading low volume strikes
Not adjusting positions
🚫 In Institutional Trading:
Overusing Smart Money concepts without confirmation
Misreading fakeouts as real breakouts
Trading against volume
Being impatient and entering early
✅ Final Summary
🔹 Advance Option Trading
You’re a strategy player
Mastering time decay, volatility, and spreads
Goal: Defined profit, controlled loss, consistent income
🔹 Master Institutional Trading
You’re a market observer
Mastering order flow, liquidity, and manipulation
Goal: Ride big moves, avoid traps, think like smart money
Wave Analysis
Cryptocurrency Day Trading🧠 What is Cryptocurrency Day Trading?
Day trading means buying and selling crypto coins within the same day — sometimes within minutes or hours — to profit from small price movements.
You don’t hold positions overnight. The goal is to enter and exit quickly, catch a few percent in price movement, and repeat.
Examples of popular cryptos for day trading:
Bitcoin (BTC)
Ethereum (ETH)
Solana (SOL)
Ripple (XRP)
Pepe, Shiba Inu (Meme Coins)
New trending tokens (like AI or gaming-based tokens)
These coins can move 5% to 50% or more in a single day — that’s what makes day trading so attractive!
📊 Why People Love Crypto Day Trading
24/7 Market Access
Unlike stock markets, crypto never sleeps.
You can trade anytime, even late at night.
Volatility = Profit Potential
Crypto prices move wildly.
More movement = more chances to make money.
Low Barrier to Entry
You can start with $10 or $100.
No big capital or licenses required.
Leverage Options
Platforms like Binance, Bybit, and KuCoin offer leverage (e.g., 5x, 10x, 50x).
This can amplify profits (but also increase risk!).
Fast Results
Unlike long-term investing, day trading gives instant feedback.
You know within hours if you’re winning or losing.
⚙️ How Crypto Day Trading Works (Simple Explanation)
Let’s say you’re watching SOLANA (SOL) today.
Price is moving between $75 and $80.
You notice a pattern: Every time it touches $75, it bounces back up.
So you buy at $75, wait for a small move to $77, and sell.
You just made a 2.6% gain.
Now imagine doing that multiple times in a day, or with larger capital. That’s the basic idea.
🎯 Key Strategies Used in Day Trading
Let’s explore the most common (and effective) strategies in simple language:
1. Scalping
Fastest form of trading.
Holding a coin for seconds to a few minutes.
Goal: Catch tiny moves — 0.5% to 1% — many times a day.
🛠️ Tools: 1-minute or 5-minute chart, high volume coins, tight spreads.
2. Breakout Trading
Price builds up like pressure, then breaks out of a level.
Traders watch for resistance breakout or support breakdown.
After breakout, price usually moves quickly — giving fast trades.
🧠 Tip: Watch key levels and volume spike during breakout.
3. Range Trading (Buy Low, Sell High)
When price stays inside a box or zone.
Traders buy at the bottom of the range and sell at the top.
Simple but powerful when done right.
📌 Use on sideways markets. Works great with RSI (Relative Strength Index).
4. News-Based Trading
Crypto reacts quickly to news (good or bad).
For example: If Bitcoin ETF gets approved → Price jumps.
Traders jump in right after big news and ride the wave.
⚠️ Be careful — fake news can also move markets quickly.
🛠️ Must-Have Tools for Day Trading Crypto
TradingView – Best for charts and indicators.
Binance / Bybit / KuCoin – Major exchanges with good liquidity.
CoinMarketCap / CoinGecko – Track coins, market caps, news.
Twitter / Telegram / Discord – Stay updated on trending tokens.
Stop Loss & Take Profit Tools – Crucial for risk control.
📉 Risk Management – The Life Jacket of a Day Trader
Here’s the truth: Without good risk management, you will lose money — even if your strategy is good.
Here are golden rules:
✅ Never risk more than 1-2% per trade
✅ Always use a stop loss
✅ Don’t chase the market
✅ Don’t trade with emotions
✅ Keep a trading journal
Example: If you have $1000, don’t risk more than $20 on one trade.
😰 Common Mistakes (And How to Avoid Them)
❌ Overtrading
Trying to take too many trades in one day. Your brain burns out.
👉 Take only high-quality setups. Less is more.
❌ No Plan
Trading based on “gut feeling” is gambling.
👉 Always have an entry, stop loss, and target.
❌ Revenge Trading
You lost money — now you're trying to “win it back” emotionally.
👉 Take a break. Come back with a clear head.
❌ Ignoring Risk
Using 20x leverage on meme coins without a stop loss is financial suicide.
👉 Respect the risk or the market will humble you.
🤖 Can You Use Bots or AI?
Yes, many day traders use trading bots or AI assistants to:
Scan for signals
Enter/exit trades automatically
Apply indicators faster
But remember: Bots don’t guarantee profit. You still need logic and supervision.
🧘♂️ Mindset of a Successful Day Trader
The best traders treat trading like a business, not a game.
They are:
Disciplined
Patient
Data-driven
Emotionally stable
Focused on long-term performance, not just daily wins
They don’t chase hype — they follow the process.
💼 Can You Make a Living from Crypto Day Trading?
Yes, but not easily. It takes:
Skill
Discipline
Capital
Experience
Most beginners lose money in the first 3–6 months. That’s normal. But with proper learning, journaling, and strategy, it is possible to be consistently profitable.
📌 Final Thoughts: Is It for You?
Crypto day trading is exciting, fast-paced, and potentially very profitable — but also risky and demanding.
Pros:
High income potential
No 9–5 job
Remote, flexible lifestyle
Cons:
High risk
Mentally exhausting
Emotionally draining
Steep learning curve
If you love analyzing charts, making quick decisions, and have emotional control — this might be for you.
But if you’re not ready for the pressure, consider swing trading or investing instead.
✅ Bonus Tip:
Start with paper trading (demo mode) or trade small amounts before risking big money. Focus on mastering one strategy first before learning ten things at once.

Trading Master Class With Experts🔰 Introduction
In today’s fast-moving financial markets, trading has evolved from basic buying and selling to data-driven strategies, advanced analysis, and systematic execution. A Trading Master Class With Experts is not just another course—it’s a comprehensive mentorship program that bridges the gap between beginner-level knowledge and professional-level performance.
This class is designed for those who are serious about trading as a skill, business, or career, and who want to learn directly from experienced traders, analysts, and market strategists. The program focuses on real-time learning, practical strategies, market psychology, and risk management, giving participants the tools to trade confidently and consistently.
🎯 Objective of the Master Class
The primary goal of the Trading Master Class With Experts is to transform retail traders into independent, strategy-based professionals. It’s structured to help you:
Understand how markets really work
Learn proven strategies from professional traders
Avoid common beginner mistakes
Build and test your own trading system
Develop the mindset and discipline of institutional-level traders
🧠 What You Will Learn
This master class covers a holistic approach to trading with a strong focus on practical execution, including:
🔍 1. Market Basics & Trader Foundation
How stock markets work
Key players: Retail vs Institutions
Types of markets: Bullish, Bearish, Sideways
Trading styles: Intraday, Swing, Positional, Scalping
Asset types: Equity, Derivatives, Forex, Crypto, Commodities
🕯️ 2. Technical Analysis
Reading and analyzing candlestick patterns
Support and Resistance theory
Trend identification and trendline accuracy
Price Action-based entry and exit techniques
Volume analysis and institutional behavior spotting
📊 3. Indicators and Tools
Moving Averages (SMA, EMA)
RSI, MACD, Bollinger Bands, Supertrend
Fibonacci retracement and projection
Volume Profile and VWAP
How to avoid indicator overloading
🧱 4. Chart Patterns & Setups
Reversal patterns: Double Top/Bottom, Head and Shoulders
Continuation patterns: Flags, Pennants, Triangles
Breakout trading vs Pullback trading
Building entry/exit rules with confirmation signals
🧮 5. Options and Futures Trading (Optional Module)
Understanding Calls and Puts
Option chain analysis and Open Interest
Option Greeks (Delta, Theta, Vega, Gamma)
Directional vs Non-directional option strategies
Institutional Option Trading Techniques
💹 6. Risk Management
Capital allocation methods
Risk-to-reward ratio and win-rate planning
Stop-loss and trailing stop methods
Diversification and exposure control
Avoiding overtrading and emotional decisions
🧘 7. Trading Psychology & Discipline
How to handle losses without fear
Dealing with greed and overconfidence
Mindset of a consistent trader
Journaling, post-trade analysis, and routine building
💻 8. Live Trading & Practical Learning
Real-time market sessions with expert commentary
Watching experts plan, execute, and review trades
Hands-on assignments and trade simulations
Market opening/closing routines
Building your personal trading plan
🔧 Advanced Topics (for Experienced Traders)
Institutional Trading Strategies
Smart Money Concepts
Volume Spread Analysis (VSA)
Multi-leg Option Strategies
Algo-trading basics (optional)
Trading Journals and performance analysis tools
👨🏫 Who Are the Experts?
This master class is conducted by a team of seasoned professionals:
Full-time traders with 10+ years of market experience
Certified technical analysts and SEBI-registered mentors
Option strategists and quantitative traders
Risk managers and trading psychologists
They provide you with:
Live mentorship
Real trade breakdowns
Direct Q&A sessions
Feedback on your trading plans
👥 Who Should Join This Master Class?
This program is ideal for:
Aspiring traders who want to start with clarity
Traders stuck at breakeven or in losses
Professionals looking to become part-time traders
Students or working individuals with serious interest in trading
Anyone who wants to trade like an institution, not a gambler
📜 Certification & Support
Upon completion, you will receive:
A certificate of participation
Access to recorded sessions
A trading toolkit: Checklists, planners, and journals
Lifetime access to community/mentorship group
🧭 Final Words
A Trading Master Class With Experts is not about shortcuts or tips. It’s a structured pathway to build you into a professional-level trader who understands risk, follows a system, and survives long-term.
Markets will always test you—but this master class gives you the skills, mindset, and mentorship to pass every test with confidence.

Technical ClassA Technical Class for Trading is a structured learning program that helps aspiring traders understand how to analyze financial markets using technical analysis. Unlike guessing market movements or relying on news, technical analysis is a science of price behavior, built on charts, patterns, indicators, and market psychology. This class is essential for anyone who wants to become a self-reliant trader in stocks, options, futures, forex, or crypto.
✅ What You Learn in a Technical Trading Class
A good technical trading class teaches how to analyze price action, spot trading opportunities, and apply disciplined risk management. Here’s what’s typically covered:
📈 1. Introduction to Technical Analysis
What is Technical Analysis?
Difference between Technical and Fundamental Analysis
Importance of studying price action and volume
Types of traders: Day Trader, Swing Trader, Positional Trader, Scalper
🕯️ 2. Candlestick Chart Reading
Candlestick charts tell stories of price movement and trader psychology.
You'll learn:
Structure of a candlestick (open, high, low, close)
Key single candlestick patterns (Hammer, Doji, Marubozu)
Dual & triple patterns (Engulfing, Morning Star, Evening Star)
How to use candles to detect reversals or continuations
📊 3. Chart Types and Timeframes
Line chart vs Bar chart vs Candlestick chart
Timeframe selection for different trading styles:
Intraday (5 min, 15 min)
Swing (1 hour, 4 hour)
Positional (Daily, Weekly)
📌 4. Support and Resistance
What are support and resistance levels?
How to identify major levels using price action
Role of psychological round numbers
Breakouts and false breakouts
How to use them for entry, exit, and stop-loss
📉 5. Trend Analysis
Understanding the direction of the market is critical.
You will learn:
How to spot uptrends, downtrends, and sideways markets
How to draw trendlines correctly
Using price structure: Higher Highs / Higher Lows
Tools like Moving Averages to confirm trends
📐 6. Chart Patterns
Chart patterns help forecast future moves.
Key patterns covered:
Reversal Patterns: Head & Shoulders, Double Top/Bottom
Continuation Patterns: Flags, Pennants, Triangles
Breakout strategies and volume confirmation
⚙️ 7. Technical Indicators
Indicators help confirm entries and manage trades.
Most-used indicators:
Moving Averages (SMA/EMA)
Relative Strength Index (RSI)
MACD (Moving Average Convergence Divergence)
Bollinger Bands
Volume analysis
How to combine indicators for smarter entries
⏳ 8. Time, Volume & Volatility
Importance of volume spikes
Volatility analysis for risk management
Understanding market sessions and timing your trades
🎯 9. Risk Management
This is where most traders fail. A technical class teaches:
How much to risk per trade (1–2%)
Risk-to-reward ratios
Where to place a stop-loss
How to avoid revenge trading
Capital preservation first, profit later
🧠 10. Trading Psychology
Handling emotions: Greed, Fear, Impatience
Importance of discipline and patience
Building confidence through planning
Developing a trading journal and sticking to rules
⚡ 11. Practical Strategy Building
The real power of a technical class lies in combining all the knowledge to build strategies:
Trend-following strategy
Reversal setups
Breakout/breakdown trades
Momentum-based trades
Intraday vs swing setups
📚 Benefits of Joining a Technical Class
Learn systematic trading instead of gambling
Avoid common beginner mistakes
Practice through live market examples
Prepare to move toward professional-level trading
Save time by learning from expert mentors
🔎 Who Should Take a Technical Class?
Aspiring full-time or part-time traders
Stock market beginners
Intraday traders, swing traders, or positional investors
Option traders who want to improve timing
Anyone who wants clarity and structure in their trading
📌 Final Thoughts
A Technical Class for Trading is not just about indicators and charts. It’s about learning a structured, rule-based approach to understanding the market. It empowers you to make trading decisions confidently and helps you grow from a beginner to a skilled, strategy-driven trader.
Whether you’re trading stocks, Bank Nifty, Nifty50, or even crypto — technical analysis is your foundation. Learn it well, practice with discipline, and your chances of success in the markets will dramatically improve.

Institution Option TradingWhy Do Institutions Use Options?
Hedging Large Portfolios:
Institutional investors often manage portfolios worth billions. They use options to hedge against unexpected market movements.
✅ Example: A mutual fund holding a large amount of Nifty 50 stocks might buy put options on Nifty as insurance against market crashes.
Generating Income (Option Selling):
Institutions often sell options to earn consistent income (like premiums). They use strategies like covered calls or cash-secured puts to generate returns even in sideways markets.
Capital Efficiency:
Options provide leverage, meaning institutions can control large positions with relatively less capital. This helps them manage cash flow better.
Volatility Arbitrage:
Institutions track and exploit differences in Implied Volatility (IV) vs. Realized Volatility (RV). When the IV is overpriced, they may sell options; when it’s underpriced, they may buy.
Algorithmic and Quant-Based Trading:
Many institutions rely on algorithms and quantitative models that execute thousands of options trades based on volatility, delta exposure, or arbitrage opportunities.
Tools and Techniques Used by Institutions
🔹 1. Option Greeks Mastery
Institutional traders constantly analyze Delta, Gamma, Theta, Vega, and Rho to build and adjust complex positions:
Delta-neutral strategies are used to stay market-neutral.
Theta-positive positions (time decay advantage) are used for income.
Vega-sensitive positions help trade volatility instead of direction.
🔹 2. Open Interest and Volume Tracking
Institutions monitor Open Interest (OI) and volume build-up to identify where other big players are active. A sudden rise in OI on certain strikes may indicate accumulation or unwinding by institutions.
🔹 3. Option Chain Data + Order Flow Analysis
Institutions use Option Chain Analysis with depth data (buy/sell orders) to track smart money movement. Tools like Delta Hedging ratio calculators and OI heatmaps help them find critical levels.
🔹 4. Institutional Spread Strategies
They execute multi-leg strategies like:
Calendar spreads
Diagonal spreads
Ratio spreads
Iron Condors
Iron Butterflies
These are designed to control risk and reward precisely, often with market neutrality.
Examples of Institutional Option Strategies
✅ Covered Call Strategy:
Used by asset managers to generate extra returns on stocks they hold. They sell out-of-the-money calls on the stock positions.
✅ Protective Put Strategy:
A long-term investor may buy put options to protect their holdings against short-term downside risks (especially around earnings or global events).
✅ Straddle or Strangle Before Events:
Institutions sometimes buy or sell straddles/strangles before major events like:
Budget announcements
Central bank meetings
Election results
These help them play or hedge volatility without picking a direction.
Institutional Footprint: How to Spot It
As a retail trader, you can follow institutional activity by:
Watching sudden spikes in OI with price movement.
Observing IV movements before major events.
Looking at the Put/Call Ratio (PCR) and Max Pain points.
Analyzing volume build-up in deep ITM/OTM strikes.
Important: Institutions Are Often Option Sellers
Most institutions are option sellers because:
They have enough capital to absorb risk.
They manage trades professionally.
They benefit from time decay.
They hedge and adjust positions dynamically.
This is why most option premiums decay, and retail buyers often lose unless timed perfectly.
Conclusion
Institutional Option Trading is all about control, precision, and risk management. Institutions don’t look for jackpot trades. They build portfolios, hedge positions, generate consistent income, and use complex strategies that are rarely visible to retail eyes.
For retail traders aiming to "Trade Like Institutions", the path is:
Learn the Greeks deeply.
Understand volatility behavior.
Build strategies with proper risk-to-reward ratios.
Use data, not emotions.
Don’t chase profits—focus on consistency.
You can’t match institutions in capital, but you can definitely match them in discipline, knowledge, and system-based trading.

Institutional Objectives in Options Trading🎯 1. Hedging Large Portfolios
One of the primary institutional goals is to protect investments from unfavorable market movements. Since institutions hold large quantities of stocks, they face massive risk if the market turns against them.
✅ Example:
A mutual fund holding ₹100 crore worth of Nifty 50 stocks might buy Put Options on Nifty to protect against a market crash.
This acts like insurance — a small premium is paid to avoid a huge loss.
🔹 This is called a protective put strategy.
📈 2. Generating Additional Income
Institutions also use options to generate consistent income. Since they often hold large amounts of shares, they can write (sell) options against these positions.
✅ Example:
Selling Covered Calls against stock holdings generates premium income, especially when expecting the market to remain sideways.
Writing Cash-Secured Puts allows them to earn premium while preparing to buy a stock at a lower price.
🔹 This enhances portfolio returns without needing to sell the core holdings.
📉 3. Managing Volatility Exposure
Volatility is a double-edged sword. Institutions analyze and trade implied volatility (IV) rather than just direction. They adjust their portfolios using options to profit from volatility changes or to reduce risk when volatility spikes.
✅ Common practices:
Use straddles and strangles before major events like earnings or elections.
Buy options when IV is low (expecting a spike) and sell options when IV is high (expecting it to drop).
🔹 This is called volatility arbitrage or vega trading.
🔁 4. Portfolio Adjustment and Rebalancing
Institutions use options to rebalance exposure without triggering capital gains taxes or disturbing existing stock positions.
✅ Example:
Instead of selling shares, an institution might:
Buy puts to reduce downside risk.
Sell calls to lock in profits.
Use spreads or collars to control price bands of risk/reward.
🔹 This helps in making tactical moves without liquidating long-term holdings.
💡 5. Directional Bets With Limited Risk
Though not their primary objective, institutions sometimes make directional bets using options for leveraged exposure, with defined risk.
✅ Example:
If a fund expects a strong upside in a stock, it might buy call options instead of the stock itself.
This reduces capital requirement and limits downside to the premium paid.
🔹 This is common in event-driven trading, such as earnings, mergers, or regulatory announcements.
🔄 6. Capital Efficiency
Institutions are under constant pressure to manage capital efficiently. Buying or selling options allows them to control larger positions with less money, keeping more capital available for other trades.
✅ Example:
Instead of buying 1,00,000 shares of a company, they might buy deep ITM call options to replicate stock movement with lower capital.
🔹 This is known as synthetic long exposure.
⚖️ 7. Risk Transfer and Insurance
Options allow institutions to transfer market risk to willing counterparties. They use customized derivatives or listed options to insure specific risks, such as:
Currency risk
Interest rate risk
Commodity price risk
Equity drawdowns
🔹 Large institutions like banks and insurance firms use over-the-counter (OTC) options for complex hedging.
🛠️ 8. Complex Strategy Execution
Institutions often use multi-leg strategies for market-neutral setups or for fine-tuned payoff structures. These include:
Iron Condors
Butterfly Spreads
Calendar/Diagonal Spreads
Box Spreads
Delta-neutral gamma scalping
🔹 These allow fine control over expected profits and losses, based on volatility, time decay, and price movement.

Institutional Trading StrategiesWhat is Institutional Trading?
Institutional trading means the buying and selling of stocks, futures, options, and other financial instruments by large organizations. These organizations are often:
Mutual Funds
Pension Funds
Hedge Funds
Banks and Insurance Companies
Foreign Institutional Investors (FII)
Domestic Institutional Investors (DII)
Unlike retail traders who trade with small amounts of capital, institutional players move huge sums of money, sometimes trading in crores or billions in a single day.
Why Do Institutions Trade Differently?
Institutions have massive capital, so their approach is completely different:
They can’t enter or exit a stock quickly without moving its price.
They focus more on long-term positions or large short-term trades.
They use advanced tools like algorithms, high-frequency trading, and exclusive market data.
In simple words: they trade like whales in the ocean, while retail traders are like small fish.
Core Institutional Trading Strategies Explained
1. Order Flow and Volume Analysis
Institutions often leave their footprint in the market by how much they buy or sell. This is visible through volume spikes and order flow. Retail traders can track this by:
Watching unusual volume on a stock
Monitoring delivery percentage (for cash segment)
Using indicators like VWAP (Volume Weighted Average Price) to see where large trades are happening
Institutions use volume as a key indicator because when big money flows in, prices generally follow.
2. Order Block and Supply-Demand Zones
Institutions don’t buy stocks in one go. They accumulate positions slowly within certain price ranges. These areas are called:
Order Blocks – zones where large buying or selling has happened in the past.
Supply-Demand Zones – areas where the market reacts due to prior institutional activity.
When price comes back to these zones, you will often see a strong bounce (demand) or rejection (supply).
3. Breakout and False Breakout Manipulation
Institutions are masters of manipulation. They often cause:
False Breakouts to trap retail traders.
Breakdown traps to collect positions cheaply.
You will see prices breaking key levels (like support or resistance), triggering retail stop losses, and then reversing sharply. Institutions use liquidity from these retail stop losses to enter or exit positions.
4. Volume Weighted Average Price (VWAP) Strategy
Most institutions benchmark their trades around VWAP.
When prices are above VWAP, the bias is bullish.
When prices are below VWAP, the bias is bearish.
Institutions often buy when price retraces to VWAP after a breakout and sell when it tests VWAP after a breakdown. VWAP acts like a fair value line for many large traders.
5. Liquidity Hunting and Stop Loss Fishing
Institutions need liquidity to place large orders. So they create fake moves:
Push prices higher to make retail buy, then sell into it.
Push prices lower to trigger retail stop-losses and then reverse the price upwards.
This is why retail traders often feel the market is “hitting my stop-loss and then moving in my direction”.
6. Options Data Analysis
Institutions hedge their cash and futures positions using options:
High Open Interest (OI) at certain strike prices indicates important levels.
Sudden OI build-up can show institutional call writing (bearish) or put writing (bullish).
Institutions use Option Selling strategies because time decay (theta) works in their favor.
Retail traders can track option data to understand institutional bias, especially around expiry.
7. Algorithmic Trading (Algo Trading)
Institutions use computers (algos) to execute trades based on pre-defined rules:
Speed: Algos trade in microseconds.
Precision: No emotions, just system-based entries and exits.
Scalability: Handles thousands of orders simultaneously.
You can’t compete with algos on speed, but you can follow the flow by watching patterns like sudden large candles without news or price bouncing off VWAP repeatedly.
8. Fundamental Catalysts Trading
Institutions also trade based on news, earnings, and economic data:
Positive quarterly results → gradual accumulation before the news
Interest rate changes → repositioning in banking stocks
Government policy changes → entering sectors like infrastructure or defense
They often buy early before the public knows and sell after retail traders start entering.
9. Sector Rotation Strategy
Institutions rotate money between sectors:
Moving from IT to Banks
From FMCG to Auto
From Metal to Pharma
Retail traders get stuck chasing one stock, while institutions follow where big sector money is flowing. You can track sector indices (like Nifty Bank, Nifty Auto) to ride these moves.
10. Index Balancing Strategy
In indices like Nifty 50 or Sensex, institutions adjust portfolios based on:
Index addition/removal
Rebalancing due to quarterly reviews
Passive fund flows
Stock prices often jump or fall sharply around these events, giving smart traders easy trading opportunities.
How to Identify Institutional Activity as a Retail Trader
Look for unusual volume spikes
Watch for rejection or breakout around order blocks
Use VWAP as a guidance tool
Track option chain data before key events
Follow sector rotation via index charts
Watch price-action near important news events
Practical Tips for Retail Traders
Trade less, trade better: Institutions don’t chase every small move, neither should you.
Wait for confirmation: Let institutions show their hand through volume before entering.
Avoid emotional trades: The market is designed to make you emotional — don’t fall for it.
Risk management is king: Institutions have risk teams; you must use stop-loss.
Never blindly follow tips: By the time you hear news, institutions are already in or out.
Why Institutional Strategies Work Better
Institutions follow a data-driven approach backed by:
Risk management policies
Trained analysts
Large capital to manage volatility
No emotional trading
Use of technology (Algos)
Retail traders who respect market structure and trade alongside institutions improve their win rate dramatically.
Final Thoughts
Institutional Trading is all about structure, discipline, and patience. It’s not about guessing but about observing market behavior — where are the big players active? Why is volume rising? Where is liquidity flowing?
You don’t need huge capital to benefit from institutional strategies. You simply need to follow the footprints, avoid traps, and focus on high-probability trades.
Reliance, HDFC Bank, PSU Banks Special Focus📌 Why These Stocks Are in the Spotlight
The Indian stock market in 2025 has been witnessing a powerful bull run, and three segments are consistently making headlines:
Reliance Industries – Due to digital, energy, and demerger buzz
HDFC Bank – Despite recent underperformance, it's at a crucial turning point
PSU Banks – The comeback kings, leading the financial sector with strong balance sheets and credit growth
These aren't just stocks—they are pillars of the Indian economy and barometers for sentiment, both for domestic and foreign investors. Let’s dive into each of them in depth.
🛢️ 1. Reliance Industries – The Giant with Multiple Growth Engines
📈 Market Cap & Relevance
Reliance is India’s largest company by market cap. It’s not just a conglomerate—it’s a full-blown economic ecosystem spanning:
Oil & Petrochemicals
Telecom (Jio)
Retail
Digital services (Jio Platforms)
Green Energy
⚙️ Key Drivers in 2025:
🔹 1. Jio Financial Demerger (JFS)
Post-demerger, Reliance has unlocked significant shareholder value.
JFS is slowly becoming a digital finance powerhouse with lending, insurance, and asset management plans.
Investors see JFS as a potential fintech disruptor.
🔹 2. Green Energy & Hydrogen
Ambani’s ₹75,000 crore green push is gaining traction.
New announcements around solar panel manufacturing, battery storage, and hydrogen fuel cells are bullish triggers.
India’s energy transition policies support this narrative.
🔹 3. Retail & E-commerce Expansion
Reliance Retail is aggressively expanding into Tier 2/3 towns.
Synergies with WhatsApp and JioMart are boosting the omni-channel model.
IPO expectations for Retail arm in 2025–2026.
🔹 4. Petrochemicals Recovery
With global crude stabilizing and demand picking up, O2C margins are improving.
This helps Reliance's traditional cash cow business.
💡 Technical View:
Stock recently gave a breakout above ₹3,000.
Strong institutional buying seen.
Analysts setting targets between ₹3,200–3,500 in short-medium term.
🧠 Trader Takeaway:
Ideal for long-term portfolio and sector rotation strategy.
Short-term trades possible on earnings announcements, subsidiary IPO news, or divestments.
🏦 2. HDFC Bank – Sleeping Giant at Turning Point
📉 What Happened?
HDFC Bank, post-merger with HDFC Ltd, became India’s largest private bank by balance sheet size. But ironically, the stock underperformed for much of 2023–2024.
🧾 Reasons for Underperformance:
Confusion and uncertainty post-merger
Weak deposit growth vs. credit growth
Net Interest Margins (NIMs) under pressure
Weak earnings in multiple quarters
But 2025 tells a different story.
📈 Fresh Catalysts for Re-rating:
🔹 1. Integration Settling
The merger is now largely complete from an operational standpoint.
Synergies in housing finance and cross-sell are beginning to show.
🔹 2. Deposit Base Stabilizing
Aggressive branch expansion and new digital products have improved CASA ratio.
Focus is on rural/semi-urban penetration.
🔹 3. Tech & AI Focus
New investment in digital infrastructure, robo-advisory, and AI-based lending systems.
Competing directly with fintechs rather than fearing them.
🔹 4. Valuation Comfort
Price-to-book (P/B) of ~2.1x vs historic avg of 3.2x
Institutions are seeing value accumulation zone
💡 Technical View:
After bottoming around ₹1,350–1,400, strong bounce seen.
Next key resistances: ₹1,700 and ₹1,800.
Many traders are positioning for mean reversion plays.
🧠 Trader Takeaway:
Best suited for positional trades or long-term SIP-style entries
Watch for upcoming quarterly earnings as turning point confirmation
🏛️ 3. PSU Banks – From Forgotten to Frontline
🧭 What’s Driving the PSU Bank Rally?
After years of being ignored due to NPAs, corporate defaults, and government inefficiency stigma, PSU banks are now the stars of the financial sector.
Key reasons behind this dramatic shift:
🔹 1. Asset Quality Improvement
GNPA ratios have fallen to multi-year lows
Most PSU banks are now net NPA below 1%
🔹 2. Credit Growth Resurgence
Double-digit loan growth across retail, MSME, and infrastructure
Focus on digital banking and mobile-first services have helped increase customer base
🔹 3. Government Push
Massive infra push (railways, roads, housing) is fueling credit demand
Capex-linked lending growth is largely happening via PSU banks
🔹 4. Strong Financials
BoB, Canara Bank, Union Bank, and SBI have posted record profits
Net Interest Income (NII) and Operating Profit are at all-time highs
Dividend yields of 4–6% make them attractive to income investors
🔹 5. Re-Rating by FIIs and DIIs
PSU Banks were under-owned; that’s now reversing.
With global macro uncertain, foreign funds are betting on domestic demand-driven banks.
📈 Stocks in Focus:
State Bank of India (SBI): India’s largest lender, breaking out of long-term ranges
Bank of Baroda: Strongest PSU performer in 2024, tech-heavy
Canara Bank & Union Bank: Solid earnings, undervalued
💡 Technical View:
PSU Bank index hitting new all-time highs
BoB, Canara, Union, PNB giving weekly/monthly breakouts
🧠 Trader Takeaway:
Best for momentum trading, swing trades, and F&O strategies
Investors focusing on value + dividend + PSU story
🧠 Final Thoughts
In the 2025 trading and investment landscape, Reliance, HDFC Bank, and PSU Banks offer three distinct opportunities:
Reliance is a structural long-term compounder with growth in multiple verticals.
HDFC Bank is a value + recovery bet, especially appealing to contrarian investors.
PSU Banks are momentum machines backed by real earnings and strong policy tailwinds.
They are each being watched closely by FIIs, DIIs, retail traders, and even global strategists due to India’s growing weight in global indices like MSCI and FTSE.
Option Trading📈 Option Trading – Complete Beginner to Advanced Guide
Option Trading is a powerful method used in stock, forex, commodity, and index markets where you trade contracts (options) instead of buying the actual stock or asset. With options, you get the right, but not the obligation, to buy or sell an asset at a specific price within a specific time. This allows traders to profit in bullish, bearish, and sideways markets — with controlled risk and higher flexibility.
💡 What is Option Trading?
In simple words:
You buy or sell a contract, not the stock itself.
You can control big positions with less money (leverage).
You can make money even if the market goes up, down, or stays sideways.
🎁 Advantages of Option Trading
✅ Small capital, high profits with leverage
✅ Limited risk, especially in buying options
✅ Opportunity to earn in any market direction
✅ Flexible strategies for income, hedging, or speculation
✅ Ideal for short-term trades (1 day to a few weeks)
Simple Example:
You think NIFTY will rise from 20,000 to 20,500 in a week.
You buy a NIFTY Call Option (Strike Price: 20,000).
Pay premium ₹50.
If NIFTY moves to 20,500, your option value increases (maybe ₹200).
Profit = ₹150 per unit (₹200 - ₹50).
With small investment, you earn bigger returns.
✅ Basic Rules for Successful Option Trading
Trade with trend direction (use technical analysis).
Always check Open Interest & Volume.
Avoid holding close to expiry to avoid time decay (theta loss).
Start with single-leg options, move to spreads later.
Risk only 1-2% of your capital per trade.
🎯 Benefits of Mastering Option Trading
✅ Higher returns with lower capital
✅ Master multiple market conditions
✅ Ideal for intraday, swing, and positional trades
✅ Opportunity to hedge existing investments
✅ Fast skill growth in financial markets

Technical Class📊 Technical Class — Complete Guide for Technical Trading
A Technical Class is focused on teaching traders how to analyze price action, chart patterns, indicators, and market behavior using technical analysis. This class is ideal for beginners and intermediate traders who want to understand how to make trading decisions based purely on market charts — without needing insider news or fundamentals.
✅ What is Technical Trading?
Technical trading means you:
Read the charts to find trading opportunities.
Use price history, patterns, and indicators to predict future price moves.
Do not rely on news, instead focus on what the market shows through charts.
Big traders (institutions) also use technical setups, combined with liquidity and order flow, making technical analysis an essential skill.
📚 What You Will Learn in a Technical Class
1. Chart Basics
Candlestick chart vs Line chart vs Bar chart
Timeframes: from 1 minute to monthly
Volume and market sessions
2. Candlestick Patterns
Reversal Patterns: Pin Bar, Engulfing, Morning Star, Evening Star
Continuation Patterns: Inside Bar, Flags, Pennants
Indecision Candles: Doji, Spinning Top
3. Support & Resistance
How to draw key support/resistance levels
Identifying key zones where price reacts
Turning resistance into support (flip zones)
4. Trend Trading Techniques
Recognizing Higher Highs and Higher Lows (uptrend)
Spotting Lower Highs and Lower Lows (downtrend)
Using Trendlines effectively
5. Indicators Used by Pros
Moving Averages (MA) — 50 EMA, 200 EMA for trend
RSI — Overbought/Oversold zones
MACD — Trend and momentum detection
Fibonacci Retracement — Spotting pullback levels
Volume Profile — Finding high-volume zones
6. Chart Patterns
Double Top/Bottom, Head & Shoulders, Triangles
Breakout Strategies — entering after confirmation
Fakeouts and Trap Patterns
7. Risk Management & Psychology
Setting proper Stop Loss (SL) and Take Profit (TP)
Position sizing: how much to risk per trade
Building discipline and patience like a pro trader.
🎯 Benefits of Learning Technical Trading
✅ Trade any market: Forex, Stocks, Crypto, Commodities
✅ Become an independent trader — no reliance on signals
✅ Combine with institutional concepts for Smart Money Trading
✅ Understand why market moves and avoid beginner mistakes
✅ Build a professional mindset with proper risk management
🎓 After Completing Technical Class You Will Be Able To:
Analyze any chart professionally
Trade with higher win-rate setups
Control risk like institutional traders
Identify market traps and avoid fakeouts
Grow your account safely with discipline + strategy.

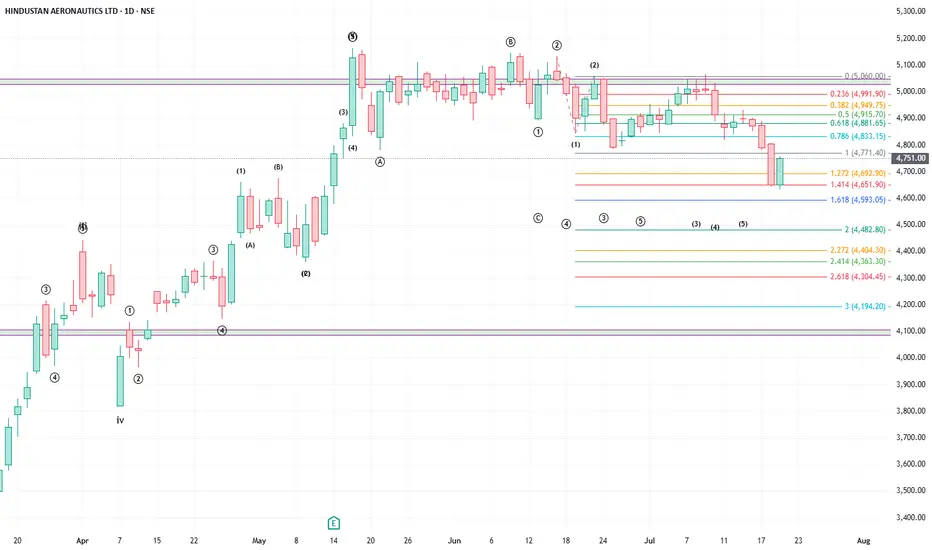
What Is Consolidation? How Can Wave Theory Help You Trade it?
Let’s take HAL as a live example to understand a concept many traders struggle with — "Consolidation".
HAL has been moving sideways ("consolidation") since May 19 and gave a downward breakout on June 24. Yesterday, it formed a strong green candle, which left many traders wondering:
“Is this a buying opportunity or a sell-on-rise setup?”
The conflicting signals during consolidation are exactly what make it confusing. But Elliott Wave Theory can bring clarity.
Wave Perspective: Not Just Sideways — It is a "Flat Correction"
The current price action resembles a Flat corrective structure, one of the three classic Elliott corrective patterns (the others being Zigzag and Triangle). A Flat follows a 3-3-5 structure:
Wave A: Three waves down (corrective)
Wave B: Three waves up (can go above the start of A)
Wave C: Five-wave impulse down — sometimes with an extended wave (i.e. one of the waves shall have 5-sub waves).
Until Wave C fully unfolds, the correction is not complete. Any upside move in between is likely to be a counter-trend wave, not the start of a new trend.
So, What Is Consolidation?
From a wave perspective, consolidation is not random. It’s a structural necessity — the market is completing a complex correction before the next impulsive leg begins.
In strong stocks like HAL, you’ll often see:
A temporary bounce from Fibonacci extension levels which leads to price re-entering Wave 1 territory, which would invalidate an impulse but still fits a corrective structure. A new wave count has to happen again which prolongs the impulse formation. A prolonged sideways to downward move, not because of indecision, but because Wave C hasn’t finished.
How This Helps You Make Better Trading Decisions
The recent green candle may seem bullish, but if it's part of Wave C, it’s just a counter-wave bounce. Elliott Wave structure warns against early entries during such bounces. It suggests a more informed approach: “Sell on rise” until the full correction plays out
Key Takeaway
Consolidation isn’t noise — it’s structure.
When you understand the wave context, you stop guessing and start anticipating.
What’s your view? Are you trading this move or waiting for Wave C to complete? Leave your comments.
New Hedging Opportunity: Gold Futures at IIBX1. What Is IIBX—and Why Are Gold Futures a Game Changer?
India International Bullion Exchange (IIBX), based in GIFT City, Gujarat, launched gold futures trading in July 2025.
This marks the first-ever opportunity for Indian entities to hedge gold price risk onshore but in US dollars with global pricing—bridging domestic participants and international benchmarks.
Unlike traditional futures on MCX, which are rupee-denominated and influenced heavily by Indian domestic factors, IIBX futures track international market dynamics, aligning with real-time global valuations.
Why is this significant?
India is the world’s second-largest consumer of gold—by introducing a dollar-denominated, globally priced futures contract, IIBX allows traders and jewellers to hedge currency and commodity risk simultaneously.
This initiative reduces dependence on foreign exchanges like COMEX or Singapore and supports RBI/IFSCA's goal to develop a robust, transparent bullion trading ecosystem domestically.
2. Who Can Use These Futures—and How Do They Hedge?
Eligible Participants:
Qualified jewellers
Bullion dealers
Refineries
TRQ (Tariff Rate Quota) holders (currently 441+, with more in the pipeline)
Any business entity with gold-related risk exposure
Hedging Scenarios:
Jewellers: Protect import cost from rising gold prices. If they expect gold to cost $2,000/oz in three months, they can lock in prices via futures.
Refiners and Dealers: Manage margin volatility and ensure stable profit spreads regardless of gold price shifts.
TRQ operators: Offset exposure to tariff-based import risks.
Hedging Mechanics:
Buy futures if expecting price increases, offsetting rising import cost.
Sell futures (short positions) to hedge inventory or production, locking in current prices.
Since trades occur in US dollars and settle physically or in cash, participants hedge both commodity and currency risk.
3. Contract Features: What IIBX Has Built-In
📃 Specifications:
Contract unit: 1 kg gold (approx 32.15 oz)
Denomination: U.S. dollars per Troy ounce
Tick size: $0.01 per oz
Minimum trading size: 1 kg; maximum 10 kg per order
Contracts listed: Three consecutive months plus all even-months in a 13-month window (total 8 concurrent maturities)
Trading hours: 09:00–23:30 IST—keeping sync with global gold trading sessions
Risk & Margin Management:
Initial margin: At least 6% of contract value or calculated via Value‑at‑Risk (VaR)
Extreme Loss Margin (ELM): 1% buffer
Daily Mark-to-Market (MTM) settlement
Collateral controls: Members cannot fully exhaust collateral—risk-reduction thresholds are triggered at 85–90%
Concentration & spread margins: Encourage diversification by offering margin benefits for calendar spreads
Settlement:
Daily MTM in USD
Final settlement: Cash or physical delivery, based on pre-declared intent
These features ensure transparency, member protection, and global alignment—while maintaining strong oversight by IIBX and IFSCA.
4. What Makes This Hedging Opportunity Unique Now
💱 Hedge Gold and Currency Simultaneously
Standard MCX contracts hedge gold price risk but not USD/INR fluctuations.
With IIBX’s Dollar-based futures, businesses effectively lock both gold and currency exposures in one contract—critical for imports and exports.
🌍 Real-Time Global Price Alignment
IIBX uses Bloomberg’s XAU–USD spot pricing, so domestic hedges match international market moves.
This synchronisation is ideal for global trading, arbitrage, and better risk pricing.
🏛 Onshore Containerization of Hedging
Previously, Indian entities hedged overseas or bypassed through subsidiaries abroad.
Now, they can do it in GIFT City via Indian AD banks—streamlining compliance, saving on setup costs, and avoiding legal complexities.
🚀 Liquidity Boost via LES
IIBX launched a Liquidity Enhancement Scheme to incentivize market makers through rebates and reduced fees.
This seeds the market with tight spreads, better execution, and deeper order books over time.
5. Practical Use Cases for Gold Futures Hedging
✅ A. Jeweller Importer's Playbook
Estimate gold import date/volume
Sell equivalent IIBX futures at current prices
On expiry or near import — either physically take delivery or unwind position
Lock in gold cost, simplifying pricing and margin management
✅ B. Bullion Dealer/Retailer
Holds inventory — buys futures to guard against price drop
Over time, MTM fluctuations offset spot inventory gains/losses
Enables accurate working capital forecasting
✅ C. Refinery Example
Producing gold bars from scraps or raw gold
Sells refined gold in INR, but raw gold bought internationally in INR/USD
Hedging reduces mismatch, stabilizes profit margins
✅ D. Speculative/Arbitrage Traders
Play price differentials between MCX and IIBX
Exploit basis arbitrage or global/regional price plays
(Though speculative traders must be cautious of margin and regulatory requirements
7. Broader Impacts & Market Implications
🌐 Strengthening GIFT City Ecosystem
Diversifies offerings beyond forex and securities to bullion
Supports India’s vision of GIFT City as a global commodity hub
💰 Incentivizing Domestic Financial Institutions
AD banks can provide clients with hedging capabilities
Banks earn commissions and fees while helping reduce gold dependence on cash markets
🔄 Reducing Reliance on Overseas Exchanges
By offering global pricing and technology in India, overseas trading reductions save costs and complexity
🧰 Integration with Spot & Physical Markets
IIBX also operates spot segments for gold and silver
Interlinked spot-futures structure enables improved cash management and delivery coordination
8. Outlook: What Traders and Businesses Should Do Now
Assessment: Evaluate gold/currency exposures in your business (imports, inventory, exports)
Registration: Engage with AD banks for required approval and collateral setup
Education: Use IIBX’s website tutorials and circulars to understand margining and settlement norms
Start Small: Begin with a 1–2 contract hedge; monitor margin and execution
Expand Strategy: From spot hedges to calendar spreads and global arbitrage
For traders, domestic traders and arbitragers, a new tool has entered their toolbox—one that can level the playing field vs global participants.
9. Final Thoughts
The launch of Gold Futures on IIBX is a major evolution in India’s financial markets. It brings a sophisticated hedge mechanism—previously only available via overseas platforms—into the regulatory fold of GIFT City, in US dollars, tied to international prices. For jewellers, dealers, refiners, importers, and treasury teams, this is a powerful new instrument.
If adopted well, over time, it may reduce India’s dependence on international exchanges, bring more trading depth, and reduce gold price volatility for domestic stakeholders—all while supporting GIFT City’s vision as a world-class financial hub.
Rise of Algorithmic & Momentum-Based Strategy Innovation🧠 Introduction
The world of trading has changed drastically in recent years. Gone are the days when investors made decisions based on gut feeling, tips from friends, or simply following news headlines. Today, technology and data dominate the markets. A big part of this transformation is due to two fast-evolving areas of strategy:
Algorithmic Trading (Algo Trading)
Momentum-Based Trading Strategies
Together, these innovations are not just making trading faster—they're making it smarter, more scalable, and, in some cases, more profitable. Let’s explore this rise of strategy-driven trading in simple, relatable terms.
⚙️ What Is Algorithmic Trading?
Algorithmic trading (or "algo trading") refers to using pre-programmed computer code to buy and sell stocks or other financial assets. These programs follow specific sets of rules and conditions like:
Price movements
Volume changes
Timing of the trade
Technical indicators
News sentiment (in advanced models)
Instead of a human watching charts all day, the algorithm scans multiple assets simultaneously and executes trades at lightning speed when conditions are met.
🔍 Why Is It Popular?
Speed: Algos react in milliseconds.
Accuracy: Reduces human errors.
Discipline: Emotions like fear or greed don’t interfere.
Scalability: Can track hundreds of instruments at once.
⚡ What Is Momentum-Based Trading?
Momentum trading is based on a simple principle:
"What is going up will likely keep going up (at least for a while), and what is going down will keep going down."
Momentum traders try to ride these price trends. They don’t care much about why something is moving—they care that it is moving.
A momentum-based strategy focuses on:
Relative Strength Index (RSI)
Moving Averages
Breakouts above previous highs
Volume surges
In today’s digital world, most momentum strategies are now executed through algorithms, bringing us to the heart of this innovation wave.
💡 Why Is Strategy Innovation Booming in 2025?
1. Availability of Real-Time Data
In the past, getting real-time stock prices or volume data was expensive or difficult. Today, thanks to modern brokers and APIs, anyone can access tick-by-tick data in real time. This has democratized trading innovation.
2. Cloud Computing & Machine Learning
Cloud platforms like AWS, GCP, and Azure now allow even small traders to run complex models. Add machine learning to the mix, and you can build:
Predictive price models
Auto-optimizing strategies
Real-time anomaly detectors
This tech stack is fueling rapid innovation in custom algos and momentum-based systems.
3. Rise of API Brokers
Brokers like Zerodha (via Kite Connect), Upstox, and Dhan offer APIs that allow traders to:
Place trades programmatically
Access order books
Monitor positions via code
This has opened the doors for retail coders and quant enthusiasts to create strategies from their bedrooms—something only institutions could do a decade ago.
4. Market Volatility & Liquidity
Modern markets, especially post-COVID and now with geopolitical unrest, are fast-moving and noisy. Traditional long-term investing sometimes feels too slow. This has created fertile ground for short-term strategies like intraday momentum and algo scalping.
🧬 Types of Momentum-Based Algo Strategies Gaining Popularity
1. Breakout Algos
Entry: When price breaks above a resistance level or 52-week high.
Exit: After achieving target return or on breakdown.
2. Mean Reversion Momentum
Belief: Stocks that over-extend eventually revert back to mean.
Algo buys on dips and sells on peaks, based on Bollinger Bands or Moving Average deviations.
3. Relative Momentum Rotation
Focus: Switch between sectors/stocks showing strongest momentum.
Example: If Auto sector shows higher returns than Pharma over 4 weeks, the algo reallocates capital into Auto.
4. High-Frequency Momentum
Based on volume spikes, price speed, and Level-2 data.
Needs co-location or ultra-low latency to profit from small tick movements.
📊 Real-World Examples (2025 Trends)
Nifty and Bank Nifty Momentum Bots
Retail algo traders now use trend-following strategies on Nifty weekly options, taking intraday calls when the index crosses VWAP + 2%.
SME IPO Listing Day Momentum Plays
Some traders have built algos that scan listing price action and jump in when a stock breaks opening highs with volume.
AI-Augmented Algos
AI-powered bots use NLP (Natural Language Processing) to analyze earnings calls, company announcements, and even tweets. If sentiment is strongly positive, they take long positions.
🧠 Benefits of These Innovations
✅ For Retail Traders:
Better access to tools once exclusive to hedge funds.
Ability to automate their edge.
Save time watching screens all day.
✅ For Institutions:
Lower execution costs.
Scalable strategies across global markets.
Statistical models reduce dependence on human traders.
🧱 Challenges and Limitations
❌ Overfitting in Backtests
Just because a strategy worked in the past doesn't guarantee future success. Many algos “look perfect” in backtests but fail in live trading.
❌ API Latency and Downtime
Retail infrastructure is not as reliable as institutional setups. Brokers may experience order delays or API failures.
❌ Regulation Risk
SEBI and global regulators are watching algo trading closely. Flash crashes or manipulative algos can bring scrutiny and even bans.
❌ Emotional Disengagement
Too much automation can make traders disconnected from market context. Sometimes, manual intervention is needed.
🧭 What’s the Future of These Strategies?
🔮 1. AI + Algo = Self-Learning Bots
The next wave of bots may not follow fixed rules. They may adapt automatically by learning from market behavior—almost like an evolving trader.
🔮 2. Regulation Around Algo Trading
Expect more regulation in 2025–2026 to ensure fairness and stability. SEBI may require audits or sandbox testing before public deployment.
🔮 3. Community-Based Innovation
Open-source algo trading platforms (like Blueshift, QuantConnect, etc.) are becoming collaborative hubs where traders share and upgrade each other's strategies.
🔄 How Can a Retail Trader Start?
✅ Step 1: Learn Python or Use No-Code Platforms
Python is the language of algo trading. If you can’t code, use platforms like AlgoTest, Tradetron, or Streak.
✅ Step 2: Start Small
Begin with paper trading or small capital. Don’t go all-in until you have confidence and historical data.
✅ Step 3: Choose a Clean Strategy
Start with something simple—like RSI + Moving Average crossover, and backtest on Nifty.
✅ Step 4: Track Metrics
Measure win ratio, drawdown, average profit per trade. Good algo traders analyze more than they trade.
✍️ Final Words
The rise of algorithmic and momentum-based strategy innovation is reshaping India’s trading landscape. It’s making the game smarter, faster, and more competitive. But like every tool, it depends on how you use it. These strategies aren’t magic bullets—they're systems that require patience, research, and constant optimization.
For traders willing to invest in knowledge and tools, the opportunities are exciting. For those hoping to “copy-paste” quick riches, the market may prove costly.
In 2025 and beyond, the best traders may not be those with the sharpest eyes—but those with the smartest code.
SEBI’s Derivatives Market Reforms & Jane Street Fallout1. The Bigger Picture: Why SEBI Intervened
India is currently the world’s largest equity derivatives market in terms of contracts traded. On expiry days, the trading volume in index derivatives—especially options—is often more than 300 times higher than that of the cash market. This unprecedented scale might sound like a success story at first glance, but SEBI, the Securities and Exchange Board of India, saw warning signs flashing bright red.
Over the past few years, retail traders have swarmed into the derivatives space, especially index options like Bank Nifty and Nifty 50. Most of them are drawn in by the promise of quick profits and leveraged exposure. However, a SEBI study revealed that 91% of retail traders in derivatives ended up losing money. That’s an alarming statistic. It signaled that the market was becoming speculative rather than investment-oriented.
Additionally, the structure of the market had become heavily tilted towards short-tenure options—weekly, and even daily expiries—turning it into a speculative playground. This over-dependence on weekly contracts resulted in wild swings, sharp intraday moves, and extreme volatility, especially on Thursdays (the weekly expiry day). This environment wasn't healthy—neither for long-term investors nor for the broader financial ecosystem.
SEBI saw this as a structural issue and decided to take bold steps to reform the derivatives market and make it safer, more rational, and more sustainable.
2. SEBI’s Core Reforms: Changing the Game
a) Extending Contract Tenure
One of the biggest problems SEBI identified was the overuse of ultra-short-term contracts. Weekly options had become the norm, with traders focusing on short bursts of market movement rather than making informed investment or hedging decisions.
To counter this, SEBI is planning to extend the tenure of derivative contracts. This means:
Less frequent expiries.
Longer-dated instruments becoming more liquid.
Reduced scope for expiry-based volatility and manipulation.
By pushing the market toward longer expiry contracts (like monthly and quarterly), SEBI wants to encourage thoughtful strategies, proper hedging, and discourage fast-money, short-term gambling.
b) Discouraging Retail Over-Speculation
Retail participation in the F&O market has skyrocketed, but most retail traders don’t fully understand the risks involved. SEBI has already taken several steps to discourage reckless speculation, such as:
Reducing the number of expiries per month.
Increasing the lot size of index futures and options, making it harder for small-ticket traders to over-leverage.
Introducing detailed risk disclosures on broker apps to educate traders about potential losses.
These steps are aimed at protecting small investors and bringing more stability to the market.
c) Focusing on the Cash Market
India’s cash equity market is relatively underdeveloped when compared to its derivatives segment. SEBI aims to rebalance this. By encouraging growth in the cash market, SEBI hopes to reduce the over-reliance on F&O and create a healthier, more resilient market structure.
3. The Jane Street Controversy: What Happened?
In July 2025, SEBI dropped a regulatory bombshell by banning Jane Street, a major US-based high-frequency trading (HFT) firm, from Indian markets. This wasn’t just a slap on the wrist—it was a full-blown interim order with massive consequences.
The Allegations:
SEBI alleged that Jane Street engaged in manipulative expiry-day strategies over a multi-year period. Here’s what SEBI believes happened:
In the morning of expiry days, Jane Street allegedly bought large volumes of index-heavy stocks. This artificially pushed the index higher.
At the same time, they opened short positions in index options, betting that the index would fall later.
In the afternoon, they unwound their stock positions, which pulled the index down.
As the index dropped, their short options positions profited heavily.
This strategy allowed them to make massive profits on expiry days, using their firepower to allegedly manipulate both the cash and derivative markets.
SEBI’s Action:
Barred Jane Street from trading in Indian markets.
Ordered them to deposit over ₹4,800 crore (~$570 million) in suspected unlawful gains.
Accused the firm of using its dominant market position to rig expiry-day movements.
Jane Street, of course, denied the allegations, claiming that their trades were legal arbitrage and part of liquidity provisioning. They are challenging the order in court, but the damage—both reputational and market-wide—has already been done.
4. The Immediate Fallout: Markets Take a Hit
The ban on Jane Street had a chilling effect on the market. Here's what followed:
a) Volume Drops
Jane Street was a major market maker in India’s derivatives space, especially on expiry days. After the ban:
F&O volumes dropped by over 30%.
Index options saw significantly reduced liquidity.
The premium turnover on the NSE fell by nearly 36%.
This wasn’t just a temporary blip. It revealed how dependent the Indian market had become on a few HFT firms to provide liquidity and manage spreads.
b) Volatility Dips
Interestingly, India’s volatility index (VIX) dropped to multi-month lows post the ban. With fewer players like Jane Street aggressively trading expiry moves, the markets became calmer. While this might seem good, too little volatility can reduce trading opportunities and narrow market participation.
c) Wider Spreads and Execution Slippage
With fewer market makers and less volume, traders—especially institutions—began facing wider bid-ask spreads. That means it became more expensive to execute trades, especially in large quantities. This can hurt mutual funds, FIIs, and even large domestic traders.
5. Broader Implications for the Indian Market
a) SEBI’s Strength as a Regulator
This episode showcases that SEBI is serious about enforcing discipline, even if it means challenging a global giant like Jane Street. That sends a strong signal to both domestic and international players: India’s markets are not a free-for-all.
b) Liquidity Vacuum
With Jane Street gone, there's a temporary liquidity vacuum. Other firms are cautious, unsure if they might be targeted next. SEBI needs to strike a balance—encouraging good players while weeding out bad behavior.
c) Investor Confidence and Market Maturity
While retail traders might find the new reforms and lower volatility frustrating, long-term investors and institutions are likely to benefit from a more predictable and transparent market.
6. Legal Battle and Global Ramifications
Jane Street has taken the legal route, depositing the required funds while appealing the SEBI ban. Depending on how the case proceeds:
It could set new legal precedents in Indian market jurisprudence.
It may influence how SEBI handles future cases involving algorithmic or HFT trading.
Other global firms might review or revise their India strategies, balancing opportunity with regulatory risk.
If SEBI wins the case, it strengthens its position as a tough, credible regulator. If Jane Street wins, it may force SEBI to revisit how it defines and regulates market manipulation, especially in the algo/HFT space.
7. What This Means for You (the Trader/Investor)
For Retail Traders:
Expect fewer sharp expiry-day moves. Strategies based on quick, expiry-day scalping may need to be adapted.
Market may feel slower, but potentially safer.
You’ll need to focus more on strategy, research, and planning, instead of gambling on weekly moves.
For Institutions:
Market access costs may rise due to wider spreads.
Less volatility may reduce arbitrage and quant trading opportunities.
Need for more diversified trading models, including participation in the cash and bond markets.
For Market Observers and Policy Thinkers:
This is a rare opportunity to watch a major regulatory shift unfold.
India’s market is transitioning from being a trader’s playground to an investor’s ecosystem.
8. What Comes Next?
SEBI will likely roll out more reforms—stricter monitoring, revised rules for expiry days, and enhanced surveillance.
New market makers may enter the space, possibly Indian firms or global ones with stronger compliance protocols.
Jane Street’s legal outcome will influence how aggressively foreign algo firms operate in India going forward.
✍️ Final Word
The SEBI vs Jane Street saga is more than a single enforcement action—it’s a symbol of India’s market maturity. By reforming derivatives and holding big players accountable, SEBI is trying to create a safer, more balanced market for everyone—from retail investors to institutional giants.
The road ahead may involve some pain—lower volumes, fewer trading thrills—but the foundation being laid could ensure a more sustainable, fair, and globally respected financial market

Learn Institutional Trading Part-9🎯 Why Learn Advanced Option Trading?
Advanced option trading lets you:
✅ Profit in bullish, bearish, or sideways markets
✅ Use time decay to your advantage
✅ Limit risk while maximizing potential reward
✅ Create non-directional trades
✅ Build hedged and balanced positions
✅ Use data, not emotion for decision making
It shifts you from being a trader who hopes for direction to one who profits from market behavior — movement, volatility, time decay, and imbalance.
🧠 Core Concepts in Advanced Option Trading
1. Option Greeks
Understanding the Greeks is essential for advanced strategies.
Delta: Measures price sensitivity to the underlying (helps with directional trades).
Theta: Measures time decay. Option sellers use Theta to earn premium.
Vega: Measures sensitivity to implied volatility (IV).
Gamma: Measures how Delta changes — useful for adjustments and hedging.
Rho: Interest rate sensitivity (used in long-term options).
Greeks help you balance risk and reward and fine-tune your strategies based on volatility and time.
2. Implied Volatility (IV) & IV Rank
IV shows the market’s expectation of future volatility.
High IV = high premium; low IV = cheap premium.
IV Rank compares current IV to its past 52-week range — essential for deciding whether to buy or sell options.
💡 Advanced rule:
High IV + High IV Rank = Favor selling options
Low IV + Low IV Rank = Favor buying options
3. Multi-Leg Strategies
Multi-leg trades involve using more than one option to hedge, balance, or amplify your position.
Here are the most popular advanced option strategies:
🔼 Bullish Strategies
🔹 Bull Call Spread
Buy one lower strike Call, sell a higher strike Call
Profits if the market rises within a defined range
Lower cost than buying a single Call
🔹 Synthetic Long
Buy a Call and Sell a Put of the same strike
Replicates owning the underlying, but with options
🔽 Bearish Strategies
🔹 Bear Put Spread
Buy a higher strike Put, sell a lower strike Put
Profits if market falls within a defined range
🔹 Ratio Put Spread
Buy one Put, sell two lower-strike Puts
Low-cost or credit strategy with higher reward if price falls moderately
🔁 Neutral or Range-Bound Strategies
🔹 Iron Condor
Sell one Call spread and one Put spread
Profits if market stays between both spreads
Ideal in low volatility, sideways markets
🔹 Iron Butterfly
Sell ATM Call and Put, buy OTM wings
Profits from time decay and stable price
High Theta, limited risk and reward
🔹 Straddle (Buy/Sell)
Buy/Sell ATM Call and Put
Used when expecting high volatility (Buy) or low volatility (Sell)
🔹 Strangle
Buy/Sell OTM Call and Put
Lower cost than Straddle, wider profit zone
🛡️ Hedging Strategies
🔹 Protective Put
Hold underlying asset, buy a Put to limit downside
Like insurance for your long position
🔹 Covered Call
Hold stock, sell a Call to generate income
Profitable if the stock stays flat or rises slightly
🔹 Collar Strategy
Hold stock, buy Put and sell Call
Risk defined, reward capped — good for conservative investors
📊 Open Interest & Option Chain Analysis
Open Interest (OI) shows where the majority of contracts are built.
High OI + Price Rejection = Institutional Resistance/Support.
Watching Call/Put buildup gives clues about range, breakout zones, and expiry-day moves.
💡 PCR (Put Call Ratio): A sentiment indicator.
PCR > 1: More Puts → Bearish
PCR < 1: More Calls → Bullish
⏱️ Time Decay & Expiry Trades
Advanced traders use weekly options to capitalize on Theta decay. Weekly expiry strategies include:
Short Straddles/Strangles
Iron Condors
Calendar Spreads
These strategies make use of:
Fast premium decay on Thursday/Friday
Stable market periods
Defined risk setups
🧠 Advanced Psychology & Risk Control
Professional option traders don’t overtrade or overleverage. They:
Follow the 1–2% risk per trade rule
Avoid trading during event-based spikes (e.g., budget, Fed speeches)
Take non-directional trades in consolidating markets
Focus on probability over prediction
Maintain a trading journal and review setups
🎓 Pro Tips to Master Advanced Option Trading
✅ Understand the Greeks — especially Theta & Vega
✅ Use multi-leg strategies to reduce risk and cost
✅ Follow IV Rank — don’t buy expensive options
✅ Use high reward-to-risk setups
✅ Track OI build-up and option chain flow
✅ Avoid gambling — options are tools, not lottery tickets
✅ Always use hedged positions, especially when selling options
🧘 Final Words: Become the Strategist, Not the Speculator
Advanced Option Trading is not about guessing where the market will go — it’s about constructing trades that win in multiple scenarios.
It empowers you to:
Manage risk like a professional
Generate regular income from time decay
Adjust and defend trades when things go wrong
Trade with confidence, not emotion
If you’re ready to move beyond basic buying and start mastering the real edge in options, advanced strategies are your next level. This is how institutions trade. This is how real consistency is built.

Master Candle Sticks part-2🔥 What Are Candlesticks?
A candlestick is a visual representation of price movement within a specific time period (1 minute, 1 hour, 1 day, etc.). It consists of:
Body – The area between the open and close.
Wick (Shadow) – The high and low prices reached.
Color – Usually green (bullish) or red (bearish).
🧠 Why Learn Master Candlestick Patterns?
Mastering candlestick patterns helps traders:
Identify trend reversals or continuations.
Get early entry or exit signals.
Understand market psychology and price action.
Improve risk-reward ratios in trades.
🧭 Top Master Candlestick Patterns (Explained Simply)
Here are some of the most important candlestick patterns every trader should master:
1. Doji
🔍 Indecision in the market
Shape: Small body, long wicks
Meaning: Buyers and sellers are equal – could indicate a reversal if found after a trend.
Types: Standard Doji, Long-Legged Doji, Dragonfly, Gravestone
2. Hammer 🔨
📈 Bullish reversal pattern
Shape: Small body at top, long lower wick
Appears: After a downtrend
Signal: Buyers are stepping in strongly
3. Inverted Hammer
📈 Also bullish reversal
Shape: Small body at bottom, long upper wick
Appears: After a downtrend
Signal: Buyers testing resistance – may rise soon
4. Shooting Star 🌠
📉 Bearish reversal
Shape: Small body at bottom, long upper wick
Appears: After an uptrend
Signal: Sellers taking control
5. Engulfing Patterns
A. Bullish Engulfing
Two candles: First red (small), second green (larger, fully covers the red)
Appears: At the bottom of a downtrend
Signal: Strong reversal to upside
B. Bearish Engulfing
Two candles: First green (small), second red (large, covers the green)
Appears: At the top of an uptrend
Signal: Reversal to downside
6. Morning Star 🌅
📈 Three-candle bullish reversal
1st: Long red
2nd: Small (any color)
3rd: Strong green
Appears: After downtrend
7. Evening Star 🌇
📉 Three-candle bearish reversal
1st: Long green
2nd: Small (indecision)
3rd: Strong red
Appears: After uptrend
8. Marubozu
💡 Strong trend candle
No wicks (only body)
Green Marubozu: Full bullish power
Red Marubozu: Full bearish power
9. Spinning Top
🔄 Low momentum or indecision
Small body, equal upper and lower wicks
Shows uncertainty – market could reverse or consolidate
📘 Tips to Master Candlestick Reading
Don’t rely on just one candle. Always see the pattern in context of previous trend.
Use volume with candlesticks – A reversal candle with high volume is more powerful.
Combine with other tools – Support/Resistance, Moving Averages, RSI, etc.
Practice on charts daily – Backtest on historical data
✅ Final Thoughts
Master Candlestick Patterns are a foundation for price action trading. They don't work alone but when used wisely with technical indicators and proper risk management, they can give high-probability setups.

The “M” Pattern: A Swing Trading vs. Wave Trading PerspectiveSwing Trading View
In swing trading, the M pattern is a widely recognized and frequently traded formation. It typically signals a potential trend reversal and is considered the opposite of the W pattern, which indicates bullish setups.
The M pattern presents two main trading opportunities for swing traders:
Short at the Double Top:
When the price forms a double top, traders often enter a short position targeting the neckline as the profit zone. This setup banks on the failure of the price to break previous highs, indicating exhaustion in bullish momentum.
Long at the Neckline Bounce:
If the price reaches the neckline and bounces upwards, traders may initiate a long position, aiming for the previous swing high. This move anticipates a potential failed breakdown or a continuation of the broader trend.
In both cases, trailing stop-losses can be employed to ride the trade further if momentum continues. However, swing traders must rely on discretion and market context to decide when to exit, as there's no deeper structural guide beyond the pattern.
Wave Trading View
From an Elliott Wave perspective, patterns resembling the letter “M” often arise during a Flat correction, one of the three core corrective structures—Zigzag, Flat, and Triangle.
Flat corrections unfold in a 3-3-5 wave structure, labeled as waves A-B-C:
In a bullish market correction,
Wave A: Downward move (3 waves)
Wave B: Upward retracement (3 waves)
Wave C: Final downward move (5 waves)
Flats occur in three variations:
Regular Flat: Waves A and B are nearly equal in length, with Wave C slightly longer.
Expanded (Extended) Flat: Wave B travels beyond the start of Wave A, often reaching up to 1.33x Wave A. If Wave B exceeds 1.33x, it is no longer considered a valid flat.
Running Flat: Wave C does not surpass the end of Wave A, creating a skewed M-like shape.
In this structure:
The “M” appearance is most prominent when plotted visually, especially in regular or extended flats (as found in the accompanied chart of GRSE).
The unique edge for a wave trader lies in contextual awareness—knowing where flats are likely to form based on the wave formation.
Unlike swing traders who trade patterns in isolation, wave traders operate within a broader map, allowing them to:
Anticipate the pattern in advance
Position precisely within the structure
Manage trades with greater confidence based on Fibonacci relationships and wave counts
Wave C is particularly important:
It must consist of 5 sub-waves. Its minimum length should be equal to the distance from the start of Wave A to the end of Wave B. Even if this ratio is only marginally exceeded, the presence of a clear 5-wave subdivision confirms the end of the correction, subject to end of sub-wave 5.
In essence, while both swing and wave traders may trade the same “M” pattern, the wave trader approaches it with far deeper context, structure, and predictive insight—enabling more precise and confident trading decisions.
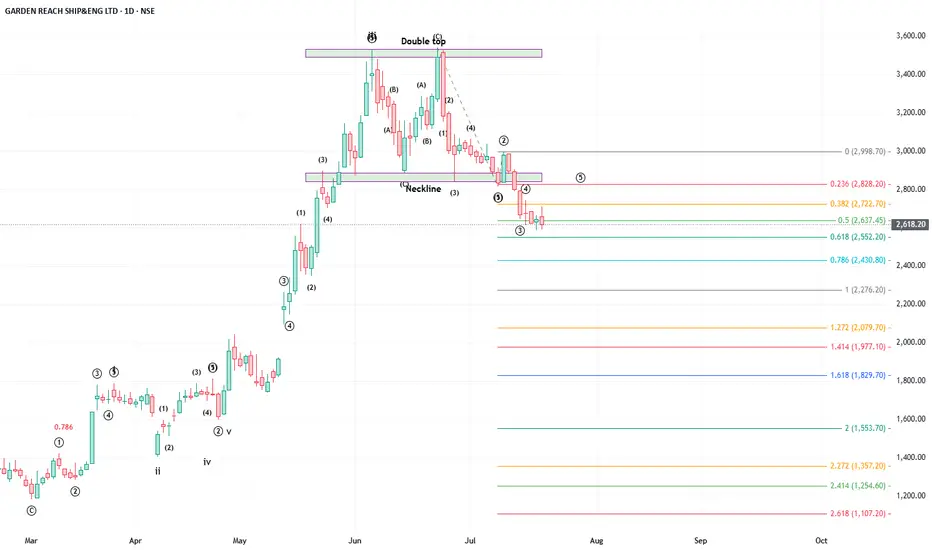
High-Probability Scalping Techniques🔍 What Is Scalping?
Scalping is a fast-paced intraday trading style where traders aim to take multiple small profits throughout the trading day. Instead of holding trades for hours or days, scalpers may be in and out of trades within minutes or even seconds.
Scalping is all about:
Quick entries and exits
High accuracy
Controlled risk
Small but frequent gains
The core idea? “Many small wins add up to a big win.”
Scalping works best in liquid markets, like Nifty, Bank Nifty, large-cap stocks, or high-volume futures and options.
💡 Why Do Traders Choose Scalping?
Scalping is perfect for traders who:
Have limited capital but want to grow it steadily
Prefer not to hold positions overnight (no gap-up/gap-down risk)
Love short-term action and decision-making
Want to trade professionally in 1-2 hours daily
Also, scalping can reduce your exposure to market news, global events, or overnight uncertainty.
But remember: scalping isn’t easy. It’s a skill. You need discipline, speed, and a proven strategy.
🎯 Key Characteristics of High-Probability Scalping
To make scalping successful, your strategy must include:
Factor Requirement
Speed Fast entries and exits with minimal slippage
Liquidity Trade only stocks/indexes with high volume
Precision Narrow stop losses, clear targets
Discipline No emotions, stick to plan
Risk Management Small risk per trade, compounding over time
🧠 Scalper's Mindset: Think Like a Sniper, Not a Machine Gunner
You’re not shooting randomly. You’re waiting patiently for high-probability opportunities where the odds are clearly in your favor.
Scalping is not about trading more—it’s about trading better.
🔧 Tools Every Scalper Needs
Before we dive into strategies, here’s what you must have in place:
Fast internet connection
Live market depth / Level 2 data
5-min, 1-min, and tick charts
Hotkeys for fast order placement
Broker with low brokerage per trade
Scalping involves dozens of trades per session, so costs matter!
🛠️ High-Probability Scalping Techniques (Explained in Human Language)
Let’s now explore some proven techniques that many experienced scalpers use.
🔹 1. VWAP Bounce Strategy
VWAP = Volume Weighted Average Price. It tells you the average price where most volume happened during the day.
📌 Concept:
In a trending market, price often bounces off VWAP before continuing the trend.
You trade that bounce.
✅ Rules:
Identify trend (price above VWAP = uptrend, below = downtrend)
Wait for a pullback to VWAP
Look for confirmation (like a bullish candle in uptrend)
Enter trade with tight SL below VWAP
Target = 0.5% to 1% move
🔍 Chart Timeframe:
1-minute or 5-minute candles
Ideal for: Nifty/Bank Nifty, Reliance, HDFC, SBIN, INFY
🔹 2. Opening Range Breakout (ORB)
This is a classic scalping setup used in the first 15–30 minutes of market open.
📌 Concept:
First 15-min range defines the initial battle between buyers/sellers.
Breakout from this range = strong momentum.
✅ Rules:
Mark high and low of 15-min candle from 9:15 to 9:30
Buy when price breaks above the high + volume rises
Sell when price breaks below the low + volume rises
SL = below/above opposite side of the range
Target = 1:1 or trail profit
💡 Tip:
Works best on trending news days or earnings release days.
🔹 3. Scalping Breakouts with Volume Confirmation
A breakout is only real if volume supports it. Otherwise, it’s a trap.
✅ Rules:
Use 5-minute chart
Identify consolidation (flat price action with narrow range)
Watch for breakout with spike in volume
Enter with SL just outside the range
Exit with a 1:1 or 1.5:1 risk-reward
🎯 Indicators:
Bollinger Bands tightening
Volume histogram
Price breaking upper/lower band
🔹 4. RSI Divergence Scalping
You can scalp reversal points using RSI divergence.
✅ Rules:
Use 5-min or 3-min chart
RSI near 70 or 30 signals overbought or oversold
If price makes higher high but RSI makes lower high → Bearish divergence
If price makes lower low but RSI makes higher low → Bullish divergence
Enter for quick reversal scalp
SL = recent swing high/low
Target = VWAP or recent pivot
🔹 5. News-Based Scalping
Scalping on earnings releases, news events, or market-moving headlines can be profitable—but risky.
✅ Approach:
Stick to high-volume large-cap stocks
Avoid holding more than a few minutes
Use Level 2 order book to watch supply/demand shifts
Trade the initial burst, exit quickly
📈 Ideal Indicators for Scalping
VWAP
RSI (5 or 14-period)
Bollinger Bands
EMA crossover (e.g., 8 EMA vs 21 EMA)
MACD (fast settings for short-term signals)
But remember: indicators are tools, not guarantees. Always combine them with price action and volume.
📉 Risk Management: The Scalper’s Shield
This part matters even more than the strategy itself.
Rule Explanation
Risk only 0.5% to 1% of capital per trade Protects you from wipeout on a bad day
Always have a stop-loss No SL = no survival
Don’t average losing trades You’re scalping, not investing
Exit on SL or target—no emotion Don’t hope, don’t pray
Track your win-rate Aim for 60%+ with 1:1 risk-reward
🧮 Sample Scalping Day Plan
Time Action
9:15–9:30 AM Watch first 15-min candle for ORB
9:30–11:00 AM Take 2-3 high-quality trades (VWAP bounce, RSI scalp)
11:00–2:00 PM Avoid choppy markets or only scalp consolidations
2:00–3:00 PM Look for afternoon breakouts
3:00–3:20 PM Avoid taking fresh trades, exit open ones
🔁 Scalping Checklist
Before you place any trade, ask yourself:
✅ Is the setup clear and backed by volume?
✅ Am I trading with the trend or against it?
✅ Is my SL defined and within risk limit?
✅ Am I emotionally calm and focused?
✅ Is this a high-probability or random trade?
📊 Example of a High-Probability Scalping Trade
Stock: Reliance
Chart: 1-min
Setup: VWAP bounce + bullish engulfing candle
Entry: ₹2,950
Stop-Loss: ₹2,944
Target: ₹2,958
Result: Profit of ₹8 per share in 3 minutes
This may look small—but scalpers do 5–10 such trades a day, scaling with quantity.
🚨 Common Mistakes to Avoid
❌ Overtrading (more is not better)
❌ No plan or random entries
❌ Chasing trades late
❌ Holding scalps like swing trades
❌ Trading during news without preparation
❌ Ignoring transaction costs
🧾 Final Words: Is Scalping Right for You?
Scalping is not for everyone. It requires:
High focus and speed
Strong discipline
Quick decision-making
Excellent risk control
But if you develop the skill, it can provide:
Daily consistency
Limited overnight risk
Quick compounding
Full control over trades
✅ Start small.
✅ Practice on paper or low quantity.
✅ Use one strategy, track results, then scale up.
AI & Algo-Based Automated Trading🤖 What Is Algorithmic Trading?
Algorithmic Trading, or simply Algo Trading, is when computer programs automatically place buy/sell orders based on pre-defined rules, without human intervention.
Imagine giving your laptop a checklist like:
“If Nifty goes above 22,500 AND RSI is above 60 AND volume is high, then BUY.”
The computer will monitor the market 24x7—and the moment this condition is met, it will execute the trade automatically in milliseconds.
This kind of rule-based, automated trading using programs is Algo Trading.
🧠 What Is AI in Trading?
AI-based trading goes a step further.
Unlike basic algos that follow fixed rules, AI can learn, adapt, and improve with experience—just like humans.
Using technologies like:
Machine Learning (ML)
Natural Language Processing (NLP)
Neural Networks
Predictive Analytics
AI systems analyze massive amounts of data, including charts, volumes, news, tweets, macro events, and more—and predict future price movements or generate smart trading signals.
So while Algo Trading is like giving instructions to a robot, AI Trading is like training a robot to think like a trader
How Does Algo Trading Work?
Algo trading usually follows a 4-step cycle:
Strategy Design:
You create a trading rule, e.g. “Buy if 5 EMA crosses 20 EMA”.
Execution:
Set it up with your broker or software to trade automatically.
Monitoring:
Keep an eye to adjust for market conditions or technical issues.
Common Algo Strategies:
Moving average crossovers
Mean reversion
Arbitrage (buy low, sell high across markets)
Trend following
Momentum trading
Scalping (multiple small profits in quick trades)
🔮 How Does AI-Based Trading Work?
AI-based systems do all the above PLUS:
Analyze news sentiment (good or bad for a stock)
Understand social media buzz (like Twitter or Reddit)
Learn from historical chart patterns and price movements
Adjust strategies based on outcomes (self-improvement)
Example:
An AI bot could learn that when crude oil prices rise + VIX increases + USDINR weakens → certain oil & gas stocks tend to rally → it may buy those stocks automatically.
This is smart prediction, not just following a rule.
🌐 Who Uses AI & Algo Trading?
✅ Institutional Investors:
Mutual Funds
FIIs (Foreign Institutional Investors)
Insurance companies
Banks and proprietary trading desks
✅ Hedge Funds:
Quant funds like Renaissance Technologies, Two Sigma, Citadel use AI at scale
💰 Benefits of AI & Algo Trading
Speed – Trades happen in milliseconds. You can’t beat that manually.
Discipline – No emotional trading, no greed or fear.
Scalability – Run multiple strategies on multiple stocks at once.
Precision – Orders are accurate, slippages can be minimized.
⚠️ Risks & Challenges
It’s not all sunshine and profits. Here are some things to be cautious about:
Risk Description
Overfitting Your model may work in the past but fail in live market.
Black Swans Unforeseen events can destroy even smart systems.
Data Issues Bad data = bad trades. Accuracy matters.
Connectivity/Tech If system crashes mid-trade, results can be brutal.
Emotional Blindness AI can't feel panic—good for rules, bad for crisis.
🧠 Real World Use Cases
✅ Example 1: Intraday Scalping Bot
Scans top 100 NSE stocks
Enters trades on VWAP bounces with strict SL
Exits with 0.5-1% target
Runs 50 trades/day across stocks
✅ Example 2: AI News Sentiment Strategy
Uses NLP to scan headlines, tweets, earnings
Classifies news into “Positive”, “Negative”, or “Neutral”
Trades in the direction of sentiment before retail even reacts
✅ Example 3: Pair Trading Algo
Compares movement of two related stocks (e.g. HDFC Bank vs ICICI Bank)
If one deviates too far from the other, it creates a hedge
Buy one, sell the other—profit from convergence
🔁 The Future: AI + Algo + Quantum + Blockchain?
The future of markets is combining:
AI (Decision Making)
Algo (Execution)
Blockchain (Transparency)
Quantum Computing (Speed & Accuracy)
Large financial institutions are already hiring AI scientists and coders instead of traditional analysts. Markets are evolving—and so should we.
🧾 Conclusion
AI & Algo Trading is the future—and the present. It’s fast, smart, and scalable.
Big institutions are already using them to make crores from micro-movements. For retail traders, this is an opportunity to level up, automate emotions out, and trade systematically
Option Selling Strategies for Monthly Income📘 What is Option Selling?
In options trading, you have two parties:
Option Buyer – Pays premium to buy the right (but not obligation) to buy/sell a stock or index
Option Seller (Writer) – Receives that premium, but takes on the obligation to deliver, if the buyer exercises
📌 So, in option selling:
You earn premium upfront
Your profit comes if the option expires worthless
Time is your friend (theta decay helps you)
The odds of success are higher, but risk is theoretically unlimited (if not managed well)
🔧 Core Concepts You Must Know Before Selling Options
✅ 1. Time Decay (Theta)
Option prices fall as expiry nears (especially if OTM)
Sellers benefit because buyers lose value daily
✅ 2. Implied Volatility (IV)
Higher IV = Higher Premiums = Better for sellers
Sell when IV is high, buy when IV is low
✅ 3. Margin Requirement
You need sufficient funds (or collateral) to sell options
Brokers block margin depending on your strategy
✅ 4. Strike Price Selection
Selling options far away from current price reduces risk
Choose strikes based on support/resistance or option chain OI
📦 Top 4 Option Selling Strategies for Monthly Income
Let’s look at the most trusted, beginner-to-pro level strategies used for monthly income.
🔹 1. Covered Call – Best for Stock Investors
You own a stock and you sell a Call Option against it.
Generates income from stocks you already hold
You earn premium every month
If stock stays below strike → you keep stock + premium
If stock crosses strike → your stock may get sold (with profit)
Example:
You hold 1 lot of TCS (300 shares) at ₹3,600
Sell 3700CE for ₹40 premium
If TCS stays below ₹3700, you keep ₹12,000 premium (₹40 × 300)
✅ Low risk
✅ Good for long-term investors
🚫 Limited upside on stock
🔹 2. Cash-Secured Put (CSP) – Get Paid to Buy Stocks
You sell a Put Option for a stock you’re willing to buy at a lower price.
You collect premium
If stock falls below strike → You must buy it
You effectively get stock at discount
Example:
Sell 3600PE in TCS and collect ₹50 premium
If TCS closes above ₹3600, you keep the ₹15,000 premium
If TCS drops below ₹3600, you get to buy it—but at an effective price of ₹3550
✅ Ideal for long-term investors
✅ Safer than naked put selling
🚫 Requires full cash or margin
🔹 3. Short Strangle – Good for Range-Bound Market
You sell one Out-of-the-Money Call and one OTM Put.
Profit if the stock/index remains in a range
You earn premium from both sides
Risk if price moves too much either way
Example (Nifty at 24,000):
Sell 24200CE at ₹100 and 23800PE at ₹120
Total premium = ₹220 (₹11,000 per lot)
Max profit = ₹11,000 if Nifty stays between 23800 and 24200 till expiry
✅ High premium potential
🚫 Unlimited risk if market breaks range
✅ Can be hedged with far OTM buys
🔹 4. Iron Condor – Limited Risk, Limited Reward
This is an advanced version of strangle with protection.
Sell 1 OTM Call + 1 OTM Put
Buy 1 further OTM Call + 1 further OTM Put
You form a “box” where profit is limited, but losses are capped
Example (Nifty at 24000):
Sell 24200CE (₹100) + 23800PE (₹120)
Buy 24400CE (₹30) + 23600PE (₹40)
Total premium = ₹220 – ₹70 = ₹150
Max profit = ₹150 × 50 = ₹7,500
Max loss = ₹50 (difference in strikes – net credit)
✅ Great for peace of mind
✅ No unlimited risk
🚫 Less profit than naked strangle
📅 How to Use These Strategies for Monthly Income
🔄 Repeat Monthly:
Choose 1 or 2 strategies
Select stocks or index with high liquidity
Sell options 20–30 days before expiry
Exit before expiry (if needed) or let decay work
📌 Ideal Instruments:
Nifty / Bank Nifty
Liquid stocks: Reliance, HDFC Bank, Infosys, ICICI, TCS
🧠 Smart Practices:
Trade with capital you can afford to lock for a few weeks
Don’t sell options blindly – check news, IV, support/resistance
Use alerts or trailing stops
⚠️ Risks and How to Manage Them
Risk How to Handle
Unlimited Loss Use hedging (e.g., iron condor) or stop-losses
Sudden Market Moves Avoid during events (budget, elections, Fed)
Low Premium Don't sell too close to expiry with low reward
Margin Call Keep extra buffer; monitor exposure
Overtrading Stick to 1–2 good trades per expiry
✅ Final Thoughts
Option selling is not a get-rich-quick tool—but it’s a powerful way to generate stable income month after month, when done with patience, logic, and discipline.
You don’t need to be a genius—just:
Understand how premiums behave
Focus on low-risk, high-probability trades
Use hedges and stop-losses
Stick to tested rules
Track your performance and learn from mistakes
Liquidity Concepts & Smart Money Trading💧 What is Liquidity in the Stock Market?
In simple terms, liquidity means how easily you can buy or sell a stock (or any asset) without affecting its price too much.
📌 Imagine This:
You're at a crowded market and want to sell 10 bags of rice. If there are many buyers, you’ll sell quickly at your price. That’s high liquidity.
But if only 1 buyer is there, you’ll need to lower the price—or wait. That’s low liquidity.
✅ High Liquidity Stocks:
Easy to enter and exit
Tight bid-ask spread
High volume and interest
Examples: Reliance, HDFC Bank, TCS, Infosys
🚫 Low Liquidity Stocks:
Wide spread
May not execute large orders fast
Often in smallcap or SME segments
Prone to manipulation
So, as a trader or investor, liquidity matters because it affects:
Speed of your trades
Slippage (difference between expected and executed price)
Risk of getting trapped in illiquid counters
🧠 Who is “Smart Money”?
“Smart Money” refers to the big, institutional players who move the market silently.
🧱 Types of Smart Money:
FIIs (Foreign Institutional Investors)
DIIs (Domestic Institutional Investors)
Mutual Funds, Pension Funds
Hedge Funds
Prop Desks (Proprietary traders of large brokers or banks)
These players do not trade like retail traders. They have:
Huge capital
Access to better research
Advanced tools and algorithms
Patience to accumulate or distribute over days/weeks
The power to create or absorb liquidity
They don’t chase stocks. They build positions strategically.
🎯 The Relationship Between Liquidity & Smart Money
This is where it gets interesting.
Smart Money doesn’t want you to know what they’re doing. So they operate in stealth mode, using liquidity zones to enter/exit.
Let’s break this down in real terms.
💡 Real Example: How Smart Money Uses Liquidity
Scenario: Let’s say a mutual fund wants to buy ₹500 crore worth of a midcap stock.
If they suddenly place a large buy order, the price will shoot up.
So what do they do?
They wait for panic selling, like during news, results, or false breakdowns.
They create liquidity pools—zones where many stop-losses are triggered.
Retail traders sell in panic, creating supply.
Smart money absorbs quietly.
This is called accumulation.
Similarly, when they want to sell, they:
Push price up with breakout candles
Attract retail buyers chasing the move
Slowly distribute their holdings
Leave small players trapped at the top
🔄 Concepts You Must Know
1. Accumulation Zone
Where smart money buys silently
Flat or range-bound price action
Volume slowly rising
No major breakout yet
2. Distribution Zone
Where smart money sells quietly
Price looks strong, but momentum slows
Volumes stay high
Sudden rejections from resistance
3. Liquidity Grab / Stop Hunt
A deliberate move to trigger stop-losses and create liquidity
Often seen before real trend begins
Can be traps for retail traders
Example: Price breaks below support, then sharply reverses
📊 How to Track Liquidity & Smart Money Moves
Here are tools and techniques used by traders:
📌 1. Volume Profile
Shows where most trading has happened
High Volume Nodes (HVN): Liquidity zones
Low Volume Nodes (LVN): Price moves quickly
Watch for consolidation near HVNs—could be accumulation/distribution
📌 2. Order Book / Market Depth
For intraday traders
Shows how many buy/sell orders exist at various levels
Spikes in orders may signal liquidity traps or fake pressure
📌 3. Open Interest (OI) in Options
Rising OI + flat price = buildup
Long unwinding or short covering signals smart money behavior
📌 4. FII/DII Data
Track daily net buy/sell figures
Sectoral trends from mutual fund holdings
FII selling = market weakness, especially in large caps
📌 5. Wyckoff Method (Optional but powerful)
Focuses on market cycles
Accumulation → Markup → Distribution → Markdown
Helps understand the intent behind price action
🔥 Common Smart Money Setups
✅ 1. False Breakout Trap
Price breaks above resistance
Retail traders enter long
Smart money sells into strength
Price reverses
How to Spot:
Check volume
See if candle closes above or within resistance
Confirm with next bar’s reaction
✅ 2. Stop-Loss Hunting
Price dips below support
Retail SLs get hit
Price reverses sharply with strong volume
How to Spot:
Sudden wick below major swing low
Sharp V-shaped recovery
Volume spike + reversal candle
✅ 3. Liquidity Sweep Before Rally
Sideways phase ends with a big red candle
Then reversal and trend begins
This is smart money loading positions
🛠️ How to Use This in Trading (With Practical Tips)
✅ For Swing Traders:
Identify consolidation zones with rising volume
Wait for breakout or breakdown with volume
Add volume profile to spot high-activity zones
Check if OI is building around a strike in options
✅ For Intraday Traders:
Track OI buildup + price action around round numbers
Use Market Profile or VWAP to understand liquidity zones
Watch for traps near open or just before close
✅ For Investors:
Watch mutual fund buying sectors
Use MF/ETF monthly reports for accumulation patterns
Avoid chasing rallies—enter during base formation
✅ Final Thoughts
Most retail traders lose money not because their analysis is wrong—but because they don’t understand the rules smart money plays by.
In 2025’s market, where FIIs, algorithms, and institutions dominate, understanding liquidity and smart money behavior is not optional—it’s essential.
You don’t need millions to trade like smart money. You just need the right mindset, tools, and the patience to wait for clean setups.
📌 Remember: “Volume reveals the truth. Price tells the story. Liquidity is the language smart money speaks.
Support and Resistence Part-2✅ The True Meaning of Support and Resistance
At the core, support and resistance levels are psychological price areas where supply and demand dynamics shift. However, in institutional trading, these levels are engineered by large players to trigger retail reactions — such as false breakouts, stop hunts, and liquidity grabs.
Institutions use these levels to:
Accumulate large positions without moving the market.
Manipulate price to create breakout traps.
Trigger liquidity pools where retail stop-losses and pending orders are stacked.
✅ Types of Advanced Support and Resistance
1. Liquidity-Based Zones
Institutions seek liquidity to fill their large orders. They target zones where retail traders:
Place stop losses.
Have pending buy/sell orders.
Expect breakout continuations.
These zones are rarely clean horizontal lines but broader zones where price can spike in and quickly reverse.
2. Order Blocks
Order blocks are the last bullish or bearish candles before a significant price move caused by institutional orders. These are key institutional support/resistance levels where price often returns for mitigation or re-entry.
Bullish Order Block = Support Zone
Bearish Order Block = Resistance Zone
3. Breaker Blocks
When support breaks and flips to resistance (or vice versa), institutions often retest breaker blocks to add positions or induce liquidity.
4. Fibonacci Confluence Zones
Advanced traders use Fibonacci retracement and extension levels in combination with support and resistance zones to identify high-probability trade setups. Common levels like 61.8% and 78.6% often align with key order blocks.
5. Dynamic Support & Resistance (Moving Averages, VWAP)
Institutions monitor:
200 EMA/SMA on higher timeframes as dynamic resistance/support.
VWAP (Volume Weighted Average Price) as an institutional support/resistance during intraday moves.
These dynamic levels often act as price magnets during trend days.
✅ Institutional Manipulation Around Support/Resistance
🔹 Liquidity Grabs (Fake Breakouts):
Price breaks a key level (support or resistance), triggers stops, grabs liquidity, and violently reverses.
Common in forex, indices, and crypto markets.
🔹 Stop Loss Hunting:
Institutions drive price into known stop zones to fill large orders cheaply, especially during low-volume sessions.
🔹 Re-Tests and Confirmations:
Professional traders wait for confirmation after breakouts.
A common method: Break – Retest – Continuation setup, especially around higher timeframe support/resistance.
✅ How to Trade Support and Resistance Like an Institution
Mark Zones, Not Lines: Use zones (20-50 pip zones in forex or 1-2% zones in stocks), not fixed lines.
Use Multi-Timeframe Confluence: Identify higher timeframe levels (Daily, Weekly) and trade based on lower timeframe confirmations (M15, M30, H1).
Wait for Confirmations: Avoid blind entries. Wait for:
Rejection Candles (Pin Bar, Engulfing, Doji)
Break of Structure (BOS) or Change of Character (CHoCH) after grabbing liquidity.
Target Imbalance Zones: Combine support/resistance with fair value gaps (FVG) or imbalances where price is likely to revisit.
Track Volume Reaction: Volume spikes at support/resistance zones often indicate institutional activity.
✅ Pro Tips for Mastering Support and Resistance
Never chase price. Let the market come to your zones.
Higher timeframe levels = stronger reaction zones.
Watch for ‘fakeouts’ during news releases – institutions use volatility to create liquidity spikes.
Learn to recognize exhaustion (long wicks, low momentum) after liquidity grabs to confirm reversals.
Institutional levels often align with market sessions – London Open, New York Open tend to respect these zones more than Asian session.
✅ Final Thoughts
At an advanced level, support and resistance aren’t simple price levels — they are strategic zones used by institutions to trap uninformed traders. Once you start recognizing these patterns, you’ll stop reacting emotionally and start anticipating market behavior like a professional. You’ll know when to stay patient, when to avoid traps, and when to capitalize on market inefficiencies with high-probability, low-risk trades.

Trade Like Istitution Why Learn to Trade Like Institution?
Financial markets are not random. They are highly manipulated and structured systems, controlled by major financial entities. When you trade like institution, you stop guessing and start understanding:
Where the big players place their orders.
How liquidity zones work.
Why certain price levels are targeted before major moves.
How you can identify smart money footprints and follow the dominant trend.
This approach teaches you to trade strategically, patiently, and professionally — eliminating the emotional rollercoaster most traders experience.
What You Will Learn in “Trade Like Institution”
✅ Smart Money Trading Concepts
Understand how institutions manipulate markets, create liquidity, and trap retail traders. Learn the basics of accumulation, manipulation, and distribution phases.
✅ Market Structure and Order Flow
Read the market from an institutional perspective using pure price action and market structure analysis. Identify break of structure (BOS) and change of character (CHoCH) signals that reveal when the market is about to move.
✅ Order Block Identification
Learn to locate order blocks, where institutions place their large orders. These zones are often the key areas where price reverses or explodes in a specific direction.
✅ Liquidity Zones and Stop-Loss Hunting
Discover how to identify liquidity pools, understand stop-loss hunting techniques, and position yourself for trades after liquidity grabs.
✅ Risk Management Like Institutions
Master the art of risk management, learning how big players manage risk efficiently to stay profitable long-term, even after losses.
✅ High-Probability Trade Setups
Get access to reliable entry techniques with precise stop-loss placement and optimal reward-to-risk setups that minimize risk and maximize returns.
✅ Live Market Application
Learn through real-world market examples, live sessions, and chart analysis to see how institutional concepts apply in active markets like forex, stocks, indices, and crypto.
Who Should Learn to Trade Like Institution?
This course is designed for:
📊 New traders who want to start the right way without falling into retail traps.
💡 Intermediate traders who have experience but struggle with consistency.
💼 Full-time or part-time traders who wish to level up their skills.
📈 Investors who want to actively manage and grow their wealth.
🎯 Ambitious traders who want to make trading a serious and professional income source.
Benefits of Trading Like Institution
✅ Stop being a victim of market manipulation and start trading with the market movers.
✅ Eliminate confusion, follow clean price action, and trade with confidence.
✅ Avoid low-probability trades by understanding where the real market action happens.
✅ Build strong discipline and follow a professional trading process.
✅ Achieve long-term profitability by managing risk like professionals.
✅ Become a confident, independent trader capable of thriving in any market condition.
Trading success comes from learning the truth behind market movements and following the professional path. This course will completely transform your approach to the markets. With Trade Like Institution, you’ll stop guessing, start predicting, and trade with an edge just like the top institutional traders do every single day
