Derivatives and Options TradingWhat Are Derivatives?
A derivative is a financial contract whose value is derived from an underlying asset. The underlying asset can be:
Stocks
Bonds
Commodities (gold, oil, wheat)
Currencies
Interest rates
Market indexes (like the S&P 500 or Nifty 50)
In simple terms, a derivative does not have independent value; its price depends on the value of something else.
Common Types of Derivatives
Futures Contracts
Options Contracts
Forwards Contracts
Swaps
Among these, futures and options are the most actively traded on exchanges.
Purpose of Derivatives
Derivatives serve three main purposes:
1. Hedging (Risk Management)
Hedging is used to reduce or eliminate financial risk. For example, a farmer expecting to harvest wheat in three months may use a futures contract to lock in a selling price today. This protects against the risk of falling prices.
Similarly, investors use options to protect stock portfolios from market downturns.
2. Speculation
Speculators use derivatives to profit from price movements. Because derivatives often require a smaller initial investment (called margin or premium), they provide leverage, allowing traders to control large positions with less capital.
However, leverage increases both potential profits and potential losses.
3. Arbitrage
Arbitrage involves exploiting price differences between markets. Traders buy an asset in one market and sell it in another where the price is higher, locking in a risk-free profit.
Understanding Options
An option is a type of derivative contract that gives the buyer the right, but not the obligation, to buy or sell an underlying asset at a specific price on or before a specific date.
There are two main types of options:
Call Option
Put Option
Call Option
A call option gives the buyer the right to buy an asset at a fixed price (called the strike price) before expiration.
Example:
Stock price: $100
Call option strike price: $105
Expiration: 1 month
If the stock rises to $120, the call option becomes valuable because the buyer can purchase at $105 and potentially sell at $120.
If the stock stays below $105, the option may expire worthless.
Put Option
A put option gives the buyer the right to sell an asset at a fixed price before expiration.
Example:
Stock price: $100
Put strike price: $95
If the stock falls to $70, the put increases in value because the holder can sell at $95 instead of the market price of $70.
If the stock stays above $95, the option may expire worthless.
Key Components of an Option
1. Strike Price
The predetermined price at which the asset can be bought or sold.
2. Expiration Date
The date on which the option contract expires.
3. Premium
The price paid to buy the option. This is the maximum loss for the buyer.
4. Intrinsic Value
The real value if exercised immediately.
5. Time Value
The extra value based on time remaining before expiration.
Option Buyers vs Option Sellers
Option Buyer (Holder)
Pays the premium
Has limited risk (loss = premium paid)
Has unlimited profit potential (for calls)
Option Seller (Writer)
Receives the premium
Has limited profit (premium received)
May face large or unlimited losses
Selling options can be riskier than buying them.
In-the-Money, At-the-Money, Out-of-the-Money
In-the-Money (ITM)
Call: Stock price > Strike price
Put: Stock price < Strike price
At-the-Money (ATM)
Stock price = Strike price
Out-of-the-Money (OTM)
Call: Stock price < Strike price
Put: Stock price > Strike price
Leverage in Options Trading
Options provide leverage because traders control large positions with smaller investments.
Example:
Buying 100 shares at $100 = $10,000 investment
Buying one call option might cost $300
If the stock rises significantly, the percentage return on the option can be much higher than owning the stock directly.
However, if the stock does not move as expected, the option can expire worthless.
Risks in Derivatives and Options Trading
While derivatives provide opportunities, they also involve risks:
1. Market Risk
Price movements can lead to losses.
2. Time Decay (Theta)
Options lose value as expiration approaches.
3. Volatility Risk
Changes in volatility affect option prices.
4. Leverage Risk
Losses can be magnified.
5. Liquidity Risk
Some contracts may be difficult to buy or sell.
Option Pricing Basics
Option prices are influenced by:
Current stock price
Strike price
Time until expiration
Volatility
Interest rates
The Black-Scholes model is commonly used to estimate theoretical option prices.
Popular Options Strategies
Traders use different strategies depending on their outlook.
1. Covered Call
Holding a stock and selling a call against it to earn income.
2. Protective Put
Buying a put to protect a stock position.
3. Straddle
Buying both a call and a put at the same strike price to profit from large moves in either direction.
4. Spread Strategies
Combining multiple options to reduce risk.
Futures vs Options
Feature Futures Options
Obligation Both parties obligated Buyer has right, not obligation
Risk Can be unlimited Buyer risk limited to premium
Upfront Cost Margin required Premium paid
Complexity Moderate More complex
Exchange-Traded vs OTC Derivatives
Exchange-Traded Derivatives
Standardized contracts
Regulated exchanges
Lower counterparty risk
Over-the-Counter (OTC)
Customized contracts
Private agreements
Higher counterparty risk
Importance in Financial Markets
Derivatives increase:
Market efficiency
Price discovery
Liquidity
Risk management capabilities
However, misuse or excessive speculation can cause instability, as seen during the 2008 financial crisis involving complex derivatives like credit default swaps.
Who Uses Derivatives?
Individual traders
Hedge funds
Banks
Corporations
Institutional investors
For example, airlines hedge fuel costs using oil futures, and multinational companies hedge currency risk using forex derivatives.
Conclusion
Derivatives and options trading are powerful financial tools that allow market participants to hedge risk, speculate on price movements, and enhance portfolio returns. Options, in particular, offer flexibility because they provide the right—but not the obligation—to buy or sell an asset at a fixed price.
However, these instruments involve complexity and significant risk, especially due to leverage and time decay. Successful derivatives trading requires strong knowledge, risk management, and disciplined strategy.
In summary, derivatives and options are essential parts of global financial markets. When used wisely, they can reduce risk and create opportunities. When misused, they can lead to substantial financial losses. Understanding their structure, purpose, and risks is the foundation for participating safely and effectively in derivatives markets.
Wave Analysis

Part 2 Intraday Institutional TradingHow Beginners Should Start?
✔ Step-by-Step:
Start with understanding futures & spot movement
Trade small lots
Focus on ATM & ITM
Avoid expiry day
Avoid illiquid stocks
Study Greeks
Backtest simple strategies
Track OI & volume data
Start with debit spreads instead of naked options
Never sell naked options without hedge

Part 1 Intraday Institutional Trading How Option Premium Is Calculated
Premium = Intrinsic Value + Time Value + Volatility Value
1. Intrinsic Value (IV)
Actual value based on difference between spot and strike.
2. Time Value
More days to expiry → higher premium
Closer to expiry → premium decays (Theta)
3. Volatility (Implied Volatility – IV)
Higher volatility = higher premium
Low volatility = low premium

Part 4 Institutional Trading VS. Technical AnalysisOption Buyers vs. Option Sellers
The option market has two sides:
✔ 1) Option Buyer
Pays premium
Holds the right (to buy/sell)
Profit potential → unlimited
Loss → limited to premium paid
Needs movement in price and volatility
✔ 2) Option Seller (Writer)
Receives premium
Takes obligation
Limited profit → only premium
Loss → theoretically unlimited
Needs the market to stay stable or move opposite to buyer
Sellers usually have higher probability of winning but high risk exposure.

Part 1 Institutional Trading VS. Technical Analysis Option Trading Profits
Call Option Profit
- Buyer: Profit if underlying price > strike price + premium paid.
- Seller: Profit is the premium received (if option expires worthless).
Put Option Profit- Buyer: Profit if underlying price < strike price - premium paid.
- Seller: Profit is the premium received (if option expires worthless).
Profit Factors- Price Movement: Direction and magnitude.
- Volatility: Impacts option value.
- Time Decay: Options lose value over time.

Energy Transition & Green CommoditiesIntroduction
The global energy transition refers to the long-term structural shift from fossil fuel–based energy systems—coal, oil, and natural gas—toward low-carbon, renewable, and sustainable energy sources. This transformation is driven by the urgent need to mitigate climate change, reduce greenhouse gas emissions, enhance energy security, and promote sustainable economic development. At the heart of this transition lies a growing demand for green commodities—raw materials and resources essential for renewable energy technologies, electrification, energy storage, and decarbonized infrastructure.
The energy transition is not simply a technological change; it is an economic, geopolitical, and industrial revolution. Green commodities such as lithium, copper, nickel, cobalt, rare earth elements, and green hydrogen are becoming as strategically important in the 21st century as oil was in the 20th.
Understanding the Energy Transition
1. Why the Energy Transition Is Necessary
The traditional energy system has been heavily dependent on fossil fuels, which account for the majority of global carbon dioxide emissions. The consequences include:
Rising global temperatures
Extreme weather events
Sea-level rise
Biodiversity loss
Air pollution and public health crises
International agreements such as the Paris Agreement aim to limit global warming to well below 2°C, ideally 1.5°C above pre-industrial levels. Achieving this goal requires reaching net-zero emissions by mid-century, which in turn demands a fundamental restructuring of energy production, consumption, and infrastructure.
2. Key Pillars of the Energy Transition
The energy transition involves several interconnected shifts:
a) Renewable Energy Expansion
Solar, wind, hydro, and geothermal energy are replacing fossil fuel–based power generation. Solar photovoltaic and wind power have seen dramatic cost reductions and rapid deployment globally.
b) Electrification
Transportation, heating, and industrial processes are increasingly electrified. Electric vehicles (EVs), heat pumps, and electric industrial furnaces reduce reliance on fossil fuels.
c) Energy Storage
Battery storage systems and grid-scale storage solutions ensure reliability and stability of renewable energy, which is inherently intermittent.
d) Energy Efficiency
Improving building insulation, industrial efficiency, and smart grid systems reduces overall energy demand.
e) Green Hydrogen
Hydrogen produced using renewable electricity (via electrolysis) is emerging as a solution for hard-to-abate sectors such as steel, cement, aviation, and shipping.
What Are Green Commodities?
Green commodities are raw materials and resources critical for low-carbon technologies, renewable energy systems, and sustainable infrastructure. Unlike fossil fuels, which are burned for energy, green commodities are used primarily as inputs in manufacturing clean technologies.
They can be broadly classified into:
Battery minerals
Electrification metals
Rare earth elements
Low-carbon fuels
Sustainably sourced agricultural and forestry products
Key Green Commodities
1. Lithium
Lithium is essential for lithium-ion batteries used in electric vehicles, smartphones, and grid storage systems. As EV adoption accelerates globally, lithium demand has surged dramatically. Major producers include Australia, Chile, Argentina, and China.
Lithium is a cornerstone of energy storage, enabling renewable integration and transportation electrification.
2. Copper
Copper is critical for electrification because of its high electrical conductivity. It is used in:
Wind turbines
Solar panels
EV motors
Transmission lines
Charging infrastructure
An electric vehicle requires significantly more copper than a conventional internal combustion engine vehicle. Expanding power grids and renewable systems are driving unprecedented copper demand.
3. Nickel and Cobalt
Nickel improves battery energy density, allowing longer driving ranges for EVs. Cobalt enhances battery stability and safety. While essential, cobalt mining has raised ethical concerns, particularly regarding labor practices in certain producing regions. This has led to research into cobalt-free battery chemistries.
4. Rare Earth Elements (REEs)
Rare earth elements such as neodymium, praseodymium, and dysprosium are used in permanent magnets for wind turbines and electric motors. These materials are critical for high-efficiency renewable technologies.
The supply chain for rare earths is geographically concentrated, creating strategic vulnerabilities.
5. Green Hydrogen
Green hydrogen is produced by splitting water using renewable electricity. It is emerging as a green commodity in itself, capable of being traded internationally like liquefied natural gas (LNG). Countries with abundant renewable resources may become future hydrogen exporters.
6. Sustainable Biomass and Carbon Credits
Sustainably managed forests, biofuels, and carbon markets are also part of green commodity markets. Carbon credits represent verified reductions in emissions and are increasingly traded globally.
Economic Implications of Green Commodities
1. Commodity Supercycle?
Some analysts suggest the energy transition could trigger a new commodity supercycle due to massive infrastructure requirements. Building renewable energy systems requires far more mineral inputs than fossil fuel systems.
For example:
Wind and solar plants require multiple times more minerals per megawatt than gas-fired plants.
EV production requires several times more mineral inputs than traditional cars.
This structural demand shift may support long-term price strength in green commodities.
2. Investment and Capital Flows
Trillions of dollars in investment are required to achieve global climate targets. Financial markets are increasingly allocating capital toward:
ESG (Environmental, Social, Governance) funds
Green bonds
Renewable infrastructure projects
Sustainable mining operations
Mining companies are repositioning themselves as “future-facing” suppliers of green materials.
3. Supply Chain Risks
Green commodity supply chains are often geographically concentrated. For instance:
Lithium production is dominated by a few countries.
Rare earth processing is heavily centralized.
Cobalt supply is concentrated in limited regions.
This concentration creates geopolitical risks and encourages countries to diversify supply chains, invest in recycling, and develop domestic production capabilities.
Environmental and Social Challenges
While green commodities enable decarbonization, their extraction is not impact-free.
1. Mining Impacts
Mining operations can cause:
Water scarcity
Land degradation
Biodiversity loss
Community displacement
Sustainable mining practices, improved regulation, and technological innovation are essential to minimize environmental harm.
2. Ethical Concerns
Labor rights, community consent, and equitable benefit-sharing are crucial issues in green commodity production. Responsible sourcing and transparency initiatives are becoming increasingly important.
3. Recycling and Circular Economy
Recycling batteries and electronic waste can reduce dependence on primary mining. A circular economy approach—recovering materials from used products—will be essential to meet long-term demand sustainably.
Geopolitical Shifts
The energy transition is reshaping global geopolitics.
Oil-exporting countries may face declining demand over time.
Mineral-rich nations may gain strategic importance.
Technological leadership in clean energy manufacturing becomes a source of economic power.
Energy security is evolving from securing oil supply routes to securing mineral supply chains and manufacturing capacity.
Future Outlook
The pace of the energy transition depends on:
Government policies
Carbon pricing mechanisms
Technological breakthroughs
Investment levels
Public support
Green commodities will remain central to this transformation. However, innovation may reduce reliance on certain materials through alternative chemistries, improved efficiency, and recycling technologies.
The long-term success of the energy transition will require balancing three objectives:
Decarbonization
Energy security
Sustainable development
Conclusion
The energy transition represents one of the most significant economic and industrial transformations in modern history. Moving from fossil fuels to renewable energy systems requires massive deployment of new infrastructure and technologies, all of which depend on green commodities.
Lithium, copper, nickel, cobalt, rare earth elements, and green hydrogen are becoming strategic resources of the low-carbon era. Their availability, responsible extraction, and sustainable management will determine the speed and equity of the transition.
While green commodities offer enormous opportunities for economic growth and climate mitigation, they also present environmental, ethical, and geopolitical challenges. A successful energy transition will depend not only on technological innovation but also on responsible governance, international cooperation, and sustainable resource management.

Precious metals (Gold, Silver, Platinum)1. GOLD (Au)
1. Basic Information
Chemical symbol: Au (from Latin Aurum).
Atomic number: 79.
Bright yellow, dense, soft metal.
One of the least reactive chemical elements.
Found in pure (native) form in nature.
2. Physical Properties
Highly malleable (can be hammered into thin sheets).
Highly ductile (can be drawn into thin wires).
Excellent conductor of electricity.
Does not tarnish or rust.
Very dense (19.3 g/cm³).
Melting point: 1064°C.
Boiling point: 2856°C.
3. Chemical Properties
Resistant to corrosion and oxidation.
Does not react with oxygen under normal conditions.
Dissolves in aqua regia (mixture of nitric and hydrochloric acid).
Forms alloys easily with other metals.
4. Uses of Gold
Jewelry and ornaments.
Investment (coins, bars, bullion).
Central bank reserves.
Electronics (connectors, circuit boards).
Dentistry (crowns, fillings).
Aerospace components.
Medical applications (certain treatments).
Awards and medals.
5. Economic Importance
Considered a safe-haven asset.
Used as hedge against inflation.
Historically used as currency.
Affects global financial markets.
Traded on commodity exchanges.
6. Sources and Mining
Mined in countries like China, Australia, Russia.
Extracted from underground mines.
Also recovered from river sediments (placer mining).
Recycled from old jewelry and electronics.
7. Advantages
Long-lasting value.
High liquidity.
Portable wealth storage.
Universal acceptance.
8. Disadvantages
Expensive.
Mining causes environmental damage.
Price volatility.
2. SILVER (Ag)
1. Basic Information
Chemical symbol: Ag (from Latin Argentum).
Atomic number: 47.
Shiny white metallic element.
More abundant than gold.
Highly reflective metal.
2. Physical Properties
Best electrical conductor among metals.
Best thermal conductor.
Highly malleable and ductile.
Density: 10.49 g/cm³.
Melting point: 961.8°C.
Boiling point: 2162°C.
3. Chemical Properties
Reacts with sulfur compounds (tarnishes).
Forms silver sulfide when exposed to air.
Dissolves in nitric acid.
Forms alloys with copper.
4. Uses of Silver
Jewelry and silverware.
Coins and investment bars.
Electronics and electrical contacts.
Solar panels.
Photography (silver nitrate).
Mirrors and coatings.
Medical instruments.
Antibacterial applications.
Batteries.
Catalysts in chemical reactions.
5. Industrial Importance
Widely used in renewable energy.
Important in semiconductor industry.
Used in 5G technology components.
Increasing demand in electric vehicles.
6. Sources and Mining
Major producers: Mexico, Peru, China.
Often mined as by-product of copper, lead, zinc mining.
Extracted through underground and open-pit mining.
7. Advantages
More affordable than gold.
High industrial demand.
Good investment diversification.
Excellent conductivity.
8. Disadvantages
Tarnishes easily.
More price volatility.
Storage bulkier than gold (lower value density).
3. PLATINUM (Pt)
1. Basic Information
Chemical symbol: Pt.
Atomic number: 78.
Silvery-white metal.
Rarer than gold.
Extremely dense and durable.
2. Physical Properties
Density: 21.45 g/cm³.
Very high melting point (1768°C).
Strong and corrosion-resistant.
Malleable and ductile.
Good conductor of electricity.
Highly stable at high temperatures.
3. Chemical Properties
Resistant to oxidation.
Does not corrode easily.
Acts as excellent catalyst.
Dissolves in aqua regia.
Forms alloys with other metals.
4. Uses of Platinum
Catalytic converters in vehicles.
Jewelry (premium category).
Laboratory equipment.
Medical devices.
Cancer treatment drugs (cisplatin).
Petroleum refining.
Fuel cells.
Chemical industry catalysts.
Investment coins and bars.
5. Industrial Importance
Essential for reducing vehicle emissions.
Important in hydrogen fuel technology.
Used in glass manufacturing.
Critical in clean energy transition.
6. Sources and Mining
Major producers: South Africa, Russia.
Extracted from deep underground mines.
Mining process is complex and costly.
Limited global supply.
7. Advantages
Very durable.
High industrial value.
Rare and prestigious.
Hypoallergenic (good for sensitive skin).
8. Disadvantages
Expensive mining cost.
Industrial demand affects price.
Less liquid market compared to gold.
Price fluctuations linked to automotive industry.
4. COMPARISON OF GOLD, SILVER, AND PLATINUM
Gold is mainly a monetary metal.
Silver is both monetary and industrial.
Platinum is primarily industrial.
Platinum is rarer than gold.
Silver is more abundant.
Platinum has highest density.
Silver has best electrical conductivity.
Gold is most corrosion-resistant.
Platinum has highest melting point.
Silver is most affordable.
Gold is most stable investment.
Platinum demand depends on automobile industry.
Silver demand depends on industrial growth.
Gold demand depends on economic stability.
All three are traded globally.
All are considered precious metals.
Used in jewelry worldwide.
All have high resale value.
Stored as wealth for centuries.
Important in global economy.
5. ROLE IN INVESTMENT
Hedge against inflation.
Portfolio diversification.
Protection during economic crisis.
Tangible asset.
Can be held physically.
Also traded as ETFs.
Futures contracts available.
Used in retirement portfolios.
Global demand influences price.
Supply constraints affect market value.
6. ENVIRONMENTAL AND SOCIAL IMPACT
Mining can cause deforestation.
Water pollution from mining chemicals.
Energy-intensive extraction processes.
Labor issues in mining regions.
Recycling reduces environmental harm.
Sustainable mining practices increasing.
Ethical sourcing becoming important.
Government regulations applied.
Environmental rehabilitation required.
Shift toward greener extraction methods.
7. CONCLUSION
Gold represents stability and wealth.
Silver represents industrial growth and affordability.
Platinum represents rarity and advanced technology.
All three metals play crucial roles in economy.
They are essential in modern industries.
They serve as investment tools.
Their value depends on supply and demand.
They have historical importance.
They remain relevant in modern financial systems.
Precious metals continue to shape global markets.

Equity Market Trading 1. Meaning and Importance of Equity Markets
An equity market is a marketplace where shares of publicly listed companies are issued and traded. These markets connect companies that need capital with investors who have funds to invest. Companies raise money by issuing shares through an Initial Public Offering (IPO) in the primary market. After issuance, shares are traded among investors in the secondary market, such as the New York Stock Exchange (NYSE), Nasdaq, London Stock Exchange (LSE), or Bombay Stock Exchange (BSE).
Equity markets are essential because they:
Help companies raise long-term capital for expansion and innovation.
Provide liquidity to investors.
Facilitate price discovery based on supply and demand.
Encourage economic growth by supporting businesses.
2. Types of Equity Markets
Equity trading takes place in two main markets:
Primary Market:
In this market, companies issue new shares to investors for the first time through IPOs or follow-on public offerings. Investors buy shares directly from the company.
Secondary Market:
Here, previously issued shares are traded among investors. The company does not receive money from these transactions. Stock exchanges regulate and facilitate these trades.
3. Participants in Equity Market Trading
Several participants are involved in equity trading:
Retail Investors: Individual investors who buy and sell shares for personal investment.
Institutional Investors: Large entities such as mutual funds, pension funds, insurance companies, and hedge funds.
Brokers: Licensed intermediaries who execute trades on behalf of investors.
Market Makers: Firms that provide liquidity by continuously buying and selling stocks.
Regulators: Government agencies like the SEC (U.S.) or SEBI (India) that oversee market activities to ensure fairness and transparency.
Each participant plays a crucial role in maintaining market efficiency and stability.
4. How Equity Trading Works
Equity trading typically occurs electronically through stock exchanges. Investors place buy or sell orders through brokers using trading platforms. Orders are matched through an automated system based on price and time priority.
There are different types of orders:
Market Order: Executes immediately at the current market price.
Limit Order: Executes only at a specified price or better.
Stop-Loss Order: Automatically sells a stock when it reaches a certain price to limit losses.
Stop-Limit Order: Combines features of stop and limit orders.
Once a trade is executed, settlement usually occurs within two business days (T+2 settlement cycle in many markets).
5. Types of Equity Trading Strategies
Equity trading can be short-term or long-term depending on the investor’s objectives.
a) Long-Term Investing:
Investors buy shares and hold them for years to benefit from company growth and dividends. This strategy relies on fundamental analysis.
b) Day Trading:
Traders buy and sell shares within the same day to profit from short-term price movements.
c) Swing Trading:
Positions are held for several days or weeks to capture price trends.
d) Scalping:
Traders make multiple small profits from minor price changes within minutes.
e) Value Investing:
Investors buy undervalued stocks based on financial analysis.
f) Growth Investing:
Focuses on companies expected to grow faster than the overall market.
6. Fundamental and Technical Analysis
Equity traders use two main types of analysis:
Fundamental Analysis:
This involves evaluating a company’s financial statements, earnings, revenue, management, competitive position, and economic factors. Key indicators include:
Earnings Per Share (EPS)
Price-to-Earnings (P/E) ratio
Return on Equity (ROE)
Debt-to-Equity ratio
Fundamental analysis aims to determine the intrinsic value of a stock.
Technical Analysis:
This method studies past price movements and trading volume using charts and indicators. Tools include:
Moving Averages
Relative Strength Index (RSI)
MACD (Moving Average Convergence Divergence)
Candlestick patterns
Technical analysis helps traders predict short-term price movements.
7. Risks in Equity Market Trading
Equity trading offers high returns but also carries significant risks:
Market Risk: Prices fluctuate due to economic and political events.
Company Risk: Poor performance or management decisions can reduce stock value.
Liquidity Risk: Some stocks may be difficult to buy or sell quickly.
Volatility Risk: Sudden price changes can cause losses.
Emotional Risk: Fear and greed often lead to irrational decisions.
Proper risk management techniques include diversification, stop-loss orders, and position sizing.
8. Benefits of Equity Market Trading
Despite risks, equity markets offer many advantages:
Potential for high returns compared to fixed-income investments.
Dividend income.
Liquidity and flexibility.
Ownership participation in business growth.
Inflation protection over the long term.
Historically, equities have outperformed many other asset classes over extended periods.
9. Role of Technology in Equity Trading
Modern equity trading is largely driven by technology. Online trading platforms allow investors to trade instantly from anywhere. Algorithmic trading and high-frequency trading (HFT) use computer programs to execute trades at high speeds. Artificial intelligence and big data analytics are increasingly used to analyze market trends and investor behavior.
Mobile trading apps have also increased retail participation globally.
10. Regulation and Ethical Practices
Equity markets are regulated to prevent fraud, insider trading, and market manipulation. Regulatory bodies ensure companies disclose accurate financial information and maintain transparency. Ethical trading practices help maintain investor confidence and market stability.
Conclusion
Equity market trading is a fundamental component of the global financial system. It allows companies to raise capital and investors to grow wealth through ownership in businesses. While it offers opportunities for significant returns, it also involves risks that require careful analysis and disciplined decision-making. Successful equity trading depends on knowledge, strategy, risk management, and emotional control. As technology continues to evolve, equity markets are becoming more accessible, efficient, and dynamic, making them an essential avenue for both individual and institutional investors worldwide.

Part 4 Institutional Option Trading VS. Technical Analysis⭐Components of an Option Contract
Strike Price — the fixed price mentioned in the contract.
Premium — price you pay to buy the option.
Expiry Date — weekly/monthly expiry.
Underlying Asset — Nifty, Bank Nifty, stock, etc.
Option Type — Call (CE) or Put (PE).
Lot Size — options are traded in lots (example: Nifty = 50 units).
American vs European — India uses European, meaning exercised only at expiry.
Moneyness — whether option is ITM, ATM, or OTM.

Emerging Market Currencies Trading: An In-Depth OverviewIntroduction to Emerging Markets
Emerging markets (EMs) refer to economies that are in a transitional phase between developing and developed status. They typically exhibit rapid economic growth, industrialization, and improvements in financial markets. Examples of prominent emerging markets include India, Brazil, Indonesia, Mexico, Russia, Turkey, and South Africa. These economies attract global investors due to higher growth potential compared to developed markets but come with higher risks, such as political instability, inflation, and currency volatility.
In global finance, currencies of emerging markets are collectively referred to as emerging market currencies (EMCs). Unlike the relatively stable currencies of developed nations such as the U.S. dollar, euro, or Japanese yen, EMCs are known for higher volatility and sensitivity to external shocks. This makes trading them both risky and potentially profitable.
Key Emerging Market Currencies
Some of the most traded emerging market currencies include:
Indian Rupee (INR) – Driven by India’s strong economic growth, IT exports, and foreign investment inflows.
Brazilian Real (BRL) – Highly commodity-dependent, affected by global oil and agricultural prices.
Russian Ruble (RUB) – Linked to energy exports; sensitive to geopolitical events and sanctions.
Indonesian Rupiah (IDR) – Influenced by regional trade and foreign direct investment.
South African Rand (ZAR) – Often considered a proxy for global risk appetite, as South Africa is rich in gold and other commodities.
Turkish Lira (TRY) – Highly volatile, affected by domestic politics, inflation, and interest rate policies.
These currencies are frequently traded against the U.S. dollar (USD), as the dollar serves as the global reserve currency and benchmark for international trade. Common trading pairs include USD/BRL, USD/INR, USD/TRY, and USD/ZAR.
Factors Driving Emerging Market Currency Movements
Emerging market currencies are influenced by a combination of domestic economic policies, global financial trends, and investor sentiment. Key factors include:
Interest Rate Differentials
Higher interest rates in an emerging market attract foreign capital, strengthening its currency. Conversely, if U.S. or European rates rise, investors may withdraw funds from EMs, causing depreciation.
Inflation and Monetary Policy
Persistent inflation weakens the purchasing power of an EMC. Central banks in EMs often adjust policy rates to stabilize the currency and attract foreign investment.
Political Stability and Governance
Political uncertainty or poor governance can trigger sudden capital outflows. For example, unexpected elections or policy changes can cause sharp declines in currency value.
Commodity Prices
Many emerging economies are commodity exporters. For instance, the Russian ruble is tied to oil prices, while the South African rand is influenced by gold and platinum. Commodity price fluctuations directly affect trade balances and currency strength.
Global Risk Sentiment
EMCs are often seen as risk assets. During global economic uncertainty, investors shift funds to “safe-haven” currencies like the USD, JPY, or CHF. This often leads to sharp depreciation in EMCs.
External Debt and Capital Flows
Countries with high external debt in foreign currencies are vulnerable to currency depreciation. Conversely, strong foreign direct investment inflows can support a currency.
Trading Emerging Market Currencies
Trading emerging market currencies can be approached through several methods:
Spot Forex Market
The most direct method, where traders buy or sell EMCs against another currency, usually USD. This market operates 24 hours, five days a week, offering high liquidity but also high volatility.
Forward and Futures Contracts
Traders use forwards and futures to hedge or speculate on future currency movements. For example, an Indian exporter may use USD/INR forwards to lock in a favorable rate for a future payment.
Currency ETFs and ETNs
Exchange-traded funds (ETFs) and exchange-traded notes (ETNs) provide exposure to EMCs without directly trading forex. For instance, ETFs tracking the Brazilian real or Indian rupee allow investors to participate in currency movements.
Options and Derivatives
Options provide flexibility for hedging or speculative trades. They allow traders to benefit from large swings in EMCs while limiting risk.
Carry Trade Strategy
A popular strategy in EMC trading involves borrowing in a low-interest-rate currency and investing in a high-interest-rate EMC. While potentially profitable, this strategy is highly sensitive to currency volatility.
Risks in Emerging Market Currency Trading
Trading EMCs carries higher risk than trading major currencies. Key risks include:
Volatility Risk
EMCs can experience daily swings of 2–5% or more, compared to 0.5–1% for major currencies.
Liquidity Risk
Some EMCs have limited liquidity, making large trades costly or causing slippage.
Political and Regulatory Risk
Sudden capital controls, government interventions, or political instability can impact currency value drastically.
Global Market Risk
A global recession, U.S. dollar strength, or geopolitical crisis can trigger massive sell-offs in EMCs.
Interest Rate and Inflation Risk
Unexpected changes in monetary policy or inflation can erode currency value rapidly.
Counterparty Risk
In derivative contracts or currency swaps, the risk that the counterparty may default is higher in emerging markets compared to developed markets.
Strategies for Trading Emerging Market Currencies
Successful EMC trading often requires a combination of technical, fundamental, and macroeconomic analysis:
Fundamental Analysis
Traders monitor GDP growth, inflation rates, interest rates, fiscal policies, and geopolitical events to forecast currency movements.
Technical Analysis
Price charts, trend lines, support/resistance levels, and momentum indicators help identify entry and exit points in volatile markets.
Diversification
Spreading trades across multiple EMCs or combining EMCs with major currencies reduces exposure to individual currency shocks.
Hedging
Businesses dealing with international trade can hedge currency risk using forwards, futures, or options.
News and Event Trading
EMCs are sensitive to news like central bank announcements, elections, trade agreements, or commodity price changes. Traders often use these events for short-term trading opportunities.
Risk Management
Stop-loss orders, position sizing, and careful leverage management are critical in managing the high volatility inherent in EMCs.
Global Trends Influencing EMC Trading
U.S. Dollar Dominance
Since most EMCs are quoted against the USD, fluctuations in dollar strength directly affect EM currencies. A stronger dollar often leads to EM currency depreciation.
China’s Role
As a major trading partner for many EMs, China’s economic performance, trade policies, and currency movements impact EM currencies significantly.
Technological Advancements
Improved trading platforms, high-frequency trading, and AI-based forecasting have increased participation in EMC markets globally.
Emergence of Digital Currencies
Some EMs are exploring central bank digital currencies (CBDCs), which could change how currency trading is conducted in the future.
Shift in Global Capital Flows
Institutional investors increasingly diversify into EM currencies for higher yields, while retail traders gain exposure via ETFs and online brokers.
Conclusion
Emerging market currency trading offers high-reward opportunities but comes with significant risks. Understanding macroeconomic fundamentals, global financial trends, and local political and economic conditions is essential for traders and investors. While volatility is high, disciplined strategies, risk management, and diversification can help traders capitalize on opportunities in these dynamic and fast-evolving markets.
Emerging market currencies serve as a bridge between global investors seeking growth and EM economies seeking foreign capital. They remain a critical component of global forex markets, reflecting both the promise and perils of economic development.

Part 1 Institutional Option Trading VS. Technical Analysis ⭐ 1. What Are Options?
Options are contracts, not shares.
They give you a right, not an obligation, to buy or sell something.
That “something” is usually a stock, index, commodity, or currency.
Options have an expiry date — they lose value as time passes.
Options are part of a bigger market called derivatives.
They derive their value from the underlying asset (like Nifty, Bank Nifty, stocks).
An option is like a reservation — you pay a small price to control a large position.
This small price is called premium.
Because premium is small, options give leverage — small money, big impact.
Options can be used to hedge, speculate, or generate income.

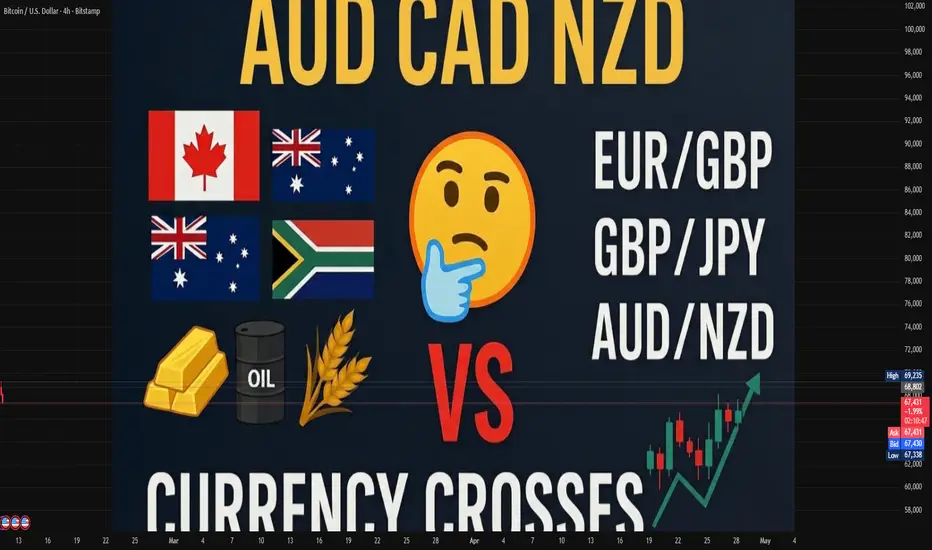
Commodity Currencies (AUD, CAD, NZD)Commodity Currencies Overview
Commodity currencies are national currencies of countries that rely heavily on the export of natural resources or commodities. These currencies are sensitive to global commodity prices because their economies are closely tied to the demand and supply of commodities such as metals, energy products, and agricultural goods. Among the most prominent commodity currencies in the world are the Australian Dollar (AUD), Canadian Dollar (CAD), and New Zealand Dollar (NZD). Each of these currencies reflects the underlying economic health and export performance of their respective nations.
1. Australian Dollar (AUD)
Economic Background:
Australia is rich in natural resources, including iron ore, coal, natural gas, and gold. The Australian economy is heavily reliant on the export of these commodities, particularly to Asian markets like China, Japan, and South Korea. Roughly 60–70% of Australia’s total exports are commodities, making the AUD highly sensitive to global commodity prices.
Relationship with Commodity Prices:
Iron Ore: Australia is the world’s largest exporter of iron ore, and changes in iron ore prices strongly affect the AUD. Rising demand from industrial powerhouses like China often strengthens the AUD.
Coal and Natural Gas: Australia is a leading exporter of thermal and metallurgical coal, as well as liquefied natural gas (LNG). Increases in global energy prices often lead to appreciation of the AUD.
Monetary Policy and Interest Rates:
The Reserve Bank of Australia (RBA) plays a critical role in influencing AUD value. Historically, the AUD has been considered a “high-yielding” currency because Australia has often maintained interest rates above other developed nations. Traders often engage in carry trades using the AUD, borrowing in low-interest currencies like JPY to invest in AUD for higher returns.
Trading Characteristics:
The AUD is highly liquid and traded against major currencies such as USD (AUD/USD), JPY (AUD/JPY), and EUR (AUD/EUR).
It is often considered a risk-on currency, meaning it appreciates when global risk sentiment is positive and depreciates in risk-off scenarios.
Market Influences:
Global Growth: Strong global economic activity increases demand for Australian exports, supporting AUD.
China’s Economy: Since China is Australia’s largest trading partner, Chinese GDP growth, industrial production, and infrastructure spending heavily influence AUD movements.
Commodity Prices: Fluctuations in iron ore, coal, and gold prices can trigger significant AUD volatility.
2. Canadian Dollar (CAD)
Economic Background:
Canada’s economy is resource-rich, with significant production of crude oil, natural gas, lumber, and metals. Oil exports, in particular, dominate Canada’s trade, making the CAD closely correlated with crude oil prices. Canada is one of the top global producers of crude oil, mainly from Alberta’s oil sands.
Relationship with Commodity Prices:
Oil: Approximately 40% of Canada’s total exports are energy products. The CAD is often referred to as a “petro-currency” because oil price movements have a direct effect on its value. Rising oil prices strengthen the CAD, while falling prices weaken it.
Natural Resources: Lumber, natural gas, and metals also contribute to CAD volatility, though oil remains the dominant factor.
Monetary Policy and Interest Rates:
The Bank of Canada (BoC) manages the nation’s monetary policy, influencing CAD through interest rate decisions. Similar to the AUD, the CAD has historically offered relatively higher interest rates compared to some developed economies, making it attractive for carry trades.
Trading Characteristics:
The CAD is highly liquid and traded against the USD (USD/CAD), EUR, and JPY.
USD/CAD is particularly sensitive to both oil price fluctuations and U.S. economic performance, as the U.S. is Canada’s largest trading partner.
CAD also responds to global risk sentiment but less strongly than the AUD, given its more defensive economic ties to energy markets.
Market Influences:
Oil Prices: A surge in crude oil prices tends to boost the CAD, as higher energy revenues improve Canada’s trade balance.
Global Risk Appetite: Risk-on environments moderately strengthen CAD, while risk-off events may weaken it.
U.S. Economy: Given the close trade relationship, strong U.S. growth can positively affect CAD.
3. New Zealand Dollar (NZD)
Economic Background:
New Zealand’s economy is smaller than Australia’s and Canada’s but highly dependent on commodity exports. Agricultural products—such as dairy, meat, wool, and fruit—form the backbone of its export sector. Approximately 50–60% of New Zealand’s exports are commodities, making the NZD sensitive to global agricultural demand.
Relationship with Commodity Prices:
Dairy Prices: Dairy products are the largest export category, especially to Asian markets. Global milk and dairy prices influence NZD significantly.
Meat and Forestry Products: Meat and wood product exports also impact the currency, though to a lesser degree than dairy.
Monetary Policy and Interest Rates:
The Reserve Bank of New Zealand (RBNZ) regulates interest rates, which historically have been relatively high compared to other developed nations. This has made the NZD a preferred currency for carry trades.
Trading Characteristics:
The NZD is traded primarily against the USD (NZD/USD), AUD (NZD/AUD), and JPY (NZD/JPY).
It behaves as a risk-on currency, often moving in tandem with global investor sentiment.
The NZD has high volatility relative to other major currencies, reflecting its dependence on agricultural commodity markets.
Market Influences:
Global Dairy Demand: Changes in Chinese and Asian demand for dairy exports strongly influence the NZD.
Commodity Prices: Milk, meat, and forestry prices can drive short-term NZD fluctuations.
Risk Sentiment: Like the AUD, NZD tends to appreciate during periods of global economic optimism.
Shared Characteristics of Commodity Currencies
Commodity Correlation:
All three currencies are closely linked to global commodity markets. AUD is linked to metals and energy, CAD to crude oil, and NZD to agricultural products.
Risk Sensitivity:
They are considered risk-on currencies, appreciating when global markets are bullish and depreciating during risk-off periods.
Interest Rate Differentials:
These currencies often offer higher interest rates relative to low-yielding currencies such as JPY or CHF, making them attractive in carry trades.
Export Dependency:
Their economies are export-driven, and changes in demand from major trading partners directly affect currency value.
Volatility:
Commodity currencies exhibit higher volatility than non-commodity currencies because commodity prices themselves are highly volatile, influenced by global supply-demand shifts, geopolitical events, and economic cycles.
Trading Strategies for Commodity Currencies
Commodity-Based Trading:
Traders often correlate currency movements with relevant commodity prices. For instance, rising oil prices could signal CAD strength.
Risk Sentiment Trading:
Since AUD and NZD are risk-on currencies, traders monitor global market risk appetite to anticipate currency moves.
Interest Rate and Carry Trades:
These currencies are favored in carry trades where investors borrow low-yielding currencies like JPY to invest in higher-yielding currencies such as AUD or NZD.
Fundamental Analysis:
Monitoring trade balances, GDP growth, and economic data releases from Australia, Canada, and New Zealand is essential for predicting currency strength.
Technical Analysis:
Due to their volatility, technical indicators like moving averages, support/resistance levels, and trend analysis are widely used in short- and medium-term trading.
Conclusion
The AUD, CAD, and NZD are quintessential examples of commodity currencies, with their values intrinsically tied to the performance of key export commodities and global economic trends. While the AUD and NZD are sensitive to metals, energy, and agricultural products and exhibit risk-on behavior, the CAD is strongly influenced by crude oil prices and trade relations with the U.S.
Investors and traders closely monitor commodity price movements, global economic growth, and central bank policies when trading these currencies. Their higher interest rates and sensitivity to risk sentiment make them attractive in both fundamental and technical trading strategies, but also inherently more volatile than non-commodity currencies like the USD or EUR.
Understanding these dynamics is crucial for anyone looking to trade, hedge, or invest in commodity currencies, as their fortunes rise and fall with the ebb and flow of global commodities and investor sentiment.
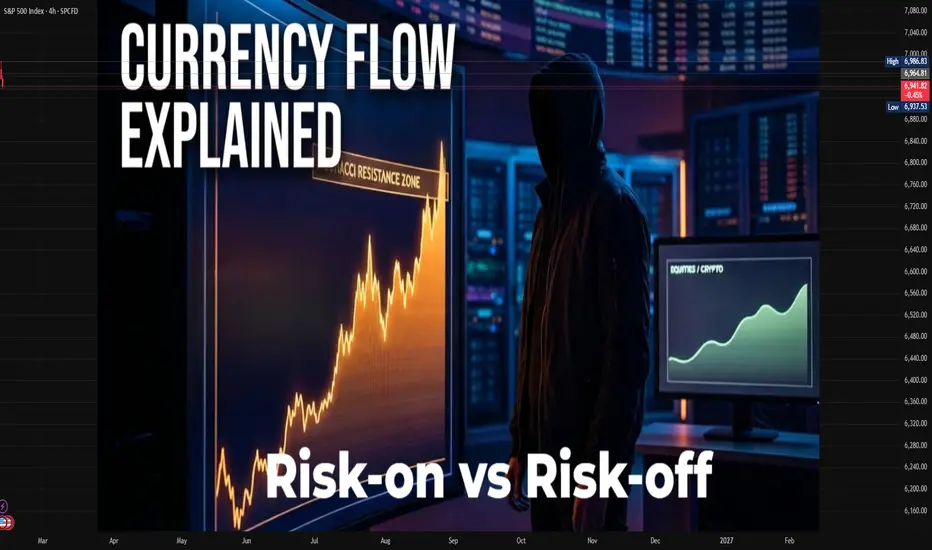
Risk-On vs Risk-Off Currency Flows1. Understanding Risk-On Sentiment
Risk-on sentiment emerges when investors feel confident about global growth, financial stability, and economic prospects. During such periods, investors are willing to move capital into higher-yielding, more volatile assets. In the context of currencies:
High-yield currencies gain favor: Currencies from countries offering higher interest rates tend to appreciate because investors seek better returns. Examples include the Australian dollar (AUD), New Zealand dollar (NZD), and emerging market currencies like the Brazilian real (BRL) or Indonesian rupiah (IDR).
Safe-haven currencies weaken: Traditional safe-haven currencies, such as the US dollar (USD), Japanese yen (JPY), and Swiss franc (CHF), often weaken as investors exit low-yield, low-risk assets in favor of higher returns elsewhere.
Factors fueling risk-on flows:
Strong global economic data (GDP growth, employment figures, manufacturing output)
Rising stock markets
Central bank policies that support growth (e.g., lower interest rates, quantitative easing)
Reduced geopolitical tensions
Currency market behavior during risk-on periods:
The AUD/USD or NZD/USD pairs often appreciate because capital flows into Australia and New Zealand for better yields.
Emerging market currencies strengthen against the USD and JPY as investors chase higher returns.
Commodity-linked currencies, like the Canadian dollar (CAD) or Norwegian krone (NOK), benefit as commodity prices rise with increased global demand.
Example:
During periods of strong global economic growth, like in 2017-2018, risk-on sentiment drove the AUD, NZD, and BRL higher against the USD as investors moved capital into higher-yielding assets and emerging markets.
2. Understanding Risk-Off Sentiment
Risk-off sentiment occurs when investors become cautious or fearful about global economic or financial stability. During these periods, market participants prioritize capital preservation over high returns. This behavior has a profound impact on currency markets:
Safe-haven currencies strengthen: The USD, JPY, and CHF tend to appreciate as investors flock to perceived safety.
Riskier currencies weaken: High-yield currencies, emerging market currencies, and commodity-linked currencies depreciate as capital exits these markets.
Triggers of risk-off sentiment include:
Geopolitical conflicts (e.g., wars, trade tensions)
Financial crises or market crashes
Unexpected economic slowdowns or recessions
Volatility spikes in equity or bond markets
Currency market behavior during risk-off periods:
The USD/JPY pair often falls (JPY appreciates) as investors buy yen for safety.
Emerging market currencies, like the BRL, IDR, or INR, tend to decline against safe-haven currencies.
Commodity-linked currencies, like AUD and CAD, weaken due to falling commodity demand and prices.
Example:
During the 2008 global financial crisis, risk-off flows dominated. Investors fled to USD, JPY, and CHF, causing emerging market and commodity currencies to depreciate sharply.
3. Mechanics of Risk-On and Risk-Off Flows
Currency flows are influenced by how global capital moves between riskier and safer assets. These flows are driven by several mechanisms:
Interest rate differentials:
Investors seek higher yields when risk appetite is high (risk-on) and prefer safety when risk appetite drops (risk-off). The “carry trade” exemplifies this, where investors borrow in low-yield currencies (like JPY) to invest in higher-yielding currencies (like AUD).
Capital flows to equities and bonds:
Risk-on: Investors buy equities, especially in emerging markets, boosting local currencies.
Risk-off: Investors sell equities and bonds in riskier markets and buy safe-haven bonds (like U.S. Treasuries), driving safe-haven currencies higher.
Commodity linkages:
Many currencies are tied to commodities:
AUD, CAD, and NZD benefit from higher commodity prices (risk-on).
Commodity prices fall during risk-off periods, weakening these currencies.
Market psychology and sentiment:
News events, central bank statements, or global crises can trigger immediate shifts between risk-on and risk-off, causing volatile currency movements.
4. Risk-On vs Risk-Off Indicators
Traders use several indicators to gauge global risk sentiment and predict currency flows:
Equity markets: Rising stock markets signal risk-on; falling markets signal risk-off.
Volatility indices (VIX): High volatility indicates risk-off; low volatility indicates risk-on.
Bond yields: Rising yields in safe-haven bonds indicate risk-off buying; falling yields indicate risk-on selling.
Commodity prices: Rising commodities reflect risk-on sentiment; falling prices reflect risk-off.
Currency correlations: Tracking historically correlated pairs can reveal market sentiment.
5. Practical Examples in Currency Pairs
AUD/USD: A barometer of risk appetite. Gains in risk-on environments; falls during risk-off periods.
USD/JPY: A barometer of risk aversion. Falls (JPY strengthens) during risk-off; rises (JPY weakens) during risk-on.
Emerging market currencies: Often highly sensitive to global risk sentiment; small changes in investor confidence can lead to large currency swings.
Case Study:
During the COVID-19 pandemic in March 2020, risk-off sentiment surged. Investors moved trillions of dollars into the USD and JPY, while emerging market currencies and AUD/ NZD fell sharply. Conversely, when vaccine news and stimulus measures revived confidence in late 2020, risk-on flows returned, lifting high-yield currencies.
6. Strategic Implications for Traders
Understanding risk-on and risk-off flows is critical for forex and cross-asset trading:
Carry trades:
Profitable during risk-on when high-yield currencies appreciate.
Risky during risk-off due to sudden unwinding and sharp depreciation of high-yield currencies.
Hedging:
Traders may hedge exposure to emerging markets or commodity currencies during risk-off periods.
Safe-haven currencies can serve as natural hedges.
Diversification:
Holding a mix of risk-on and risk-off correlated assets can reduce portfolio volatility.
7. Long-Term Trends and Risk Sentiment
While daily flows respond to news, long-term trends in risk-on and risk-off flows reflect macroeconomic fundamentals:
Global economic cycles: Expansion phases favor risk-on flows; recessions favor risk-off.
Monetary policy cycles: Loose monetary policies in developed economies often drive risk-on flows; tightening or crises drive risk-off.
Geopolitical stability: Peaceful, stable conditions encourage risk-on; instability triggers risk-off.
8. Key Takeaways
Risk-on: Investors seek higher returns → high-yield and emerging market currencies strengthen; safe-haven currencies weaken.
Risk-off: Investors seek safety → safe-haven currencies strengthen; high-yield and emerging market currencies weaken.
Currency flows are driven by interest rate differentials, equity/bond market movements, commodity prices, and investor sentiment.
Monitoring market indicators like equity indices, VIX, commodity prices, and bond yields is essential for predicting currency behavior.
Strategic implications include carry trade opportunities, hedging against volatility, and portfolio diversification.
In conclusion, risk-on vs risk-off currency flows reflect the tug-of-war between growth-seeking and safety-seeking capital. Forex traders, institutional investors, and macroeconomists closely monitor these flows because they not only influence currency valuations but also reveal broader insights into global risk sentiment, capital allocation, and economic trends. Understanding these dynamics enables more informed trading decisions, portfolio management, and policy analysis.
Growth vs. Value Investing Cycles1. Defining Growth and Value Investing
Growth investing focuses on companies that exhibit strong potential for future earnings growth. These companies often reinvest profits to fuel expansion rather than paying dividends. Investors in growth stocks pay a premium for anticipated high growth, accepting higher valuation ratios such as Price-to-Earnings (P/E) or Price-to-Book (P/B) multiples.
Key characteristics of growth investing:
High earnings growth rate.
Dominant or disruptive industry position.
Often innovative, technology-driven, or new market leaders.
Typically lower or no dividends, reinvesting profits into expansion.
Value investing, in contrast, targets companies whose stock prices are considered undervalued relative to fundamentals. These companies may have slower growth prospects but often trade at a discount due to market overreactions, temporary setbacks, or low investor sentiment. Value investors rely on metrics like P/E ratio, P/B ratio, and dividend yield to identify undervalued opportunities.
Key characteristics of value investing:
Stocks trading below intrinsic value.
Stable, mature companies with predictable earnings.
Often offers dividends.
Typically operates in traditional sectors such as industrials, energy, or consumer staples.
2. The Nature of Investing Cycles
Investment styles, including growth and value, tend to perform in cycles influenced by:
Economic Growth and Recessions:
During periods of strong economic expansion, growth stocks often outperform. Investors are willing to pay high premiums for companies expected to capitalize on increased consumer demand, technological advancement, or market expansion.
Conversely, during economic slowdowns or recessions, value stocks generally perform better. These companies are often financially stable, generate steady cash flow, and provide dividends, appealing to risk-averse investors.
Interest Rate Movements:
Low-interest-rate environments favor growth stocks, as cheaper borrowing costs allow companies to expand aggressively. Investors are more inclined to pay high valuations for future earnings.
High-interest-rate environments penalize growth stocks because future earnings are discounted more heavily. Value stocks, which often rely on tangible assets and stable cash flows, tend to be more resilient in such periods.
Market Sentiment and Risk Appetite:
Bull markets with high investor confidence favor growth investing, as optimism about future prospects drives higher valuations.
Bear markets, uncertainty, or risk aversion shift preferences toward value stocks, as investors seek safer, undervalued assets with downside protection.
3. Historical Growth and Value Cycles
Historically, growth and value investing have alternated in dominance:
1990s – Growth Outperformance:
The late 1990s, marked by the dot-com boom, exemplify a prolonged growth cycle. Technology and internet stocks soared despite weak earnings, driven by investor optimism and disruptive innovation. Value investing lagged, as traditional sectors were less exciting to the market.
Early 2000s – Value Recovery:
Following the dot-com crash (2000–2002), growth stocks plummeted due to overvaluation and lack of profitability. Value stocks, characterized by tangible earnings and dividends, outperformed as markets rotated toward safety and fundamentals.
Mid-2000s – Growth Rebound:
Economic expansion fueled a brief resurgence in growth stocks, particularly in sectors like technology, consumer discretionary, and emerging markets.
2008 Financial Crisis – Value Resilience:
During the 2008 crisis, growth stocks suffered heavily due to uncertainty and high valuations. Value stocks with strong balance sheets and predictable cash flows outperformed as investors sought safety.
Post-2009 – Extended Growth Cycle:
After quantitative easing and low-interest rates post-2009, growth stocks enjoyed an unprecedented bull run, especially in technology and innovation-driven sectors. FAANG stocks (Facebook, Apple, Amazon, Netflix, Google) became emblematic of this era. Value lagged, particularly in traditional industries.
2022–2023 – Value Resurgence:
Rising inflation, higher interest rates, and global uncertainty shifted markets toward value stocks. Traditional sectors like energy, banking, and commodities outperformed high-growth technology stocks, demonstrating the cyclical nature of style investing.
4. Drivers of Growth vs. Value Cycles
The cycles are influenced by multiple interconnected factors:
Macroeconomic Conditions:
Growth thrives in low-rate, expanding economies.
Value prevails in high-rate, slowing, or uncertain economic environments.
Investor Psychology:
Herd mentality amplifies trends. In bullish periods, growth stocks may become overvalued, while in pessimistic periods, value stocks become oversold and attract attention.
Sector Dynamics:
Certain sectors naturally align with styles. Technology, biotech, and consumer discretionary often lead growth cycles. Industrials, utilities, energy, and financials frequently anchor value cycles.
Government Policies:
Fiscal stimulus, tax incentives, and regulatory frameworks can favor growth or value sectors. For instance, tech-friendly policies boost growth stock performance, while energy subsidies or infrastructure spending favor value sectors.
5. Investing Strategy Implications
Understanding these cycles helps investors:
Portfolio Rotation:
Savvy investors may rotate allocations between growth and value depending on economic, interest rate, and sentiment signals. This requires timing insights but can enhance returns.
Diversification:
Maintaining a blend of growth and value investments reduces exposure to extreme swings. During prolonged growth cycles, value cushions downside risk; during value cycles, growth stocks provide upside potential.
Valuation Awareness:
Paying attention to valuation extremes helps anticipate style rotations. Historically, when growth valuations become stretched, value stocks often outperform subsequently.
Long-Term Perspective:
Cycles demonstrate that no style dominates permanently. Investors benefit from patience, understanding that both styles can thrive in different market phases.
6. Key Takeaways on Growth vs. Value Cycles
Growth and value investing alternate in performance due to economic conditions, interest rates, market sentiment, and investor psychology.
Growth stocks perform best during low-interest rates, economic expansion, and high risk appetite periods.
Value stocks shine during high-interest rates, economic slowdowns, or market uncertainty.
Historical cycles, from the 1990s dot-com boom to post-2009 tech dominance and the 2022 value resurgence, illustrate this alternating pattern.
Investors can leverage cycles by portfolio rotation, maintaining diversified allocations, and monitoring valuations.
Recognizing cycles reduces emotional decision-making, enabling disciplined long-term investing.
Both styles offer complementary advantages: growth for capital appreciation, value for downside protection and income.
Conclusion
Growth vs. value investing cycles are a natural and predictable part of market behavior. Neither style is universally superior; each excels under specific macroeconomic and market conditions. Successful investors understand these cycles, position their portfolios accordingly, and maintain a balance between chasing high growth and protecting capital through value investments. Ultimately, recognizing and responding to these cycles can enhance returns, reduce risk, and provide a strategic advantage in navigating the complex world of equity markets.

Part 5 Advance Trading StrategiesPremium — What You Pay or Receive
Premium is the price of the option.
If you BUY an option → you pay premium
If you SELL an option → you receive premium
Premium changes based on:
Market movement
Time left to expiry
Volatility
Demand & supply

Part 4 Institutional Trading VS. Technical AnalysisCall Option (CE) — The Simplest Explanation
A Call Option is a contract that gives you the right to buy at a fixed price.
You buy a CE when you expect:
✔ PRICE will go UP.
Profit Logic:
Price goes ABOVE strike price + premium.
Loss Logic:
Maximum loss is only the premium.

Emerging Markets and Developed MarketsIntroduction
The global banking system operates across countries that are at very different stages of economic development. Broadly, these countries are classified into Developed Markets (DMs) and Emerging Markets (EMs). World banks play a central role in both categories by mobilizing savings, allocating credit, facilitating trade, managing risk, and supporting economic growth. However, the structure, stability, regulatory environment, and growth dynamics of banks differ significantly between developed and emerging markets.
Understanding these differences is essential for policymakers, investors, multinational banks, and global institutions such as the IMF and World Bank.
Developed Markets in World Banking
Definition and Characteristics
Developed markets are economies with high income levels, advanced infrastructure, mature financial systems, and stable political and regulatory environments. Examples include the United States, United Kingdom, Eurozone countries, Japan, Canada, Australia, and Switzerland.
Banks in developed markets are characterized by:
Deep and liquid financial markets
Strong regulatory and supervisory frameworks
High financial inclusion
Advanced technology and digital banking
Stable currencies and low inflation (in normal conditions)
Structure of Banking Systems in Developed Markets
Developed-market banking systems are highly diversified and include:
Commercial banks
Investment banks
Universal banks
Shadow banking institutions (hedge funds, private equity)
Large global banks such as JPMorgan Chase, HSBC, Citi, Deutsche Bank, and Barclays dominate international banking activities like cross-border lending, trade finance, derivatives, and capital markets.
Role of Banks in Developed Markets
Financial Intermediation
Banks efficiently channel household savings into business investment and consumer credit.
Capital Market Integration
Banks are closely linked with equity and bond markets, providing underwriting, advisory, and market-making services.
Global Liquidity Providers
Developed-market banks supply liquidity to the global system, especially during normal economic periods.
Risk Management
Advanced derivatives, insurance products, and hedging mechanisms help manage interest rate, credit, and currency risks.
Strengths of Developed-Market Banks
Strong capital adequacy and stress testing
Transparent accounting and governance
Sophisticated risk-management systems
Lower credit risk due to diversified economies
Challenges in Developed Markets
Low interest rates compress bank profitability
High regulatory compliance costs (Basel III/IV)
Slow credit growth due to mature economies
Exposure to financial crises (e.g., 2008 Global Financial Crisis)
Emerging Markets in World Banking
Definition and Characteristics
Emerging markets are economies that are transitioning from low-income to middle- or high-income status and are integrating into the global financial system. Examples include India, China, Brazil, Indonesia, Mexico, South Africa, Vietnam, and Turkey.
Emerging-market banking systems typically show:
Faster economic and credit growth
Improving but uneven regulatory standards
Higher inflation and interest rates
Greater exposure to external shocks
Expanding financial inclusion
Structure of Banking Systems in Emerging Markets
Banks in emerging markets are often:
Dominated by state-owned or public-sector banks
Less diversified compared to developed markets
More dependent on traditional lending than capital markets
Foreign banks and multilateral institutions play an important role by providing:
Capital
Technical expertise
Risk-management practices
Role of Banks in Emerging Markets
Economic Development Financing
Banks fund infrastructure, manufacturing, MSMEs, and agriculture.
Financial Inclusion
Expanding access to banking services for underserved populations is a key objective.
Credit Expansion
Rapid loan growth supports consumption and investment but also increases risk.
Trade and FX Services
Banks facilitate international trade and manage foreign exchange flows.
Strengths of Emerging-Market Banks
High loan growth potential
Rising middle class and demand for credit
Technology leapfrogging (mobile banking, UPI, fintech)
Higher interest margins compared to developed markets
Challenges in Emerging Markets
Higher credit and default risk
Political and regulatory uncertainty
Currency volatility and capital outflows
Non-performing assets (NPAs)
Lower transparency and governance in some regions
Key Differences Between Developed and Emerging Market Banks
Aspect Developed Markets Emerging Markets
Economic Growth Slow & stable Fast but volatile
Banking Maturity Highly mature Developing
Credit Risk Low to moderate Higher
Regulation Strong & strict Improving, uneven
Interest Rates Low Higher
Financial Inclusion Near universal Expanding
Currency Stability Strong Volatile
Role of Global Institutions
World banks such as the World Bank Group, IMF, Asian Development Bank (ADB), and African Development Bank bridge the gap between developed and emerging markets by:
Providing development finance
Supporting banking sector reforms
Strengthening regulatory capacity
Stabilizing economies during crises
Developed-market banks often partner with these institutions to fund projects in emerging markets.
Interdependence Between Developed and Emerging Markets
The global banking system is highly interconnected:
Developed-market banks lend to emerging economies
Emerging markets provide growth opportunities for global banks
Capital flows move quickly between markets based on interest rates and risk perception
Financial stress in one region can spill over globally, as seen during:
Asian Financial Crisis (1997)
Global Financial Crisis (2008)
COVID-19 economic shock
Future Trends in World Banking
Digital Transformation
Emerging markets may lead in fintech adoption, while developed markets refine advanced systems.
Sustainable and Green Banking
Both markets are increasing focus on ESG and climate finance.
Regulatory Convergence
Emerging markets are gradually adopting global banking standards.
Shift in Global Banking Power
Large banks from China and India are gaining global importance.
Conclusion
Developed and emerging markets represent two distinct but interconnected pillars of the global banking system. Developed-market banks provide stability, capital depth, and global financial infrastructure, while emerging-market banks drive growth, inclusion, and future expansion. Both face unique challenges and opportunities, and their interaction shapes global economic stability.
As emerging markets continue to mature and integrate with global finance, the distinction between developed and emerging banking systems will gradually narrow—but their differences will remain a defining feature of world banking for decades to come.

Competitive Currency War: Meaning, Causes, and Global ImpactA competitive currency war refers to a situation in which countries deliberately attempt to devalue their own currencies in order to gain an economic advantage over other nations. The primary objective is to make exports cheaper, imports more expensive, and thereby improve trade balances, boost domestic growth, and protect employment. However, when many countries pursue this strategy simultaneously, it can lead to economic instability, retaliation, and long-term damage to the global financial system.
The term “currency war” became popular after the 2008 global financial crisis, when several major economies adopted aggressive monetary policies that indirectly weakened their currencies. Although competitive devaluation may offer short-term benefits, it often creates lose-lose outcomes when practiced globally.
Historical Background
Currency wars are not new. One of the earliest and most damaging examples occurred during the 1930s Great Depression. Countries abandoned the gold standard and deliberately devalued their currencies to stimulate exports. Instead of recovery, this led to trade retaliation, collapsing global trade, and deeper economic distress.
In modern times, currency wars have re-emerged due to:
Globalization of trade and finance
Free-floating exchange rate systems
Capital mobility across borders
Central banks’ expanded role in economic management
The post-2008 era and later the COVID-19 crisis intensified currency competition as nations attempted to revive growth using unconventional monetary tools.
Why Do Countries Engage in Currency Wars?
Countries resort to competitive currency devaluation for several economic and political reasons:
1. Boosting Exports
A weaker currency makes a country’s goods and services cheaper in international markets, increasing export competitiveness.
2. Reducing Trade Deficits
Devaluation discourages imports by making them more expensive while promoting domestic production.
3. Stimulating Economic Growth
Export-led growth helps increase industrial output, employment, and GDP, especially during recessions.
4. Fighting Deflation
A weaker currency raises import prices, helping central banks combat deflationary pressures.
5. Protecting Domestic Industries
Governments may weaken their currencies to shield local industries from foreign competition.
Tools Used in Currency Wars
Countries do not openly announce currency wars. Instead, they use indirect policy tools that influence exchange rates.
1. Monetary Policy Easing
Central banks cut interest rates or keep them near zero, reducing returns on domestic assets and pushing investors toward higher-yielding currencies.
2. Quantitative Easing (QE)
Large-scale asset purchases increase money supply, putting downward pressure on the currency.
3. Foreign Exchange Market Intervention
Central banks buy or sell foreign currencies directly to influence exchange rates.
4. Capital Controls
Restrictions on capital inflows or outflows can weaken or stabilize domestic currencies.
5. Verbal Intervention
Statements by policymakers signaling a preference for a weaker currency can influence market expectations.
How a Competitive Currency War Escalates
A currency war typically follows this pattern:
One country weakens its currency to gain trade advantage
Trading partners experience export pressure
Other countries retaliate with similar policies
Global exchange rates become volatile
Trade tensions escalate into protectionism
This chain reaction undermines international cooperation and damages trust among economies.
Impact on the Global Economy
1. Increased Exchange Rate Volatility
Currency wars create uncertainty in forex markets, discouraging long-term investment and trade planning.
2. Trade Tensions and Protectionism
Countries may impose tariffs or trade barriers to counter perceived unfair advantages, leading to trade wars.
3. Inflation Risks
Currency devaluation raises import prices, potentially causing inflation in import-dependent economies.
4. Capital Flow Instability
Hot money flows into higher-yielding or safer currencies, destabilizing emerging markets.
5. Global Growth Slowdown
When everyone devalues, no country gains a lasting advantage, resulting in weaker global demand.
Effects on Emerging Markets
Emerging economies are often the biggest victims of currency wars.
Sudden capital inflows cause asset bubbles
Rapid outflows lead to currency crashes
Foreign-currency debt becomes more expensive
Central banks face pressure to intervene
For example, when advanced economies adopt ultra-loose monetary policies, excess liquidity flows into emerging markets, only to reverse abruptly when conditions change.
Competitive Currency War vs Trade War
Although related, currency wars and trade wars are different:
Aspect Currency War Trade War
Tool Exchange rate policies Tariffs & quotas
Objective Export competitiveness Protect domestic industries
Visibility Indirect Direct
Speed Gradual Immediate
Often, a currency war precedes or accompanies a trade war, intensifying global economic conflict.
Role of International Institutions
Institutions like the International Monetary Fund (IMF) and G20 attempt to discourage currency wars by promoting:
Market-determined exchange rates
Policy coordination
Transparency in monetary policy
However, enforcement is weak, as countries prioritize domestic economic stability over global cooperation.
Is Currency Devaluation Always Bad?
Not necessarily. Occasional and moderate currency adjustments can help economies correct imbalances. Problems arise when:
Devaluation is aggressive and sustained
Multiple countries act simultaneously
Policies are politically motivated rather than economically justified
In such cases, currency wars distort markets and create systemic risks.
Conclusion
A competitive currency war is a complex and risky strategy where countries attempt to gain economic advantage by weakening their currencies. While it may offer short-term relief in exports and growth, widespread participation leads to global instability, retaliation, and reduced trust in international markets. History shows that currency wars rarely produce lasting winners and often end with slower growth, higher volatility, and deeper economic divisions.
In an interconnected world economy, cooperation and balanced macroeconomic policies are far more effective than competitive devaluation. Avoiding currency wars is essential for sustainable global growth, financial stability, and long-term prosperity.

Part 3 Institutional Option Trading VS. Technical AnalysisBest Practices for Option Traders
1. Use a strategy, not impulses
Enter with logic, not emotion.
2. Risk Management
Never risk more than 1–2% of capital per trade.
3. Understand Volatility
Most retail losses come from ignoring IV.
4. Avoid Illiquid Options
Always trade high-volume strikes.
5. Prefer spreads over naked positions
Spreads reduce both risk and margin.
6. Don’t hold losing trades
Cut loss quickly; small loss is a big victory.

Part 1 Institutional Option Trading VS. Technical Analysis Important Option Terminology
Before going deeper, you must understand key terms.
1. Strike Price
The predetermined price at which the option can be exercised.
2. Spot Price
Current market price of the underlying asset.
3. Premium
Price of the option.
4. Expiration
The last date the option is valid (weekly or monthly).
5. Lot Size
Minimum quantity defined by the exchange.
6. ITM (In the Money)
Call: Strike < Spot
Put: Strike > Spot
7. ATM (At the Money)
Strike = Spot
8. OTM (Out of the Money)
Call: Strike > Spot
Put: Strike < Spot

Part 1 Intraday Institutional Trading Strategies What Are Options? (Basic Definition)
Options are financial contracts that give the buyer the right (but not the obligation) to buy or sell an underlying asset (such as Nifty, Bank Nifty, stocks, commodities) at a pre-decided strike price, within a specific expiration time.
Two types of options:
1. Call Option (CE)
Gives the buyer the right to buy.
You buy a call when you expect the price to go up.
2. Put Option (PE)
Gives the buyer the right to sell.
You buy a put when you expect the price to go down.
But options are not just about direction. They involve time, volatility, market psychology, and risk management.

De-Dollarization and Currency WarsA Global Power Shift in Motion
For more than seven decades, the US dollar has sat at the center of the global financial system. It dominates international trade, commodity pricing, foreign exchange reserves, cross-border lending, and global capital markets. This dominance has given the United States unmatched financial power—and the rest of the world a shared dependence. Today, however, that system is being challenged. Two closely linked phenomena are reshaping the monetary landscape: de-dollarization and currency wars. Together, they reflect rising geopolitical tension, shifting economic power, and a growing struggle for monetary sovereignty.
Understanding De-Dollarization
De-dollarization refers to the gradual reduction of reliance on the US dollar in global trade, reserves, finance, and payments. It does not mean the dollar will disappear overnight. Instead, it signals a slow, strategic effort by countries to diversify away from dollar dependence.
Historically, nations adopted the dollar because it was stable, liquid, trusted, and backed by deep US capital markets. Oil was priced in dollars, international debt was issued in dollars, and central banks held dollars as their primary reserve asset. Over time, this created a feedback loop: the more the dollar was used, the more powerful and indispensable it became.
However, this same system created vulnerabilities. Countries holding dollar reserves are exposed to US monetary policy, sanctions, interest-rate cycles, and financial regulations. As geopolitical risks rise, these vulnerabilities are no longer theoretical—they are strategic concerns.
Why De-Dollarization Is Accelerating
Several forces are driving the current push toward de-dollarization.
First is geopolitical weaponization of finance. US-led sanctions, asset freezes, and restrictions on dollar-based payment systems have shown that access to the dollar is not politically neutral. When nations see foreign reserves frozen or trade disrupted, the incentive to reduce exposure becomes urgent.
Second is shifting global economic power. Emerging economies—especially in Asia, the Middle East, and parts of Africa—now contribute a larger share of global growth. These countries want financial systems that reflect their economic weight rather than relying on a Western-centric monetary order.
Third is domestic monetary autonomy. Heavy dollar dependence can weaken local currencies and limit central bank flexibility. Countries facing dollar shortages during crises experience inflation spikes, capital flight, and financial instability.
Finally, technological change has lowered barriers. Digital payment systems, bilateral currency swap lines, local-currency trade agreements, and central bank digital currencies (CBDCs) are making alternatives to the dollar more viable.
How De-Dollarization Is Happening in Practice
De-dollarization is not a single action but a collection of gradual shifts.
Countries are settling bilateral trade in local currencies, bypassing the dollar. Energy, commodities, and manufactured goods are increasingly priced in non-dollar terms between willing partners.
Central banks are diversifying reserves, increasing allocations to gold, regional currencies, and non-US assets. Gold, in particular, has regained importance as a politically neutral reserve.
Regional payment systems are expanding to reduce reliance on dollar-based infrastructure. Currency swap agreements between central banks provide liquidity without touching the dollar.
Importantly, these changes are incremental, not revolutionary. The dollar remains dominant—but its monopoly is slowly eroding.
What Are Currency Wars?
A currency war occurs when countries deliberately weaken their currencies to gain economic advantages—usually to boost exports, attract capital, or manage debt burdens. Unlike traditional wars, currency wars are fought through interest rates, quantitative easing, capital controls, and verbal guidance rather than weapons.
Currency wars often emerge during periods of global economic stress, slow growth, or uneven recoveries. When one country weakens its currency, others feel pressured to respond to avoid losing competitiveness. This creates a cycle of retaliatory devaluations.
Tools Used in Currency Wars
Central banks have several tools to influence currency values.
Interest rate adjustments are the most direct. Lower rates reduce returns on assets, weakening the currency. Higher rates attract capital, strengthening it.
Quantitative easing increases money supply, often leading to currency depreciation.
Foreign exchange intervention involves direct buying or selling of currencies in the market.
Capital controls restrict money flows to manage volatility.
Even verbal signaling—statements by central bankers or finance ministers—can move currencies sharply.
These tools blur the line between domestic economic policy and international competition.
The Link Between De-Dollarization and Currency Wars
De-dollarization and currency wars are deeply interconnected.
As countries move away from the dollar, exchange rate management becomes more complex. Without the stabilizing anchor of dollar dominance, currencies become more sensitive to capital flows, trade balances, and policy divergence.
At the same time, de-dollarization reduces the effectiveness of US monetary transmission. This weakens the global role of the Federal Reserve and encourages regional monetary blocs—each managing its own currency priorities.
The result is a more fragmented monetary system, where competitive devaluations and policy conflicts become more frequent.
Implications for the Global Economy
For the global economy, these trends bring both opportunity and risk.
On the positive side, reduced dollar dependence can increase financial resilience, especially for emerging markets. It encourages regional cooperation and diversified trade relationships.
On the negative side, fragmentation reduces efficiency. Multiple settlement currencies increase transaction costs, reduce liquidity, and complicate risk management. Currency volatility rises, making global trade and investment more uncertain.
For commodities, pricing diversification weakens the traditional dollar-commodity inverse relationship. For debt markets, borrowing costs become more sensitive to local currency credibility.
Impact on Investors and Traders
For investors and traders, de-dollarization and currency wars reshape market dynamics.
Currency volatility increases, creating both risk and opportunity. Capital flows become more selective, rewarding countries with credible policy frameworks and punishing those with weak fundamentals.
Safe-haven assets evolve. Gold, select currencies, and real assets gain prominence alongside the dollar rather than beneath it.
Macro-driven trades—interest rate differentials, yield curves, and capital flow signals—become more important than pure technical patterns.
In short, macro awareness becomes edge, not optional knowledge.
The Future: Decline or Transformation?
The dollar is not collapsing. Its depth, liquidity, legal framework, and network effects remain unmatched. However, its absolute dominance is fading.
The future is likely a multipolar currency system, where the dollar remains the primary reserve but shares influence with regional and functional alternatives. Currency wars will not disappear; they will evolve into more subtle, policy-driven contests.
De-dollarization is not about replacing the dollar—it is about reducing vulnerability. Currency wars are not accidents—they are symptoms of a world adjusting to new power realities.
Bottom Line
De-dollarization and currency wars reflect a world in transition. They reveal the tension between global integration and national sovereignty, between stability and control. For policymakers, the challenge is balance. For investors and traders, the opportunity lies in understanding these shifts early—because money, ultimately, follows power.

Currency Pegs and Exchange RatesHow Nations Control Their Money’s Value
Currencies are not just pieces of paper or digital numbers—they are tools of economic power. Every country must decide how much control it wants over its currency’s value, and that decision shapes inflation, trade competitiveness, capital flows, and financial stability. At the heart of this choice lies the concept of exchange rate regimes, with currency pegs being one of the most important and controversial systems.
What Is an Exchange Rate?
An exchange rate is the price of one country’s currency expressed in another currency. For example, if 1 USD equals 83 INR, that is the exchange rate between the US dollar and the Indian rupee. Exchange rates affect imports, exports, foreign investment, debt servicing, and even domestic inflation.
Countries manage exchange rates in different ways depending on their economic goals, institutional strength, and exposure to global markets.
Types of Exchange Rate Regimes
Broadly, exchange rate systems fall into three categories:
Floating exchange rate
Fixed exchange rate (currency peg)
Managed float (hybrid system)
Among these, currency pegs represent the strongest form of control.
What Is a Currency Peg?
A currency peg is a system where a country fixes its currency’s value to another currency (or a basket of currencies). The most common anchor currencies are the US dollar, euro, or gold (historically).
For example:
Hong Kong dollar is pegged to the US dollar
Saudi riyal is pegged to the US dollar
Danish krone is pegged to the euro
In a peg system, the central bank commits to maintaining a fixed exchange rate—say, 1 local currency = 0.27 USD—and intervenes in foreign exchange markets to defend that level.
How a Currency Peg Works
To maintain a peg, a central bank must be ready to buy or sell foreign currency reserves at any time.
If the local currency weakens, the central bank sells foreign reserves (like USD) and buys its own currency.
If the local currency strengthens too much, the central bank prints local currency and buys foreign assets.
This constant intervention requires large foreign exchange reserves, strong credibility, and disciplined monetary policy.
Types of Currency Pegs
1. Hard Peg
A hard peg allows almost no fluctuation. Examples include:
Currency boards
Dollarized economies (e.g., Panama using USD)
Hard pegs offer stability but eliminate independent monetary policy.
2. Soft Peg
A soft peg allows limited movement within a narrow band. The currency may fluctuate ±1–2% around the target rate.
3. Basket Peg
Instead of pegging to a single currency, the currency is linked to a basket of major currencies (USD, EUR, JPY, etc.). This reduces dependence on one economy.
Why Countries Choose Currency Pegs
1. Exchange Rate Stability
Pegged currencies reduce volatility, making trade and investment more predictable. This is especially useful for small, open economies dependent on imports or exports.
2. Inflation Control
By pegging to a low-inflation currency like the US dollar, a country can import monetary discipline and anchor inflation expectations.
3. Trade Promotion
A stable exchange rate lowers currency risk for exporters and importers, boosting cross-border trade.
4. Financial Credibility
For developing economies, a peg can signal commitment to stability and attract foreign capital.
Costs and Risks of Currency Pegs
While pegs offer stability, they come with serious trade-offs.
1. Loss of Monetary Policy Independence
The central bank cannot freely set interest rates. It must align policy with the anchor currency, even if domestic conditions differ.
2. Vulnerability to Speculative Attacks
If markets believe the peg is unsustainable, speculators may bet against it, forcing massive reserve losses. Famous examples include:
UK pound crisis (1992)
Thai baht collapse (1997)
3. Reserve Drain
Defending a peg during capital outflows can rapidly deplete foreign exchange reserves.
4. Misaligned Currency Value
If the peg is set too high, exports suffer. If too low, inflation rises. Over time, economic fundamentals may diverge from the peg.
Pegs vs Floating Exchange Rates
Floating Exchange Rates
In a floating system, currency value is determined by market forces—supply and demand. Countries like the US, Japan, and India follow this approach.
Advantages:
Independent monetary policy
Automatic adjustment to shocks
No need for large reserves
Disadvantages:
Higher volatility
Exchange rate uncertainty
Potential for sharp depreciations
Managed Float: The Middle Path
Many countries operate a managed float, also called a dirty float. Here, the currency mostly floats but the central bank intervenes occasionally to prevent extreme volatility.
India is a classic example. The Reserve Bank of India does not fix the rupee but actively intervenes to smooth excessive movements.
This system offers:
Flexibility
Partial stability
Policy autonomy
Currency Pegs in the Modern Global Economy
In today’s interconnected world, currency pegs are under constant pressure from:
Capital mobility
Algorithmic trading
Global interest rate cycles
Geopolitical shocks
Strong pegs survive only when supported by:
Massive reserves
Fiscal discipline
Political stability
Credible institutions
Countries without these foundations often abandon pegs during crises.
Lessons from History
History shows that currency pegs work best in calm times and break during stress. Pegs are not permanent guarantees; they are policy choices that must evolve with economic reality.
Successful pegs require:
Economic alignment with the anchor country
Willingness to accept policy constraints
Readiness to absorb external shocks
Conclusion
Currency pegs and exchange rate regimes are not just technical monetary choices—they are reflections of a country’s economic philosophy and risk tolerance. Pegs offer stability, discipline, and predictability, but at the cost of flexibility and independence. Floating systems offer freedom but demand strong institutions and market confidence.
For traders, investors, and policymakers, understanding currency pegs is essential because when pegs hold, markets are calm—but when pegs break, financial history is made.
