Trading with Volume1. What is Volume in Trading?
Volume is the total number of shares, contracts, or lots traded in a market during a particular period. Every time a buyer and seller make a transaction, it adds to the volume count.
For example:
If 10,00,000 shares of a stock are bought and sold during a day, that stock’s daily volume is 10 lakh.
If Bitcoin has 50,000 transactions in a 1-hour timeframe, that is its hourly volume.
Volume acts as the pulse of the market. When market participants are active, volume increases. When they lose interest, volume shrinks.
2. Why is Volume Important for Traders?
Volume helps traders answer critical questions:
a. Is the trend strong or weak?
A price trend supported by high volume is considered trustworthy. A trend on low volume is often weak and may collapse.
b. Is the breakout real or fake?
Strong volume during breakouts confirms genuine market interest. Low-volume breakouts often fail.
c. Is a reversal coming?
Volume spikes at tops or bottoms often indicate exhaustion and potential reversal.
d. Where are big players active?
Institutional traders like banks, funds, and smart money leave “footprints” through volume surges.
Thus, volume is a confirmation tool that helps traders avoid traps and make informed decisions.
3. Understanding Volume in Different Market Conditions
a. Volume in Uptrends
When volume rises along with price, the uptrend is considered healthy. Buyers are active and willing to buy at higher levels.
Signs of strong uptrend:
Price ↑ and Volume ↑ → Strong bullish trend
Pullback with low volume → Healthy correction
Signs of weakening uptrend:
Price ↑ but Volume ↓ → Weak trend, risk of reversal
b. Volume in Downtrends
In downtrends, high volume indicates strong selling pressure.
Strong downtrend signals:
Price ↓ and Volume ↑ → Strong bearish trend
Pullback with low volume → Continuation likely
Weak downtrend signals:
Price ↓ but Volume ↓ → Bear trend losing strength
c. Volume in Ranging Markets
In sideways markets, volume generally remains low. A sudden volume spike during range breakout signals trend formation.
4. How to Use Volume for Trading – Practical Techniques
Technique 1: Volume Breakout Trading
Breakouts are powerful signals but also come with fake moves. Volume confirms the authenticity.
Bullish breakout confirmation:
Price breaks resistance
Volume rises above average
Candle closes above breakout level
Bearish breakout confirmation:
Price breaks support
Volume spikes downward
Close is below the support level
Without volume confirmation, breakouts often fail and trap traders.
Technique 2: Volume Divergence
Divergence occurs when price and volume move opposite.
Examples:
Price making higher highs but volume making lower highs → Bullish trend weakening
Price making lower lows but volume decreasing → Bearish trend weakening
Such divergence often signals trend reversal.
Technique 3: Volume Spike Analysis
Sudden large volume spikes can mean:
A big player entering or exiting a position
Market turning point
Start of strong trend
At market bottoms, huge buying volume often appears. At tops, big selling volume may signal reversal.
Technique 4: Using Volume with Indicators
Some popular volume-based indicators:
a. Volume Moving Average (VMA)
Shows average volume to identify when current volume is unusually high or low.
b. On-Balance Volume (OBV)
Adds volume on up days, subtracts on down days to show accumulation/distribution.
c. Volume Weighted Average Price (VWAP)
Used by institutional traders; shows average price weighted by volume.
d. Money Flow Index (MFI)
Combines price and volume to detect overbought/oversold zones.
Using these indicators with price action increases trading accuracy.
5. Volume and Candlestick Patterns
Volume adds strength to candlestick signals.
Examples:
Bullish engulfing with high volume → Strong reversal
Hammer with high volume at support → Buyers entering
Doji with high volume → Indecision among big players
Volume validates candlestick reliability.
6. Volume and Support/Resistance Levels
Support and resistance zones are crucial. Volume helps confirm their strength.
At Support:
Price touches support with low volume → Support likely to hold
Price breaks support with high volume → Strong breakdown
At Resistance:
Price hits resistance with low volume → Resistance holding
Breaks resistance with high volume → Breakout confirmed
Volume acts as the deciding factor in whether levels hold or break.
7. How Smart Money Uses Volume
Institutional traders use volume to accumulate or distribute positions quietly.
Accumulation phase:
Price stays in range
Volume gradually increases
No big price movement
This indicates smart money buying.
Distribution phase:
Price stops rising
Volume spikes at peaks
Smart money selling to retail traders
Recognizing these phases helps traders identify big trends early.
8. Common Mistakes Traders Make with Volume
a. Believing every volume spike means breakout
Volume should be analyzed with price action, not in isolation.
b. Ignoring trend context
High volume in a range is meaningless unless combined with price breakout.
c. Misreading low-volume pullbacks
These are actually healthy for trends, not signs of weakness.
d. Trading without confirming volume
Entering trades based on price alone increases risk.
9. Best Practices for Volume Trading
Compare volume with average volume, not previous candles
Combine volume with trendlines, levels, and patterns
Avoid trading false breakouts without volume confirmation
Watch volume at key supports/resistances
Use volume indicators only as a supplement
Focus on multi-timeframe volume behavior
These practices significantly improve trading accuracy.
Conclusion
Trading with volume gives traders an edge by revealing the hidden strength behind price movements. Volume confirms trends, validates breakouts, identifies reversals, and exposes the actions of big players. When used correctly with price action, support/resistance, and technical indicators, volume becomes one of the most reliable tools in trading. For both beginners and advanced traders, mastering volume analysis is essential for smart, confident, and profitable trading decisions.
Wave Analysis
Trading With AI Is Easy1. AI Simplifies Market Analysis
One of the biggest challenges in trading is understanding the market. Human traders spend hours studying charts, indicators, and historical data. AI solves this challenge by processing vast amounts of information within seconds. Machine learning algorithms can analyze:
Price trends
Volume patterns
Global news
Social media sentiment
Economic indicators
Historical correlations
This allows AI systems to provide a deeper and more accurate view of market conditions. Instead of manually reading dozens of charts, traders simply rely on AI-generated insights that highlight trends, warn of risks, and predict probable outcomes. This drastically reduces the time and effort required to make decisions.
2. AI-Powered Predictions Improve Accuracy
AI excels at recognizing patterns that humans often overlook. Advanced models such as neural networks observe millions of data points simultaneously and forecast price movements based on probability. Although AI cannot guarantee 100% accuracy, it significantly improves the reliability of predictions compared to traditional manual analysis.
For example:
AI can identify early signs of trend reversals before they appear clearly on charts.
Predictive algorithms can estimate the strength of momentum, volatility, and breakout potential.
Sentiment analysis tools can detect market mood shifts in real time.
These capabilities help traders make more informed decisions and avoid emotional pitfalls like fear, greed, and panic.
3. Automation Makes Trading Easier
AI's greatest advantage lies in automation. Automated trading—often called algorithmic trading—uses AI systems to execute trades without human intervention. Traders simply set the rules, and the AI executes them flawlessly. This leads to:
Faster order execution
Reduced slippage
Removal of emotional bias
Consistent performance
24/7 trading even when the trader is offline
Automated systems handle multiple indicators, timeframes, and markets simultaneously, something humans cannot manage manually. This makes trading easier and more efficient for both beginners and professionals.
4. AI Helps Eliminate Emotional Trading
Humans are naturally influenced by emotions such as fear, hope, and excitement. These emotions often lead to bad decisions—entering trades too early, exiting too late, or over-trading.
AI, on the other hand, is emotionless.
It operates purely on data and logic, ensuring:
Discipline
Consistency
Accuracy
Strict adherence to strategy
This helps traders avoid common psychological traps and maintain a stable, long-term approach.
5. AI Reduces the Learning Curve
For beginners, trading can feel overwhelming. Understanding technical indicators, chart patterns, and market fundamentals usually requires months of learning. AI tools simplify this process by offering:
Ready-made strategies
Automated signals
Visual dashboards
Clear buy/sell suggestions
Real-time risk assessment
Instead of learning everything manually, traders can rely on AI tools to guide them. This shortens the learning curve and makes trading accessible even to those without deep financial knowledge.
6. AI Enhances Risk Management
Risk management is the foundation of successful trading. Many traders fail not because their strategy is wrong, but because their risk management is weak. AI enhances risk control by:
Automatically adjusting position sizes
Setting optimal stop-loss and take-profit levels
Predicting potential drawdowns
Detecting high-risk market conditions
Avoiding trades during unpredictable volatility
AI’s ability to quantify and manage risk makes trading far safer and more predictable.
7. Real-Time Market Monitoring
Markets change quickly. A sudden news event can cause massive price movements. No human can monitor markets every second, but AI can. It constantly scans:
Charts
Data feeds
News
Economic calendars
Sentiment trends
AI then instantly alerts traders or automatically executes strategies. This ensures traders never miss opportunities or fail to react during major events.
8. AI Provides Personalized Trading Experience
Modern AI tools learn from each trader’s behavior. They adjust based on:
Trading style
Risk tolerance
Preferred markets
Timeframe selection
Past performance
This personalization creates a trading system that evolves over time and becomes smarter every day. Beginners get guidance, while experienced traders get advanced insights tailored to their strategies.
9. AI Supports All Markets
AI is not limited to one market. It works across:
Stocks
Forex
Cryptocurrencies
Commodities
Indices
Derivatives (options & futures)
The same AI engine can track global markets simultaneously, giving traders a diversified edge.
10. Backtesting and Strategy Optimization Become Easy
Before using a trading strategy, it must be tested. AI makes this easy by running backtests using years of historical data. It can simulate thousands of trades within minutes. Traders can instantly see:
Profit and loss potential
Drawdowns
Win rate
Strategy performance in different market conditions
AI can also fine-tune strategies by optimizing parameters automatically, producing better results over time.
11. Time-Saving and Efficient
Trading used to require hours of chart analysis daily. With AI:
Daily analysis takes seconds
Signals are instant
Trades can run automatically
Risk is calculated in real time
This allows traders to maintain their career, studies, or business while trading part-time or passively.
12. AI Levels the Playing Field
Earlier, only big institutions had access to advanced tools. Now AI technology is widely available through:
Trading platforms
Mobile apps
Cloud-based systems
Retail AI bots
Online broker tools
This gives small traders the same processing power previously available only to hedge funds.
Conclusion: Trading With AI Is Easier, Smarter, and More Accessible
AI does not eliminate all risks, and it does not guarantee profits. But it dramatically simplifies the entire process of trading by providing:
Deep market insights
Advanced predictions
Automated decision-making
Personalized strategies
Emotion-free execution
24/7 monitoring
Optimized performance
Trading will always involve uncertainty, but with AI, traders can navigate markets with far more confidence, clarity, and efficiency. AI has changed trading forever—making it easier, smarter, and more accessible for everyone.
Mastering Technical Analysis1. What Is Technical Analysis?
Technical analysis is a method of forecasting market movement by studying price charts, trading volume, indicators, and patterns. Unlike fundamental analysis—which focuses on earnings, economic data, and intrinsic value—TA assumes that all information is already reflected in the price.
At its core, technical analysis is built on three key assumptions:
1. Market action discounts everything
Every factor—economic data, news, global events—gets absorbed into price.
2. Prices move in trends
Markets do not move randomly. They follow identifiable patterns: uptrends, downtrends, or sideways ranges.
3. History repeats itself
Human behavior, fear and greed, and market psychology create recurring patterns.
These principles allow traders to anticipate moves with probability, not certainty.
2. Understanding Price Structure
a. Dow Theory Basics
Dow Theory forms the foundation of technical analysis:
Market moves in three trends: primary (major), secondary (pullbacks), and minor (small fluctuations).
Trends stay in effect until clear reversal signals appear.
Volume confirms price movement.
b. Market Trends
A trend is the direction in which prices move.
Uptrend: Higher highs (HH) + higher lows (HL)
Downtrend: Lower highs (LH) + lower lows (LL)
Sideways/Range: Price oscillates between support and resistance.
Identifying trends early is one of the biggest advantages for traders.
3. Key Elements of Technical Analysis
a. Support and Resistance
Support is a price level where buying interest dominates. Resistance is where selling pressure appears.
These levels help traders:
Time entries
Set targets
Place stop losses
Breakouts and breakdowns from these levels often indicate major moves.
b. Trendlines and Channels
Trendlines connect the lows in an uptrend and highs in a downtrend. When combined with parallel lines, they form channels, showing strong directional movement.
A break of a trendline often signals trend reversal.
c. Chart Patterns
Patterns form when price movements create recognizable shapes on charts.
Reversal Patterns:
Head and Shoulders
Inverse Head and Shoulders
Double Top / Double Bottom
Triple Tops / Bottoms
Continuation Patterns:
Flags
Pennants
Triangles
Rectangles
Chart patterns reflect collective market psychology and help forecast future direction.
4. Candlestick Patterns
Candlestick charts reveal the emotional story of buyers and sellers. Some common patterns include:
Bullish Patterns:
Hammer
Bullish Engulfing
Morning Star
Piercing Line
Bearish Patterns:
Shooting Star
Bearish Engulfing
Evening Star
Dark Cloud Cover
Combining candlestick signals with support/resistance improves accuracy.
5. Technical Indicators and Oscillators
Indicators help interpret market momentum, strength, and volatility. Although no indicator is perfect, combining a few well-selected ones enhances decision-making.
a. Moving Averages
They smooth out price movement to reveal trends.
Types:
SMA (Simple Moving Average)
EMA (Exponential Moving Average)
Common strategies:
Golden Cross (50-MA above 200-MA)
Death Cross (50-MA below 200-MA)
EMA-based trend trading
b. RSI (Relative Strength Index)
RSI measures momentum and identifies overbought (>70) and oversold (<30) conditions. It also signals divergences, which often precede reversals.
c. MACD (Moving Average Convergence Divergence)
MACD shows the relationship between two EMAs. Signals include:
Bullish or bearish crossovers
Histogram direction
Divergences
d. Bollinger Bands
These measure volatility. Price touching the upper band suggests overbought conditions; touching the lower band suggests oversold conditions. Squeezes indicate big upcoming moves.
e. Volume Indicators
Volume is essential for confirming trends.
Rising price + rising volume = strong trend
Rising price + low volume = weak trend
6. Multi-Time Frame (MTF) Analysis
Professional traders analyze charts across multiple time frames. For example:
Higher time frames (1D, 1W) show the major trend.
Lower time frames (1H, 15m) show entry opportunities.
A trade is strongest when trends align on multiple time scales.
7. Breakout and Breakdown Trading
Breakouts occur when price moves above resistance with strong volume. Breakdowns occur when price falls below support.
Successful breakout trading requires:
Volume confirmation
Retest of breakout zones
Avoiding false breakouts
8. Risk Management and Position Sizing
Mastering technical analysis is not just about reading charts. The biggest key is managing risk.
Essential rules:
Always use a stop loss
Do not risk more than 1–2% of capital per trade
Use risk-reward ratios (e.g., 1:2 or 1:3)
Trade with discipline, not emotion
Good risk management keeps you in the game long enough to experience compounding success.
9. Trading Psychology
Technical analysis is 30% charts and 70% psychology. Recognize these emotional traps:
Fear of missing out (FOMO)
Overconfidence after profit
Revenge trading after loss
Impatience and overtrading
A disciplined trader follows rules and trusts their strategy.
10. Creating Your Own Trading System
To master technical analysis, create a structured trading system:
Components of a strong system:
Market selection (stocks, indices, crypto)
Time frame (intraday, swing, positional)
Indicators (2–3 maximum)
Entry rules (breakout, pullback, pattern)
Exit rules (target, trailing stop)
Risk-reward ratios
Backtesting to validate performance
A system removes emotional decision-making and boosts consistency.
11. Combining Technical and Fundamental Analysis
While TA is powerful, combining it with fundamental catalysts—earnings, macro trends, sector strength—creates high-probability setups. For example:
Volume breakout + strong quarterly results
Trend continuation + positive economic news
This hybrid approach is used by many successful traders.
12. The Path to Mastery
Technical analysis mastery does not come overnight. It requires:
Chart practice
Backtesting historical data
Studying past cycles
Recording trades in a journal
Reviewing mistakes and refining rules
Over time, patterns become clear, and intuition develops.
Conclusion
Mastering technical analysis is a journey of learning price behavior, practicing chart reading, and developing psychological discipline. By understanding trends, patterns, indicators, and risk management, traders gain the ability to anticipate market moves with greater confidence. TA does not guarantee profits—it improves probabilities. Combined with discipline, patience, and a structured approach, it becomes a powerful skill that can transform your trading performance.

Cryptocurrency as a Digital AssetUnderstanding Cryptocurrency as a Digital Asset
A digital asset is anything stored electronically that can provide value. Examples include images, documents, software, and digital currencies. Cryptocurrency falls within this category but stands apart because it is programmable, transferable, scarce, and secured through cryptographic algorithms.
A cryptocurrency is a digital or virtual currency that uses blockchain technology and cryptography to secure transactions, verify ownership, and regulate the creation of new units. Unlike traditional money issued by governments (called fiat currency), cryptocurrencies are usually decentralized, meaning no single authority controls them.
The idea behind cryptocurrency is to create a trustless system, where people can transact securely without needing banks, payment processors, or intermediaries.
Key Features of Cryptocurrency
1. Decentralization
Most cryptocurrencies operate on a distributed network of computers (nodes) worldwide. Instead of being stored on one central server, the entire ledger of transactions is shared among thousands of participants.
This decentralized nature:
Reduces the risk of manipulation
Prevents single points of failure
Makes the system transparent and censorship-resistant
Bitcoin, for example, is maintained by a network of miners and nodes spread across the globe rather than by any government or corporation.
2. Blockchain Technology
Blockchain is the underlying technology that makes cryptocurrencies possible. It is a chain of blocks, where each block contains:
Transaction data
A timestamp
A cryptographic hash
Once data is added to the blockchain, it becomes nearly impossible to alter, ensuring immutability and security.
Blockchain acts as a public ledger. Anyone can view transactions, but identities are hidden behind cryptographic addresses, offering both transparency and privacy.
3. Cryptographic Security
Cryptocurrencies use advanced cryptography to secure transactions and control the creation of new units. Public-key cryptography ensures that:
You can share your public address safely
Only you can spend your funds using your private key
The private key acts as a digital signature, proving ownership of the asset.
4. Limited Supply and Scarcity
Many cryptocurrencies have a fixed supply, which gives them scarcity—one of the key factors that drive value.
For example:
Bitcoin has a maximum supply of 21 million coins
This scarcity creates a digital form of gold
In contrast, fiat currencies can be printed endlessly, causing inflation. Limited supply helps certain cryptocurrencies hold value over time.
5. Peer-to-Peer Transactions
Cryptocurrency enables direct transactions between users without intermediaries. This:
Reduces transaction fees
Speeds up cross-border payments
Increases accessibility for the unbanked population
A Bitcoin transaction can be sent across continents within minutes, regardless of banking systems or government restrictions.
Types of Cryptocurrencies
Cryptocurrencies can be classified based on their purpose and technology.
1. Bitcoin (BTC) – Digital Gold
Bitcoin was the first cryptocurrency, introduced in 2009 by the anonymous creator Satoshi Nakamoto. Its main purpose is to act as:
A store of value
A medium of exchange
A hedge against inflation
Bitcoin is often referred to as digital gold due to its scarcity and decentralized nature.
2. Altcoins – Alternatives to Bitcoin
Thousands of cryptocurrencies followed Bitcoin, called altcoins. Examples include:
Ethereum (ETH): A blockchain that supports smart contracts and decentralized applications (dApps)
Ripple (XRP): Focused on fast and cheap international payments
Litecoin (LTC): Faster and lighter version of Bitcoin
Each altcoin has unique features or improvements over Bitcoin.
3. Stablecoins
Stablecoins are cryptocurrencies whose value is pegged to stable assets like the US Dollar or gold. Examples:
USDT (Tether)
USDC (USD Coin)
They are widely used in trading and decentralized finance because they reduce price volatility.
4. Tokenized Assets and Utility Tokens
Many blockchains allow digital assets to be created on top of them. These tokens represent:
Access to services (utility tokens)
Ownership in projects (security tokens)
Real-world assets like real estate or stocks
Tokenization expands the use of blockchain beyond currency.
How Cryptocurrency Works as a Digital Asset
1. Creation of New Units
New cryptocurrency units are created in different ways:
Mining: Solving complex mathematical problems (Bitcoin, Litecoin)
Staking: Locking cryptocurrency to validate transactions (Ethereum 2.0, Cardano)
Algorithmic issuance: Based on demand and supply mechanisms
Mining and staking secure the network and process transactions.
2. Storing Cryptocurrency
Cryptocurrencies are stored in digital wallets, which can be:
Hot wallets: Connected to the internet (mobile or desktop apps)
Cold wallets: Offline storage (hardware wallets or paper wallets)
Wallets store private keys, not the coins themselves.
3. Transferring Ownership
A cryptocurrency transaction involves:
Sending funds from one address to another
Verifying the transaction through miners or validators
Adding it to the blockchain
This digital transfer of ownership is secure, fast, and irreversible.
Why Cryptocurrency Has Value
Cryptocurrency holds value due to several factors:
1. Scarcity
Fixed supply creates demand over time.
2. Utility
Smart contracts and decentralized applications give certain cryptocurrencies real-world use cases.
3. Decentralization
People value assets not controlled by governments.
4. Trustless System
Blockchain eliminates the need for middlemen.
5. Global Acceptance
Businesses, investors, and governments are increasingly adopting cryptocurrencies.
Advantages of Cryptocurrency as a Digital Asset
Borderless transactions
Lower fees compared to traditional banking
Secure and transparent system
24/7 market accessibility
High liquidity in major coins
Supports financial inclusion
Cryptocurrencies also introduce entirely new industries:
Decentralized finance (DeFi)
Non-fungible tokens (NFTs)
Web3 applications
Risks and Challenges
Despite advantages, cryptocurrencies face risks:
Price volatility
Regulatory uncertainties
Scams and hacks
Loss of private keys leading to loss of funds
Awareness and proper risk management are essential.
Conclusion
Cryptocurrency, as a digital asset, represents a major shift in how value is created, stored, and transferred. Powered by blockchain technology, it enables decentralized trust, global accessibility, and programmable financial systems that challenge traditional banking models. While it offers immense opportunities, it also requires careful understanding due to its risks and evolving regulatory landscape. As technology matures, cryptocurrency is likely to play an even greater role in global finance and digital ownership systems.
Plan your trades and trade your plan1. Why Planning Matters in Trading
Trading without a plan is like entering a battlefield without a strategy. Markets are unpredictable, influenced by global events, economic data, institutional activity, and trader psychology. Without a plan, emotions such as fear, greed, and impatience take over, resulting in poor decisions.
A well-crafted trading plan helps you:
Reduce emotional decision-making
Identify high-probability setups
Manage risks professionally
Improve consistency
Evaluate and improve your performance over time
Planning creates a roadmap. Instead of reacting impulsively, you follow a set of rules designed specifically for your trading style and risk tolerance.
2. Define Your Trading Goals
Every trader must begin with clear goals. Ask yourself:
Do you want steady short-term gains or long-term wealth building?
Are you trading to supplement income or become a full-time trader?
What is your acceptable level of risk?
Setting goals helps determine the market you trade, your strategy, time commitment, and expectations. For example:
Intraday traders focus on daily volatility and need quick decisions.
Swing traders hold trades for days or weeks.
Positional traders rely more on long-term charts and fundamental strength.
Your trading plan should reflect your goals and lifestyle. If you cannot monitor markets all day, intraday trading is unsuitable; swing or positional trading is better.
3. Choose Your Market and Instruments
Planning involves knowing what you will trade:
Stocks
Indices (Nifty, Bank Nifty)
Commodities (Gold, Crude oil)
Forex
Crypto
Futures & Options
Each market behaves differently. For example, Bank Nifty is highly volatile and suits active traders, while large-cap stocks suit long-term positional trades. By focusing on a specific market, you develop familiarity and improve accuracy.
4. Develop a Strategy
Your trading plan must include a clear strategy with defined rules. A strategy answers:
When to enter
When to exit
How to manage risk
How to manage position size
For example, a simple breakout strategy may include:
Setup: Stock consolidates near resistance
Entry: Buy above breakout candle high
Stop-loss: Below consolidation zone
Target: 1:2 or 1:3 risk–reward ratio
Alternatively, a swing strategy might use:
Moving averages
RSI divergence
Candlestick confirmation
Support/resistance zones
The key is not the complexity of the strategy, but consistency in applying it.
5. Set Clear Entry and Exit Rules
No trade should be taken without predefined rules.
Entry Rules
An entry rule should be objective. Example:
Price closes above 20-day high
Volume is above average
RSI crosses above 50
Trend is supported by higher highs and higher lows
Entry should never be based on rumors, tips, or fear of missing out.
Exit Rules
A disciplined trader exits based on:
Pre-set stop-loss
Target levels
Trail stop-losses
Trend reversals
Exit rules prevent emotional decisions. Even if the market reverses, you stick to your plan.
6. Risk Management: The Heart of Planning
Risk management decides whether you survive in the market. Many traders lose money because they ignore this step.
Key Components of Risk Management
a) Stop-Loss
A stop-loss is mandatory for every trade. It limits the loss when the market moves against you.
b) Position Size
Never risk more than 1–2% of your capital on a single trade.
Example:
If your capital is ₹1,00,000, risk per trade should be ₹1,000–₹2,000.
c) Risk–Reward Ratio
A healthy risk–reward ratio (RRR) ensures long-term success.
Minimum acceptable ratio: 1:2
Meaning: If you risk ₹100, aim to earn ₹200
Good traders focus on trades with high RRR instead of trying to win every trade.
7. Market Analysis Before Entering
Before you take a trade, analyze:
a) Trend
Trade with the trend:
Uptrend → Look for long positions
Downtrend → Look for shorts or avoid longs
b) Support and Resistance
Identify levels where price is likely to react.
c) Volume Analysis
Volume confirms the strength of the move.
d) Chart Patterns
Double bottoms, flags, triangles, and head & shoulders provide high-probability setups.
e) Candlestick Patterns
Hammers, engulfing candles, and dojis offer confirmation signals.
8. Maintain a Trading Journal
A trading plan is incomplete without a trading journal. Record:
Date and time
Entry and exit
Stop-loss and targets
Reason for trade
Emotions before and after
Outcome and learnings
A journal reveals patterns in your behaviour—emotional trades, overtrading, revenge trading—and helps improve performance.
9. Avoid Emotional Trading
Emotions destroy consistency. Common emotional mistakes include:
Fear of missing out (FOMO)
Greed (holding too long)
Fear (exiting too early)
Revenge trading
Overconfidence after a winning streak
Your goal is to follow your plan, not your feelings. With a plan, you avoid impulse trades and maintain discipline.
10. Backtest and Practise Your Trading Plan
Before using real money, test your strategy on historical data. Backtesting helps determine:
Profitability
Accuracy
Maximum drawdown
Risk–reward performance
Paper trading (demo trading) strengthens confidence and skill before risking capital.
11. Review and Improve Your Plan Regularly
Markets evolve. A trading plan should be dynamic.
Review monthly or quarterly:
Win-loss ratio
Average return
Maximum loss
Psychological mistakes
Strategy performance
Adjust your plan when necessary. Improvements may include:
Better entries
Tighter stop-loss
Reduced position size
Using trailing stops
Focusing on fewer, higher-quality setups
12. Final Thoughts: Discipline Creates Success
A well-crafted trading plan is your foundation. Everything else—charts, indicators, and setups—comes secondary. A plan helps you stay consistent, disciplined, and focused. Remember:
You cannot control the market
You can control your behaviour
The most successful traders are not those with the most complex indicators, but those who follow their plan with discipline every single day.

Part 7 Trading Master Class With Experts Non-Directional Strategies
Used when markets are expected to be sideways or volatile.
1. Straddle (Buy Call + Buy Put)
Profit from high volatility in any direction.
2. Strangle
Cheaper version of straddle, using OTM options.
3. Iron Condor
Sell OTM call and put spreads.
Used for stable markets to earn premium.
4. Butterfly Spread
Low-cost strategy for low volatility expectations.
These strategies help traders benefit from volatility, time decay, and neutral price movements.

Part 6 Learn Institutional TradingTypes of Options Strategies
Option strategies are divided into two broad categories:
- Directional Strategies
Used when you expect the market to move strongly in one direction.
1. Long Call
Profit from big upward moves.
2. Long Put
Profit from major downward moves.
3. Bull Call Spread
Buy call + Sell call (higher strike)
Reduces cost and risk.
4. Bear Put Spread
Buy put + Sell put (lower strike)

Part 3 Learn Institutional Trading 1. Option Buying Risks
High time decay
Entire premium can be lost
Low probability of profit if market does not move fast
2. Option Selling Risks
Unlimited loss potential
Requires high margin
Needs strong risk management skills
3. Volatility Risk
Changes in implied volatility affect premium prices.
4. Liquidity Risk
Low liquidity leads to poor fill prices.
5. Emotional Risk
Options move fast, causing psychological stress for beginners.
Thus, risk management, position sizing, and discipline are essential.

Premium Chart Pattern Understanding Chart Patterns
Every chart pattern represents crowd psychology—fear, greed, uncertainty, accumulation, or distribution. Institutional traders leave their footprint on charts, and patterns help retail traders align with their moves.
Patterns are formed across all time frames:
1-minute charts for scalping
5–15 minutes for intraday
1 hour for swing trading
Daily/weekly charts for positional trading
The bigger the time frame, the more reliable the pattern.

Smart Loss Management Guide in the Trading Market1. Why Loss Management Is More Important Than Profit-Making
Most new traders focus on making money and ignore risk control. But experienced traders know that your downside determines your survival. If capital is destroyed early, even a good trading system cannot help. Here’s why loss management matters:
Capital Preservation: If you lose 50% of your account, you need a 100% gain to recover. Avoiding deep drawdowns is essential.
Consistency Over Luck: A trader with average profits but disciplined risk control will outperform an aggressive trader without rules.
Uncertainty of Markets: Even the best strategies have losing streaks. Smart loss management keeps you disciplined during uncertain phases.
Simply put, losing small and winning medium-to-large is the essence of profitable trading.
2. Key Principles of Smart Loss Management
2.1 Risk Per Trade Rule
Professional traders follow a simple rule:
Risk only 1–2% of trading capital per trade.
This ensures that even after 10 losing trades in a row, your capital stays strong. A 1% rule means:
If your capital = ₹1,00,000
Max loss per trade = ₹1,000
This protects you from emotional decisions and ensures controlled drawdowns.
2.2 Position Sizing
Position size determines how much quantity you buy or sell. It must be based on:
Stop-loss distance
Capital
Risk per trade percentage
Formula:
Position Size = Risk Amount / Stop-Loss Distance
Example:
Capital = ₹1,00,000
Risk per trade = 1% = ₹1,000
Stop-loss = 5 points
Position size = 1000 / 5 = 200 quantity
This keeps your risk uniform across trades.
2.3 Placing Effective Stop-Loss Orders
Not all stop-losses are equal. Smart traders use:
Technical stop-loss: based on chart levels (support, resistance, swing high/low).
Volatility-based stop-loss: dynamic stops using ATR (Average True Range).
Time-based stop-loss: exit if trade doesn’t work within a fixed time window.
Avoid placing stops too close, which results in premature exits.
2.4 Avoiding Averaging Down
Many traders double their position when price goes against them thinking it will “bounce back”.
This is dangerous.
Averaging down increases exposure when your analysis is already wrong. Professional traders do the opposite—they scale out or exit.
2.5 Maintain Reward-to-Risk Ratio
Every trade must have a minimum Risk-to-Reward (RR) ratio of 1:2 or 1:3.
Example:
If risk = ₹1,000
Target should be ₹2,000 or ₹3,000
This ensures that even with a 40% win rate, you remain profitable.
3. Psychological Pillars of Smart Loss Management
Market losses are emotionally painful. Most poor decisions come from emotions like fear, hope, greed, and frustration. Smart traders master the psychology of loss.
3.1 Accept That Losses Are Normal
Every trader—beginner or expert—has losing trades. Accepting losses helps:
Reduce revenge trading
Maintain discipline
Focus on process, not outcome
3.2 Don’t Take Losses Personally
A losing trade is not a failure of your personality. It is simply part of the game. Traders who attach ego to trades often avoid closing losing positions, leading to bigger losses.
3.3 Control Overtrading
After a loss, many traders try to recover immediately. This emotional urge leads to irrational decisions. Smart loss management requires:
Stop trading after big loss
Follow pre-defined trade limits
Reset emotionally before next trade
3.4 Develop Emotional Discipline
The best loss management tool is self-control. This includes:
Sticking to stop-loss
Avoiding impulsive orders
Following a checklist before entering trades
Discipline converts a strategy into consistent profits.
4. Techniques for Smart Loss Management
4.1 Use Trailing Stop-Loss
Trailing stops help protect profits as the trade moves in your favor. For example:
If trade goes 20 points up, move stop-loss to breakeven
If trade goes 40 points up, trail stop to +20
This locks in gains and avoids giving back profits.
4.2 Hedging Positions
Advanced traders use hedging techniques like:
Options hedging (buying puts to protect long positions)
Futures hedging
Ratio spreads
Hedging reduces the impact of sudden volatility or news events.
4.3 Diversify Trades
Avoid putting all your capital into one trade or one sector. Diversification ensures:
Reduced exposure
Stable overall performance
Lower emotional pressure
But don't over-diversify; focus on 4–8 quality trades.
4.4 Use a Daily Loss Limit
Set a maximum daily loss that stops you from trading further.
Example:
Daily Max Loss = 3% of capital
If you hit that limit, stop trading for the day.
This prevents emotional breakdowns and unnecessary revenge trades.
4.5 Create a Trading Journal
Record:
Entry and exit
Stop-loss
Reason for trade
Emotional state
Reviewing your journal reveals patterns, mistakes, and ways to refine your strategy.
5. Common Mistakes to Avoid
5.1 Moving Stop-Loss Further Away
Traders sometimes shift stop-loss thinking the market will reverse. This is a mistake. A stop-loss must be respected at all times.
5.2 Trading Without a Defined Exit
A trade without a clear exit strategy becomes a gamble. Smart traders pre-plan both stop-loss and target.
5.3 Ignoring Market Conditions
A strategy that works in trending markets may fail in sideways markets. Loss management includes reducing position size during choppy or news-heavy environments.
5.4 Emotions-Based Position Sizing
Increasing lot size after a win or reducing after a loss emotionally disturbs risk management. Position size must always be formula-based.
6. Building Your Smart Loss Management System
Step 1: Define Your Risk Rules
Risk per trade, daily loss limit, maximum open trades.
Step 2: Create Position Sizing Formula
Based on stop-loss distance and capital.
Step 3: Pre-Plan Stop-Loss Levels
Technical, volatility-based, or time-based.
Step 4: Maintain a Journal
Track mistakes, patterns, and improvements.
Step 5: Maintain Emotional Discipline
Follow rules no matter what the market does.
7. Conclusion
Smart loss management is the foundation of profitable trading. Markets reward discipline, not emotion. By controlling risk, using effective stop-loss techniques, maintaining psychological discipline, and applying structured methods, traders protect their capital and grow consistently over time. Every successful trader understands that losses are unavoidable, but big losses are preventable. With a strong loss management system, you turn volatility from a threat into an opportunity and ensure you remain a long-term player in financial markets.
Part 2 Ride The Big Moves Why Option Selling is Popular
Option selling is preferred because:
Time decay works in seller’s favour
Most options expire worthless
Sellers act like insurance companies
They earn small but consistent profits
But selling requires high capital and strict risk management.

Part 1 Ride The Big Moves Intraday Option Trading
Focus on momentum
Quick scalping
Uses volume, market structure
Greeks change rapidly
Risk high due to volatility
Positional Option Trading
Based on swing analysis
Uses spreads and hedged strategies
Requires understanding of Theta and Vega
Preferred for hedging and income generation

Part 2 Intraday Master Class1. Option Buying
Low capital
Limited risk
Unlimited profit
Requires strong movement
Suffers from time decay
2. Option Selling
High capital
Limited profit (premium)
High or unlimited risk
High probability trades
Theta decay works in favor

PCR Trading Strategies Call Buyer
Pays premium
Expects price to go up
Risk limited to premium
Profit unlimited
Call Seller
Receives premium
Expects price to stay flat or go down
Profit limited to premium
Risk potentially unlimited

HOW TO FIND ENTRY POINT IN ANY STOCKstock moves in form of wave...after completion of wave we have given retrace method to find out entry point in any stock.

Part 2 Master Candle Stick PatternsWhat Drives Option Prices Intraday?
Several factors affect option prices every minute:
1. Underlying price movement (Delta)
2. IV changes (Vega)
3. Time decay (Theta)
4. Liquidity
5. Market sentiment
6. Hedge adjustments by institutions
Understanding these micro-dynamics helps you avoid false breakouts.

Part 2 Support and ResistanceOption Premium Breakdown – Intrinsic vs Extrinsic
1. Intrinsic Value
Actual value if exercised TODAY.
For Call: Spot – Strike (if positive)
For Put: Strike – Spot (if positive)
2. Extrinsic (Time + Volatility)
Value due to time left + expectations.
This is where traders either make or lose money.

Part 1 Support and ResistanceBuyer vs Seller (Writer): The Battle
Every option trade has two sides:
Option Buyer Option Seller
Pays premium Receives premium
Limited loss Limited profit
Unlimited profit Unlimited risk (if naked)
Needs movement Makes money without movement
Option buyers need direction + momentum.
Option sellers need time + stability.
About 70–80% of options expire worthless, which is why many traders prefer selling over buying.

Part 12 Trading Master Class With ExpertsMoneyness of Options
Options are classified as:
In the Money (ITM)
At the Money (ATM)
Out of the Money (OTM)
Call Options
ITM: Stock price > Strike price
ATM: Stock price = Strike price
OTM: Stock price < Strike price
Put Options
ITM: Stock price < Strike price
ATM: Stock price = Strike price
OTM: Stock price > Strike price
Moneyness affects premium value, risk, and probability of profit.

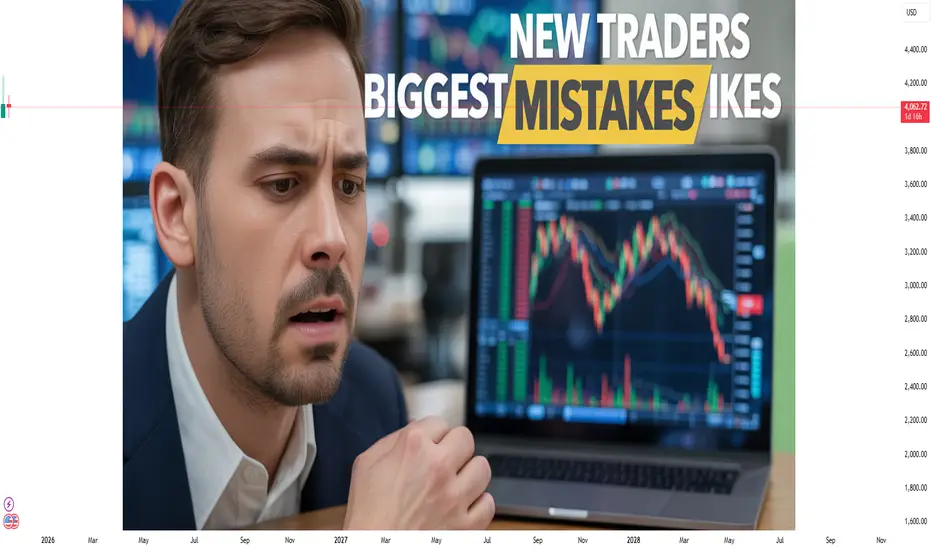
New Traders’ Mistakes That They Should Avoid1. Trading Without a Proper Plan
One of the biggest and most common mistakes is trading without a plan. Many beginners jump into the market based on tips, social media signals, or impulses. They take trades without having clear entry criteria, stop-loss levels, or profit targets. Trading without a strategy is like driving without direction—you may reach somewhere, but not where you intended.
A good trading plan should include:
Market selection (stocks, forex, commodities, crypto, etc.)
Timeframe you want to trade
Entry and exit conditions
Risk management rules
Position sizing
Maximum daily or weekly loss limit
A plan provides structure and minimizes emotional decisions.
2. Ignoring Risk Management
Risk management is the backbone of successful trading, yet beginners often overlook it. Many new traders risk too much on a single trade or avoid using stop-loss orders because they are “sure” the price will move in their favor.
Typical risk-management mistakes include:
Risking more than 2% of account capital per trade
Not placing a stop-loss
Moving the stop-loss further away to avoid exiting
Using high leverage without understanding it
Effective risk management ensures that a few losing trades don’t destroy your entire account. Professionals understand that preservation of capital is more important than chasing big profits.
3. Overtrading and Revenge Trading
New traders often feel pressured to be in the market constantly. Overtrading happens when traders take too many trades, even when there is no clear setup. This usually leads to emotional decisions and unnecessary losses.
Another related mistake is revenge trading, where traders try to quickly recover losses by placing impulsive trades. This behavior results in even bigger losses.
To avoid this, trade only when your setup appears. Quality beats quantity.
4. Letting Emotions Drive Decisions
Trading is a psychological game. Fear, greed, hope, and frustration are powerful emotions that influence new traders. Examples include:
Greed leading to holding positions too long
Fear preventing you from entering a good setup
Hope making you avoid closing a losing trade
Frustration causing revenge trades
Emotions cloud judgment and break discipline. Successful traders follow logic, not feelings. Practicing discipline and sticking to your plan is key to long-term success.
5. Using Too Much Leverage
Leverage amplifies gains—but also losses. New traders are often attracted to high leverage because it allows larger positions with small capital. However, even small market movements can wipe out the account.
For example, in forex or futures, 1:50 or 1:100 leverage can be extremely risky if not used properly.
To avoid this mistake:
Start with low leverage
Use proper position sizing
Understand margin requirements and liquidation risk
Smart traders treat leverage like a sharp tool—useful, but dangerous if mishandled.
6. Not Keeping a Trading Journal
Most beginners take trades and move on without analyzing what went right or wrong. Without a trading journal, you cannot identify patterns in your behavior or strategy.
A trading journal should record:
Date and time of entry
Chart screenshot
Entry/exit price
Stop-loss and target
Result of the trade
Emotions and reasoning behind the trade
This habit helps improve discipline and refine your system.
7. Following Tips, Noise, and Social Media Signals
Many new traders rely on tips from friends, influencers, Telegram groups, or YouTube videos. The problem is that most of these sources do not explain the logic behind the trade or the risk involved. Acting on tips without understanding the market leads to blind trading and quick losses.
Instead:
Learn technical and fundamental analysis
Understand the reason behind every trade
Follow a tested strategy, not random opinions
Smart traders trust data, not noise.
8. Unrealistic Expectations of Fast Wealth
The biggest psychological trap for new traders is the belief that trading will make them rich quickly. This mindset pushes traders to take oversized risks, leading to frequent blow-ups.
Successful trading requires:
Years of learning
Discipline and emotional control
Proper risk management
Realistic expectations
Think long-term and focus on consistency rather than big, quick profits.
9. Not Understanding Market Conditions
Markets don’t behave the same every day. Sometimes they trend strongly; other times they move sideways or show high volatility. New traders often use the same strategy in all market conditions, leading to losses.
Understanding market phases helps you adapt your strategy. For example:
Trending markets favor breakout or trend-following strategies
Sideways markets favor range trading or mean reversion
High volatility requires wider stop-loss and smaller positions
Adapting to market conditions drastically improves performance.
10. Lack of Patience
Patience is a superpower in trading. New traders often:
Enter too early
Exit too early
Fail to wait for confirmation
Want every trade to be profitable instantly
Markets reward patience and punish impulsiveness. Waiting for the perfect setup improves win rates and reduces unnecessary losses.
11. Not Practicing on Demo/Backtesting
Many beginners jump straight into live trading without testing their strategy. This is like flying a plane without training. Practicing on a demo account helps you understand:
Market movements
Platform functions
Strategy performance
Emotional reactions
Backtesting on historical data helps validate your strategy’s reliability.
12. Ignoring News and Economic Events
Major economic events—like interest rate decisions, CPI data, jobs reports—can cause sharp market movements. Beginners often get trapped when they trade unknowingly during high-impact events.
Always check the economic calendar before entering a trade.
Conclusion
New traders often fail not because markets are impossible, but because they repeat common, avoidable mistakes. Success in trading comes from discipline, risk management, continuous learning, and emotional control. By avoiding the mistakes listed above and building a strong foundation, new traders can gradually develop the skills required to navigate the financial markets confidently.
Premium Chart Patterns Introduction: Chart patterns are visual formations on price charts that help traders understand market behaviour. They show how buyers and sellers are interacting and where the price might move next. These patterns repeat over time, so traders use them to predict breakouts, trend reversals, and continuation of trends.
Chart patterns are mainly divided into Reversal Patterns, Continuation Patterns, and Bilateral Patterns.
1. Reversal Chart Patterns
Reversal patterns indicate that the current trend is about to change direction. If the market is going up, a reversal pattern may signal a fall. If the market is falling, it may warn of an upcoming rise.
2. Continuation Chart Patterns
These patterns show that the ongoing trend will continue after a short pause or consolidation.
3. Bilateral Chart Patterns
These patterns indicate a possible breakout in either direction.

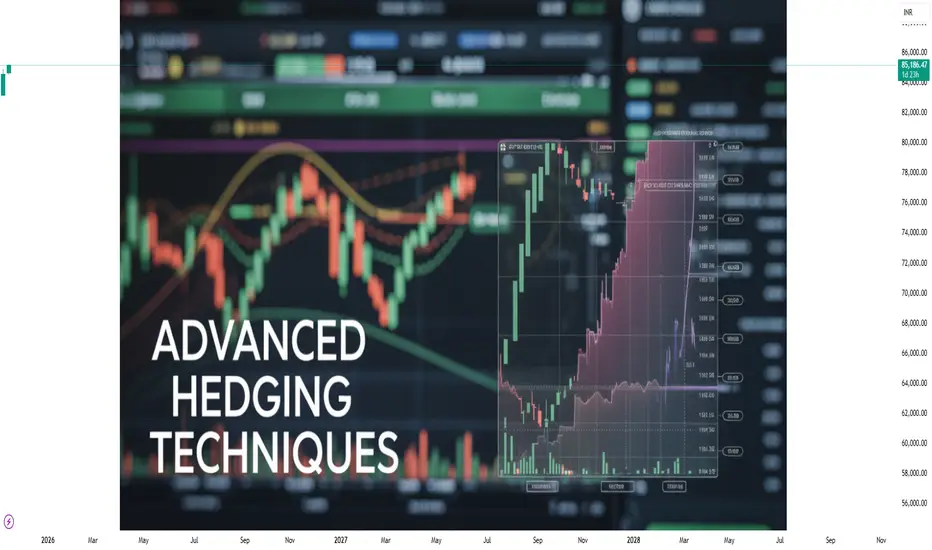
Advanced Hedging Techniques1. What Makes Hedging “Advanced”?
Basic hedging uses straightforward tools like:
Buying puts to protect long positions
Selling futures against a portfolio
Using simple covered calls
Advanced hedging goes several steps deeper, using:
Multi-leg derivatives
Volatility-based adjustments
Dynamic delta/gamma balancing
Cross-asset risk offsets
Market-structure aligned protection
Time decay and IV crush advantage
Partial, rolling, and ratio hedging
The idea is simple: Instead of eliminating risk completely, advanced hedging balances risk and return to improve profitability over time.
2. Dynamic Delta Hedging
One of the core concepts in advanced hedging is delta hedging, primarily used by option writers, institutions, and algorithmic traders.
How it works:
Every option has delta, which measures how much the option’s price moves relative to the underlying.
A trader continuously adjusts futures or stock positions to keep the overall delta close to zero.
For example:
You sell a call option with delta +0.4
To hedge, you short 40 shares (or equivalent futures)
As the market moves, delta changes, so you rebalance (buy/short) to stay delta-neutral.
Why it’s advanced:
Requires constant monitoring
Involves forecasting volatility shifts
Needs strong understanding of Greeks
Delta hedging is the backbone of market-neutral strategies, used heavily by HFTs, prop desks, and market makers.
3. Gamma Scalping
Gamma scalping is an advanced extension of delta hedging.
Key idea:
When you buy options, you gain positive gamma.
Positive gamma lets you profit from intraday price swings, provided you adjust delta actively.
Example:
You buy a straddle (long gamma).
When market moves up, you sell futures at higher price.
When market dips, you buy futures at lower price.
Even if the option decays, this scalping around volatility can outperform theta loss.
Why advanced?
Requires rapid execution and discipline
Depends on volatility forecasts and market structure
Works best in high VIX environments
Many algorithmic strategies use gamma scalping to capture volatility spikes.
4. Ratio Hedging
Instead of a 1:1 hedge, advanced traders use ratio hedging to reduce cost and maximize coverage efficiency.
Example
You hold:
100 shares of a stock
Instead of buying 1 put, you buy:
0.75 puts (3/4th hedge) to reduce premium cost
Or in F&O:
You hedge an equity portfolio with Nifty futures at 0.7 ratio
This covers systemic risk while leaving room for upside.
Why it’s useful:
Cheaper than full hedging
Maintains bullish bias
Helps outperform in rising markets
Professional hedgers rarely hedge 100%—they target optimal hedge ratio, statistically between 0.5 to 0.8.
5. Calendar (Time-Based) Hedging
This technique uses different expiry cycles to hedge positions.
Example
Long monthly futures
Short weekly futures
Or long far-month options and short near-month options
This helps exploit:
Time decay differences
Volatility mispricing
Event-driven risk (Budget, RBI policy, earnings)
Effectiveness:
Calendar hedging allows traders to create income from theta while keeping long-term directional protection.
6. Volatility Hedging (Vega Hedging)
For traders dealing with events like:
Elections
Monetary policy
Global uncertainty
Result season
Volatility hedging becomes essential.
How Vega hedging works:
You neutralize exposure to changes in implied volatility.
Example:
Short straddle = short vega
To hedge, you buy options with similar vega but different strikes or expiries
Or use VIX futures to counter volatility spikes
Why advanced?
Vega moves are unpredictable and can explode during sudden news. Vega hedging is crucial for premium sellers.
7. Cross-Asset Hedging
Institutions and advanced traders hedge positions using different but correlated assets.
Examples:
Hedge HDFC Bank equity risk using Bank Nifty futures
Hedge crude oil exposure with USDINR (as crude affects currency)
Hedge Nifty positions with SGX/GIFT Nifty
Hedge IT stocks using Nasdaq futures
Hedge gold with USD or 10-year bond yields
Why it works:
Market correlations are powerful, especially in globalized trading.
Cross-asset hedging reduces:
Volatility shock
Black swan impact
Sectoral divergence
8. Protective Options Structures
Instead of buying simple puts, advanced traders use multi-leg structures to reduce cost and improve payoff.
a) Collar Hedge
Long stock
Long put
Short call
Reduces cost of put = low-cost downside protection.
b) Put Spread Hedge
Buy ATM put
Sell OTM put
Lower cost than outright put, ideal for event hedging.
c) Synthetic Futures
Long call + short put
or
Short call + long put
Used to replicate or hedge futures efficiently.
d) Risk Reversal
Sell OTM call
Buy OTM put
Used extensively by institutions during bearish phases.
These structures protect against downside while keeping cost manageable.
9. Tail-Risk Hedging
Tail-risk hedging protects against rare, unexpected, but massive crashes (e.g., COVID crash, 2008, sudden geopolitical tension).
Popular tools:
Deep OTM puts
VIX futures / options
Long strangles on low IV days
Black Swan hedges (long gamma long vega)
Though expensive, tail hedging saves portfolios during extreme volatility.
10. AI-Driven Hedging Models
Modern hedging integrates machine learning for:
Volatility prediction
Correlation breakdown detection
Regime identification
Market-structure shifts
Auto delta/gamma adjustments
AI-based hedging can:
Reduce reaction time
Improve precision
Adjust dynamically to liquidity
Detect early signs of volatility expansion
This is used heavily by institutional options desks and large quant funds.
11. Market-Structure Based Hedging
Advanced traders hedge based on:
Liquidity zones
POC levels
Volume profile
VWAP zones
Break of structure (BoS)
Premium/discount zones
For example:
Hedging when price approaches a high-volume node
Hedging intraday longs near previous day high liquidity traps
Scaling hedges based on market structure weakness
This creates context-based hedging, not blind hedging.
12. Rolling Hedges
Instead of static positions, advanced traders roll hedges:
To next strike
Next expiry
Different ratio
Different structure
Rolling helps:
Lock profits on hedges
Reduce premium cost
Maintain continuous risk protection
Adjust to trend changes
Example:
Your protective put becomes profitable after a fall
→ Roll down and capture gains while maintaining coverage.
Conclusion
Advanced hedging is not about eliminating risk—it’s about controlling it intelligently. From delta-gamma management to cross-asset protection, option structures to AI-driven adjustments, the goal is simple: survive volatility, protect capital, and ensure consistent profitability.
Technical Market Explode1. What Is a “Technical Market Explosion”?
A “market explosion” refers to a rapid price breakout driven purely by technical triggers—no fundamental news is required.
It typically includes:
A sudden spike in bullish or bearish momentum
Breakout from a key technical zone
Large volume expansion
Wide-range candles
Fast movement toward next liquidity zones
High volatility and increased trader participation
This is the type of move that surprises many traders because price travels faster than normal and often exceeds expected levels.
2. What Causes a Technical Market Explosion?
(A) Breakout from Key Support/Resistance Zones
When price is stuck inside a range, buyers and sellers accumulate their orders. Once price breaks the range, trapped traders exit, and new participants join the move.
This results in:
Short-covering or long liquidation
Fresh momentum
Increased volatility
This combination sparks explosive movement.
(B) Market Structure Shift
A technical explosion often begins with a market structure change, usually identified by:
Higher high + higher low (bullish shift)
Lower low + lower high (bearish shift)
Break of trendline
Break of previous swing high/low
Once market structure shifts, technical traders jump in, creating momentum that pushes price aggressively.
(C) High Volume Breakouts
Volume is the fuel behind explosive moves.
When a resistance is broken with 3–4x above-average volume, the breakout is genuine.
Volume tells us:
Institutional participation
Less chance of false breakout
Strong follow-through
High volume acts as confirmation that the move is real.
(D) Liquidity Hunting and Stop Loss Triggers
Behind every explosive move is a series of stop orders placed by traders.
For example:
When price breaks resistance, short sellers’ stop-losses get hit → leads to panic buying
When price breaks support, long traders’ stop-losses trigger → leads to panic selling
This creates automatic order flow, pushing prices further and fueling the explosion.
(E) Imbalance and Fair Value Gaps
In modern technical analysis (especially Smart Money Concepts), explosive moves originate from imbalances.
These appear as:
Large bullish or bearish candles
Gaps between price levels
Very fast moves due to no opposite orders
When an imbalance occurs, price often travels fast without pullbacks, creating the explosive effect.
(F) Breakout of Consolidation Zones
Before every big move, price usually consolidates because:
Market is building orders
Institutions are accumulating
Traders are waiting for direction
Suddenly breaking out of a long consolidation zone results in a strong directional rally.
3. Technical Indicators Behind Market Explosions
(1) Moving Averages (MA & EMA)
Explosive moves commonly happen during:
Golden Cross (50 EMA > 200 EMA)
EMA breakout (price breaks above 20 or 50 EMA with volume)
Retest of EMA support
MAs align trend, confirming power.
(2) RSI + Momentum Indicators
Before a big explosion, RSI often shows:
Bullish divergence
Oversold reversal
Strong momentum above 60
Bearish divergence in downtrends
Momentum indicators help traders anticipate sharp moves.
(3) Volume Profile
Volume Profile reveals zones of:
High liquidity (value areas)
Low liquidity (low-volume nodes)
When price enters a low-volume zone, it travels very fast, causing explosive moves.
(4) Bollinger Bands Expansion
Before a market explodes, Bollinger Bands typically:
CONTRACT → volatility squeezes
Then EXPAND → breakout move begins
This is known as the Bollinger Band Squeeze breakout.
(5) MACD Crossover
MACD crossovers confirm trend strength.
A powerful MACD crossover above the zero line often signals:
Strong bullish explosion
Trend continuation
Institutional involvement
4. Chart Patterns That Lead to Explosive Market Moves
(A) Triangle Breakout
Symmetrical Triangle
Ascending Triangle
Descending Triangle
These patterns store compression.
When breakout happens → price explodes.
(B) Cup and Handle
This pattern is known for strong post-breakout rallies, often leading to multi-week explosive trends.
(C) Flag and Pennant Patterns
These are continuation patterns.
When breakout happens:
Momentum increases
Volume increases
Price explodes towards next target
(D) Double Bottom or Double Top Breakouts
When neckline breaks → explosion occurs due to aggressive traders piling in.
5. Institutional Trading and Market Explosions
Technical explosions are heavily influenced by institutional traders, who generate:
Large order blocks
Big liquidity shifts
Volume spikes
Long-range impulsive moves
Institutions often accumulate quietly, then trigger big moves that retail traders interpret as “explosive”.
6. Trader Psychology Behind Explosive Moves
A market explosion is powered by emotional reactions:
Fear of missing out (FOMO)
Panic buying/panic selling
Forced stop-loss exits
Momentum chasing
Quick profit-booking
These emotional behaviours create rapid price movement.
7. How Traders Identify a Technical Market Explosion Before It Happens
To predict explosion moments, traders watch for:
Squeeze or compression in price
Sharp increase in buying or selling pressure
Volume begins rising
Breakout from structure
Liquidity zones nearby
Imbalances in market
Momentum indicators turning positive
When all these align, the probability of a market explosion becomes extremely high.
8. How To Trade a Technical Market Explosion
Entry Strategies
Enter on breakout candle close
Enter after retest
Enter on volume confirmation
Enter on EMA bounce
Stop-Loss Placement
Below breakout zone
Below retest level
Below previous swing lows
Profit Targets
Next resistance level
Fibonacci extensions
Volume profile high-volume nodes
Risk Management
Explosive moves can reverse quickly; use:
1:2 or 1:3 risk-reward
Trailing stop-loss
Partial profit booking
9. Examples of Explosive Moves in Markets
Indices breaking all-time highs
Stocks breaking multi-month resistance
Commodity surges after long consolidation
Small-cap stocks breaking out on high volume
Each explosive move follows the same technical principles described above.
Conclusion
A technical market explosion is one of the most profitable and exciting events in trading. It results from a combination of chart patterns, volume expansion, liquidity hunts, market structure shifts, and trader psychology. Traders who understand these elements can anticipate explosive moves before they occur and enter early with confidence.