Most Probable Move in SilverLong term Silver is bullish with some saturation at top.
We can expect slow time based correction or sharp price bases correction (With the help of an economic event).
Until then we can ride the sentiment, Silver has turned Bullish on smaller timeframe too, so we can buy on dip until structure turns bearish.
Keeping that in mind, I’m sharing 4 most probably path that Silver can take.
Our decision will depend on reaction of Silver at these price levels and at our points of interest.
Wave Analysis

Nifty Pending Demand ZoneNifty is showing negativity, however there’s one unmitigated demand zine pending.
If we get a solid reaction from here, then we can start riding longs.
If we can get a smaller timeframe ChoCh then even better.
Until then wait, don’t jump into shorting yet.

Silver Ready?As discussed last time, there was a lot of liquidity below. Silver has taken it out.
Now Silver is also reacting from an unmitigated point of interested.
We’ve also got smaller timeframe ChoCh.
Overall looks good for long.
Any further fall means time to avoid Silver for a while.

Nifty long confirmation Currently Nifty is reacting from a demand zone, for confirmation we’ll need to wait for change of character.
Once smaller timeframe is also bullish, we can take longs on retest of breakout area or any smaller timeframe demand zone in discount zone.
*Taking confluence of GIFT Nifty and Nifty.*

Gold has strength Gold has multiple pending demand zone and also rising steadily
These are the most probable path that Gold can follow, either way it can continue going up.
Until any major structure shift, it’s a buy on dip.

NIFTY is following the planLooking strong near recent demand zone after ChOCh.
Can see longs from here on, good reaction and support.

Silver looks stableSilver is still looking strong, getting good reaction from the recent demand zone, keep looking out for longs until we get any ChOCh or MSS.
After MSS, we can look out for liquidity hunt.
But until then, staying long.

NIFTY : Trading levels and Plan for 14-Jan-2026📊 NIFTY Trading Plan – 14 Jan 2026
Timeframe: 15-min
Gap Consideration: 100+ points
Market Context: Short-term corrective structure with defined intraday support & resistance
🔼 SCENARIO 1: GAP UP OPENING (100+ points) 🚀
If NIFTY opens above 25,816, it indicates bullish intent toward the previous supply area.
Immediate focus will be on 25,816 (Opening Resistance).
Sustained price action above 25,816 with volume can trigger short-covering.
Upside targets:
• 25,921 (Last Intraday Resistance)
• Partial profit booking recommended near resistance.
Rejection near 25,816–25,921 zone may lead to intraday pullback.
📌 Options Strategy (Gap-Up):
• Bull Call Spread (Buy ATM CE, Sell OTM CE)
• Avoid aggressive naked CE buying near resistance
• Trail stop once premium doubles 📈
➡️ SCENARIO 2: FLAT / RANGE OPENING ⚖️
If NIFTY opens between 25,672 – 25,816, expect consolidation and option decay.
This zone acts as Opening Support/Resistance (No Trade Zone).
Directional trades only after clear breakout or breakdown.
Above 25,816 → bias shifts bullish.
Below 25,672 → selling pressure likely.
📌 Options Strategy (Flat Market):
• Short Strangle / Iron Fly (experienced traders only)
• Focus on theta decay ⏳
• Book profits early, avoid late-day overconfidence
🔽 SCENARIO 3: GAP DOWN OPENING (100+ points) 📉
If NIFTY opens below 25,672, initial sentiment remains weak.
First support to watch: 25,559 (Last Intraday Support).
A bounce from 25,559 can offer a quick pullback trade.
Breakdown below 25,559 opens downside targets:
• 25,483
Avoid counter-trend longs without confirmation.
📌 Options Strategy (Gap-Down):
• Bear Put Spread or ATM PE with strict SL
• Avoid selling PE in trending weakness
• Trail profits aggressively 📉
🧠 Risk Management Tips for Options Traders 🛡️
Risk only 1–2% of capital per trade.
Expiry-week trades demand faster exits.
Prefer spreads over naked options to manage theta & IV risk.
Wait for first 15-min candle structure before committing.
One clean trade > multiple emotional trades.
📌 Summary & Conclusion ✨
NIFTY is trading within a defined intraday range.
📍 25,672–25,816 remains the key decision zone.
Directional clarity will emerge only after acceptance outside this range.
Trade what the market confirms — not what you assume.
⚠️ Disclaimer
This analysis is shared strictly for educational purposes only.
I am not a SEBI-registered analyst.
Markets are uncertain, and I may be wrong.
Please consult your financial advisor before taking any trades.

Nifty Analysis for Jan 14 and 16, 2026Wrap up:-
Today, Nifty after breakout above 38.2% level i.e. 25817 retested the breakout and take support at 25636-25601 level and buying is activated in this support zone.
Nifty is currently heading towards wave c of y of 5. In wave C, Wave 1 of c was completed at 25899 and wave 2 at 25603 and now, wave 3 is in progress.
What I’m Watching for Jan 14 and 16, 2026 🔍
Buy Nifty 25636-25601 sl 25473 for a target of 26029-26103-26293.
Disclaimer: Sharing my personal market view — only for educational purpose not financial advice.
"Don't predict the market. Decode them."

INDIAN HOTELS (INDHOTEL) – Swing Trade SetupINDIAN HOTELS (INDHOTEL): CMP: 748.65; RSI: 51.47
✅ Trend: Strong Bullish (Weekly Golden Cross)
📐 Pattern: Flag consolidation → Breakout setup
🔔 Entry:
• Above ₹770 (weekly close / breakout confirmation)
⛔ Stop Loss:
• ₹700 (below flag support & recent swing low)
🎯 Targets:
• T1: ₹820–830 (partial profit)
• T2: ₹880–900 (flag pole projection / Wave-V zone)
📌 Risk–Reward: ~1:2.5 to 1:3
⚠️ Note:
• Enter only on breakout with volume
• Trail SL once T1 is achieved
📈 Trend is up. Consolidation is healthy. Breakout can lead to next expansion leg.
📌 Thanks a ton for checking out my idea! Hope it sparked some value for you.
🙏 Follow for more insights
👍 Boost if you found it helpful
✍️ Drop a comment with your thoughts below!

DLF likely to double in 1 yearDLF nearly bottoming out. Buy on dip with a stop loss of 600. Will likely double in a year’s time frame give or take.

Nifty Analysis for Jan 13, 2026Wrap up:-
Nifty is heading towards wave c of y of 5. In wave C, Wave 1, 2 and 3 of major wave 1 of c were completed today and wave 4 is expected to be completed by tomorrow morning near 25800. Thereafter, Nifty will head towards wave 5 of major wave 1 of c.
What I’m Watching for Jan 09, 2026 🔍
Buy Nifty near 25800 sl 25700 (15 min. candle closing basis) for a target of 25898-25960-26061.
Disclaimer: Sharing my personal market view — only for educational purpose not financial advice.
"Don't predict the market. Decode them."

Option Trading1. Common Mistakes by Retail Traders
Buying far OTM options
Overtrading
No stop-loss
Ignoring volatility
Selling naked options without hedge
Trading near expiry without plan
Following tips blindly
2. Best Practices for Option Trading
✔ Trade with a system
✔ Check trend (market structure)
✔ Use option Greeks
✔ Focus on liquidity
✔ Avoid gambling with OTM
✔ Use spreads to reduce risk
✔ Journal your trades

Part 2 Candle Stick Patterns Intraday vs Positional Option Trading
Intraday
Quick profits
Higher volatility
Good for scalping
Needs strict discipline
Positional
Rely on swings
Theta decay risk
Good for spreads

Gold reaches new ATH — Smart Money rotates.🟡 XAUUSD – Intraday Smart Money Plan | by Ryan_TitanTrader (13/01)
📈 Market Context
Gold has officially printed a new All-Time High (ATH), confirming higher-timeframe bullish dominance. However, after delivering buy-side liquidity into premium, price action is no longer impulsive. Instead, Smart Money is transitioning into controlled distribution and rotation, engineering liquidity rather than chasing continuation.
With price stretched deep into premium and resting above prior structure, today’s environment favors liquidity sweeps, inducement, and mean reversion, not blind breakout trading. Execution must be precise, level-based, and confirmation-driven.
🔎 Technical Framework – Smart Money Structure (H1–M15)
Current Phase:
HTF bullish structure intact, but intraday corrective rotation active from premium after ATH print.
Key Idea:
Expect Smart Money to distribute near ATH supply (4630–4632), or rebalance deeply into discount (4492–4490) before the next expansion leg.
Structural Notes:
• Clear HTF BOS confirms bullish dominance
• New ATH delivered buy-side liquidity
• Price reacting from premium with corrective characteristics
• Internal FVG + liquidity pocket acting as magnet below
• Discount OB zone aligns with higher-timeframe demand
💧 Liquidity Zones & Triggers
• 🔴 SELL GOLD 4630 – 4632 | SL 4640
• 🟢 BUY GOLD 4492 – 4490 | SL 4482
🧠 Institutional Flow Expectation
Liquidity sweep → MSS / CHoCH → BOS → displacement → OB/FVG retest → expansion
🎯 Execution Rules
🔴 SELL GOLD 4630 – 4632 | SL 4640
Rules:
✔ Price taps ATH premium supply
✔ Buy-side liquidity taken above highs
✔ Bearish MSS / CHoCH on M5–M15
✔ Clear downside BOS confirming distribution
✔ Entry via bearish FVG refill or supply OB
Targets:
• 4588 — internal reaction
• 4560 — FVG mitigation
• Trail aggressively (intraday distribution play)
🟢 BUY GOLD 4492 – 4490 | SL 4482
Rules:
✔ Liquidity sweep into discount demand
✔ Confluence with OB + FVG + strong liquidity pool
✔ Bullish MSS / CHoCH on M5–M15
✔ Strong upside BOS with displacement
✔ Entry via refined bullish OB or FVG mitigation
Targets:
• 4520 — first reaction
• 4580 — internal liquidity
• 4630+ — ATH retest if expansion resumes
⚠️ Risk Notes
• New ATH zones are liquidity traps by nature
• Expect false breakouts and aggressive stop hunts
• No trades without MSS + BOS confirmation
• Size down near ATH — volatility can expand rapidly
📍 Summary
Gold is bullish by structure, but today is about rotation, not continuation:
• A reaction at 4630–4632 may deliver a Smart Money sell back into liquidity, or
• A sweep into 4492–4490 may reload longs for the next ATH extension.
Let liquidity move first.
Let structure confirm second.
Smart Money engineers — patience profits. ⚡️
📌 Follow Ryan_TitanTrader for daily Smart Money gold breakdowns.

CANDLESTICK PATTERNSCandlesticks originated in Japan over 300 years ago. They show four key pieces of information:
Open
High
Low
Close
Candlestick patterns help traders understand short-term price action, momentum, and market psychology.
Candle patterns fall into:
1. Bullish Patterns
2. Bearish Patterns
3. Indecision Patterns
4 .Continuation Patterns

TITAN 1 Week Time Frame 📌 Current Price Context
• The stock is trading around ₹4,230 – ₹4,260 on NSE/BSE today.
• It hit a 52-week high ~₹4,312 recently after strong quarterly results.
📊 Weekly Support & Resistance Levels (1-Week Timeframe)
(Based on pivot analysis for the current weekly chart)
🔼 Resistance Levels
R1 (Immediate): ₹4,327
R2: ₹4,453
R3: ₹4,593
These are key upside hurdles this week — above these, stronger bullish bias.
🔽 Support Levels
S1 (Immediate): ₹4,061
S2: ₹3,921
S3: ₹3,795
If price breaks below S1 → deeper correction risk toward S2/S3.
📌 Weekly Pivot Base
Weekly central pivot zone: ~₹4,186–₹4,218
This can act as a short-term balance area for price rotation this week.
🧠 Quick Reference Table — Weekly Levels
Level Price (₹) Significance
R3 ~4,593 Major weekly upside limit
R2 ~4,453 Secondary resistance
R1 ~4,327 Immediate upside barrier
Pivot zone ~4,186–4,218 Weekly balance level
S1 ~4,061 Immediate support
S2 ~3,921 Next support if S1 breaks
S3 ~3,795 Deep support zone
💡 Summary: Titan’s 1-week view shows a short-term bull bias while above ₹4,061, with upside resistance near ₹4,327–₹4,453 and strong weekly range ₹4,061–₹4,453. A break below support levels opens room for deeper correction.

XAUUSD Full Technical AnalysisGold remains in a **strong bullish structure** after an impulsive move higher, now transitioning into a **healthy consolidation phase**. On the **1H timeframe**, price is holding above the key demand zone around **4,575–4,585**, which previously acted as an accumulation area. The market respected this zone and bounced, confirming it as a strong **support base**.
Price is currently trading near **4,595–4,600**, facing **short-term resistance** just below **4,620–4,630**, where previous highs and supply are stacked. Multiple rejections in this area indicate **profit booking**, but not trend reversal.
On the **lower timeframe (5m)**, structure remains bullish with **higher lows**, and price is holding above the trailing support (trend line / dynamic support). Volume has cooled, suggesting **compression before expansion**.
### 🔑 Key Levels
* **Resistance:** 4,620 → 4,650
* **Immediate Support:** 4,585
* **Major Support:** 4,560–4,550
### 📈 Bias & Scenarios
* **Bullish continuation:** A clean break and hold above **4,620** could trigger upside toward **4,650–4,700**.
* **Pullback scenario:** Failure at resistance may lead to a controlled retracement into **4,585–4,560**, which would still be **buy-the-dip territory** as long as structure holds.
### 🎯 Conclusion
Overall bias remains **bullish**, with price consolidating below resistance. Market participants should watch for either a **breakout confirmation above 4,620** or a **liquidity sweep into support** for continuation trades.

#Nifty Directions and Levels for Jan 13thThe structure suggests that the market could consolidate between today’s high and the immediate support level. However, if it breaks either above today’s high or below today’s low, we can expect gradual ups and downs toward the next targets

#Banknifty Directions and Levels for Jan 13thThe structure suggests that the market could consolidate between today’s high and the immediate support level. However, if it breaks either above today’s high or below today’s low, we can expect gradual ups and downs toward the next targets.

XAUUSD H4 – Structure hints at corrective moveAfter the recent impulsive move, price is now reacting near a higher-timeframe supply area.
Momentum has started to slow down, suggesting a corrective phase may be developing.
As long as the lower-high structure remains intact, a pullback toward the 4370 region
cannot be ruled out. This would align with a natural mean-reversion move
after the prior expansion.
Time-wise, this scenario fits within the 20–21 January window,
assuming no strong bullish continuation above current highs.
This is a structure-based market observation only.
Not a trade recommendation.

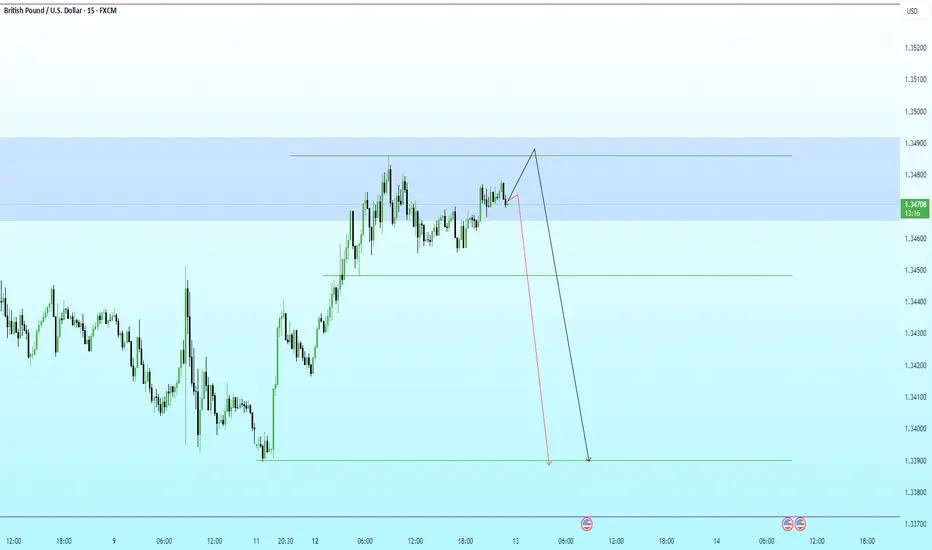
GBPUSD · 15M · SMC OutlookPrice is trading deep into premium, pressing against a well-defined HTF supply zone.
HTF Framework
Clear bullish leg already completed.
Buy-side liquidity resting above recent highs.
Premium zone aligns with prior distribution and weak highs.
LTF Structure
Momentum is slowing near the highs.
Price is consolidating under resistance, hinting at distribution.
Minor pullbacks are being absorbed, classic liquidity buildup behavior.
Expectation
A final push higher to sweep buy-side liquidity.
Reaction from supply after the sweep.
Strong bearish displacement targeting:
Internal range low
Prior demand imbalance
HTF discount zone below
Execution Plan
Avoid longs in premium.
Wait for:
Liquidity sweep above highs
Bearish displacement
LTF MSS for confirmation
Shorts favored post-confirmation.
Partial profits at range low, runners into discount.
HIND ZINC SHORT TRADE -RISKYTechnical Analysis
Parabolic Extension: The stock has seen a massive, nearly vertical rally from the ~400 levels to highs near 670 in a very short span. Such parabolic moves are rarely sustainable without a significant correction or consolidation phase.
Rejection at Highs: The price action shows a sharp pullback from the recent high of 661.55, indicating that profit booking is kicking in and buyers are exhausted at these elevated levels.
Risk/Reward Ratio: The current setup offers a favorable Risk/Reward ratio for a short position. The stop loss is tight relative to the potential downside move as the stock attempts to revert to the mean.
Volume Profile: High volume during the ascent suggests strong participation, but upcoming sessions should be watched for distribution volume (selling pressure) to confirm the top.
Trade Setup (Short)
Entry Zone: 661 (Looking for rejection near the highs)
Stop Loss: 697.40 (Strict SL above recent swing high to protect against a "blow-off top")
Target: 564.45 (Targeting the gap fill/retracement to previous structure support)
Potential R:R: ~ 1:2.6
⚠️ Disclaimer: This chart analysis is shared for educational and informational purposes only. It does not constitute financial or investment advice. I am not a SEBI registered research analyst. Trading in the stock market involves a high degree of risk. Please consult with a certified financial advisor and perform your own due diligence before making any trading decisions.
