PCR Trading Strategies1. The Psychology of Option Trading
Options magnify emotions: greed (unlimited gains) and fear (time decay, sudden loss). Many traders lose due to overleveraging, chasing cheap OTM options, or not respecting stop-loss. Psychological discipline is as vital as technical knowledge.
2. Option Chain Analysis
An option chain shows all available strikes, premiums, OI (open interest), IV, etc. Traders analyze max pain, OI build-up, and put-call ratio (PCR) to gauge market sentiment. Option chains are powerful tools for directional and volatility analysis.
3. Role of Market Makers in Options
Market makers provide liquidity by quoting bid-ask spreads. They profit from spreads and hedging but ensure smoother trading. Without them, option spreads would widen, making it harder for retail traders to enter/exit efficiently.
4. Index Options vs Stock Options
Index Options (e.g., Nifty, Bank Nifty): Cash-settled, high liquidity, lower manipulation risk.
Stock Options: Physical settlement (delivery), less liquid, but higher potential returns.
Retail traders prefer index options; institutions often hedge with stock options.
5. Option Writing as a Business
Many professional traders treat option writing like a business: selling high IV options, hedging risk, managing spreads. Profits come steadily from time decay, but big moves can wipe out capital if risk isn’t managed with stop-loss or hedges.
6. Options and Event Trading
Events like earnings, RBI policy, budget, elections, or global news drastically affect IV. Traders buy straddles/strangles pre-event, and sellers wait for IV crush post-event. Understanding event volatility cycles is key.
7. Taxation of Options Trading in India
Profits from option trading are treated as business income under Indian tax law. Traders must maintain proper records, pay GST in some cases, and file ITR with audit if turnover exceeds limits. This is often ignored by beginners.
8. Technology and Algo in Options
With algo trading, institutions dominate options using complex models (volatility arbitrage, delta-hedging). Retail traders now use option analytics platforms, scanners, and automation tools to compete. Speed and data-driven execution matter more today.
9. Common Mistakes in Option Trading
Buying cheap OTM lottery tickets.
Ignoring IV crush.
Selling naked options without hedge.
Overtrading on expiry days.
Neglecting stop-loss and money management.
Most retail losses come from these errors.
10. The Future of Option Trading
Option trading is growing rapidly in India with weekly expiries, retail participation, and technology. Innovations like zero-day options (0DTE) in the US may come to India. Education, discipline, and structured strategies will define success. The future promises wider accessibility but higher competition as retail meets institutional algos
Government bonds

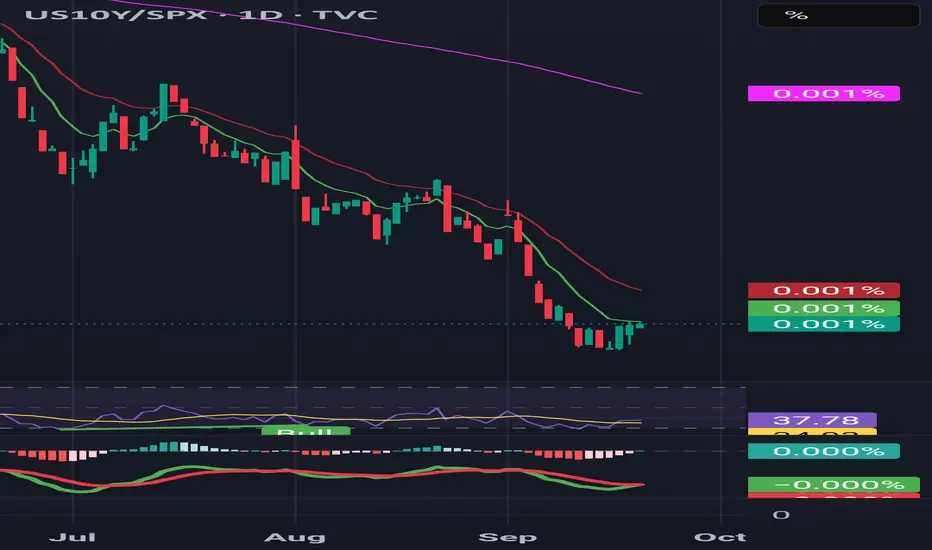
US10Y/SPX RATIO ANALYSIS The US10Y/SPX ratio has been crushed lower but is now trying to form a bottom. RSI is curling up from oversold, and MACD shows a potential bullish turn.
📌 Early signs that bonds may start regaining relative strength versus equities.
Part 3 Institutional Trading Role of Options in Hedging
Options are commonly used to hedge portfolios against adverse market movements:
Protective Put for Stocks: Investors holding equities can buy puts to protect against downside risks.
Portfolio Insurance: Institutions use options to safeguard large portfolios against market crashes.
Income Generation: Covered call writing allows long-term holders to earn additional income while maintaining exposure.
Hedging with options is especially popular in volatile markets where risk management is critical.
Pricing Models and Market Mechanics
Professional traders often rely on option pricing models, like the Black-Scholes model, to determine fair premiums. These models factor in:
Current price of the underlying asset
Strike price
Time to expiration
Volatility
Risk-free interest rate
Options markets operate through exchanges with standardized contracts. Market makers provide liquidity, and the bid-ask spread reflects supply-demand dynamics. In OTC markets, options can be customized to suit specific investor requirements.
Advantages of Options Trading
Leverage: Control a larger position for smaller capital.
Flexibility: Strategies for bullish, bearish, or neutral markets.
Hedging: Effective risk management tool.
Profit in Any Market: Can profit in rising, falling, or sideways markets with the right strategy.
Defined Risk (for Buyers): Limited to premium paid.
Challenges and Considerations
Complexity: Options require understanding of multiple factors affecting pricing.
Time Sensitivity: Options lose value as expiration nears.
Volatility Risk: Price swings can be unpredictable.
Liquidity Issues: Not all options have sufficient trading volume.
Psychological Pressure: Rapid movements and leverage can lead to emotional decisions.

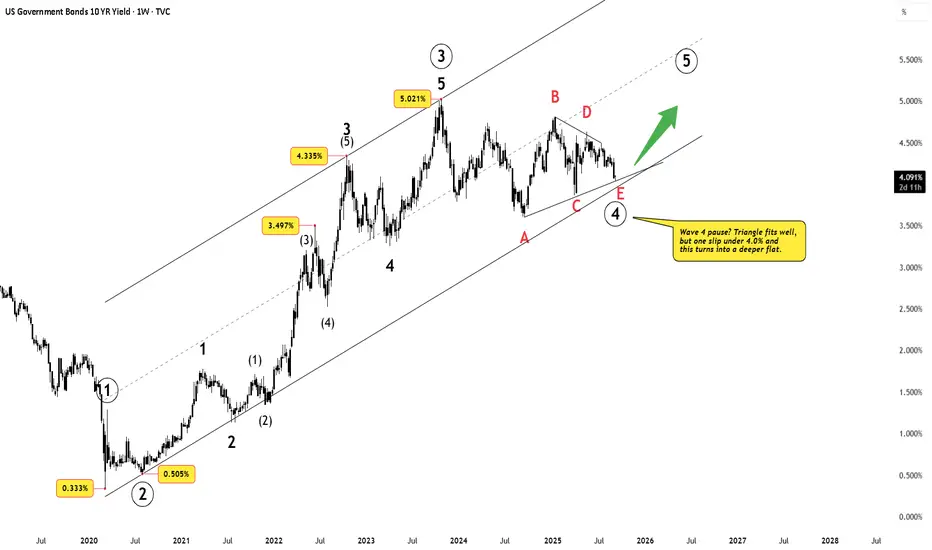
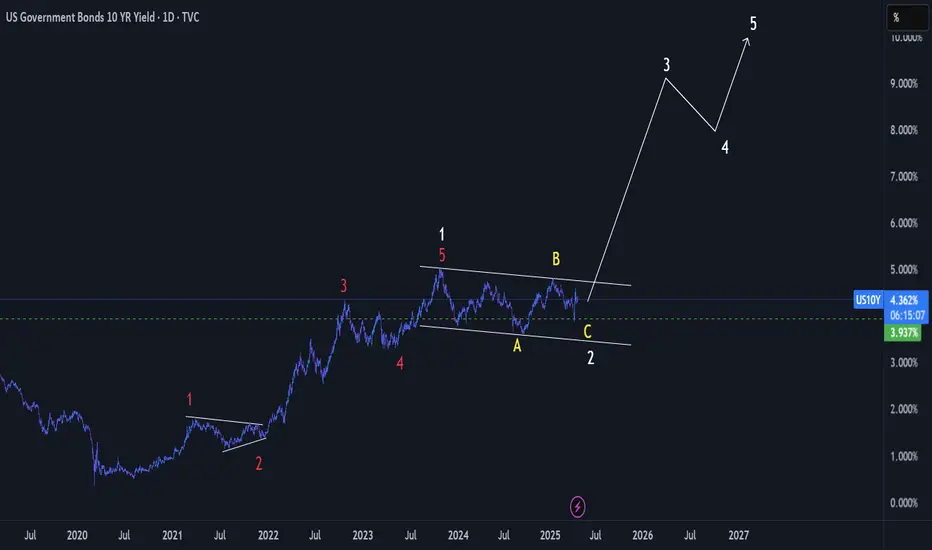
US 10Y Yield – Wave 4 Pause Before the Final SurgeDisclaimer: This analysis is for educational purposes only and does not constitute investment advice. Please do your own research (DYOR) before making any trading decisions.
The Setup
The US 10-year yield has been consolidating after topping near 5.021%. Price action since then has formed a contracting structure that looks very much like a Wave 4 triangle .
At present, yields hover near 4.0% — a crucial pivot.
Triangle view: Wave 4 is complete, setting the stage for Wave 5 higher.
Flat view: If yields break below 4.0%, Wave 4 may stretch deeper into a flat correction, potentially testing 3.6–3.7%.
Either way, the Elliott script points to one more advance: Wave 5 up .
What Wave 5 Could Mean
If the US 10-year yield really enters Wave ⑤ up, buckle up:
Bond prices tank → inverse relation, so Treasuries bleed.
Equities feel the heat → higher yields = expensive valuations, especially for growth stocks.
Dollar flexes → global FX could see USD strength.
Borrowing costs bite → mortgages, corporate loans, government debt servicing all tighten.
In short: Wave ⑤ = a macro “stress test .”
Why India Should Care
A breakout in US yields rarely stays a US-only story. For India, it means:
FII outflows as global funds chase safer US returns
INR under pressure , increasing imported inflation risks
Indian bond yields rising , even without RBI action
Equity market stress , especially in IT and rate-sensitive sectors
Final Thoughts
The triangle scenario points to an imminent breakout above 5.0%. A deeper flat only delays it. For traders and investors, this is the chart to watch — because Wave 5 in US yields isn’t just a bond market story, it’s a global macro shockwave .
Emerging Sectors in India1. Information Technology & Digital Economy
India’s IT sector has been the backbone of its global image for decades. But the story is evolving. It’s no longer just about outsourcing or call centers; today, India is building entire digital ecosystems. Cloud computing, SaaS (Software as a Service), big data analytics, and cybersecurity are driving a new phase of IT growth.
The adoption of 5G, Artificial Intelligence (AI), and Internet of Things (IoT) is expanding opportunities for IT firms. With global businesses increasingly looking for digital transformation partners, Indian IT companies like Infosys, TCS, Wipro, and HCL are evolving from service providers into strategic partners.
Moreover, India’s digital economy is expected to reach $1 trillion by 2030, with growth driven by digital payments, e-commerce, and digital infrastructure.
2. Fintech & Digital Payments
India has become a global leader in digital payments. The success of UPI (Unified Payments Interface) is a case study for the world, processing billions of transactions every month. Startups like PhonePe, Paytm, BharatPe, and Razorpay are revolutionizing how money moves across the economy.
Beyond payments, fintech innovation includes:
Digital lending platforms
Insurtech solutions
WealthTech & robo-advisory
Blockchain-based financial services
Government initiatives like Jan Dhan Yojana, Digital India, and financial inclusion policies have enabled fintech adoption even in rural India. By 2030, India’s fintech industry could surpass $200 billion in revenues.
3. E-commerce & Online Marketplaces
E-commerce is one of the fastest-growing consumer-facing sectors. With the world’s largest youth population and rising internet penetration, platforms like Amazon, Flipkart, Meesho, and Nykaa are driving a retail revolution.
Key drivers:
Growing middle-class consumption
Rapid adoption of online grocery & fashion retail
Expansion of logistics and supply chain tech
Rise of social commerce & direct-to-consumer (D2C) brands
By 2030, India’s e-commerce market is projected to reach $350–400 billion, making it the third-largest in the world after China and the US.
4. Electric Vehicles (EVs) & Green Mobility
India’s transportation sector is undergoing a green transformation. With rising pollution levels and energy dependence on oil imports, electric mobility has become a national priority.
Key developments:
Government subsidies under FAME (Faster Adoption and Manufacturing of Hybrid and Electric Vehicles)
PLI scheme for EV batteries
Entry of global players like Tesla (expected)
Domestic innovation by Ola Electric, Ather Energy, and Tata Motors
EV adoption in two-wheelers, buses, and delivery fleets is picking up faster than passenger cars, given India’s cost-sensitive market. By 2030, EVs could form 30% of all vehicle sales in India.
5. Renewable Energy & Clean Tech
India is one of the world’s largest consumers of energy. To reduce fossil fuel dependency, the government has set ambitious renewable energy targets: 500 GW of renewable capacity by 2030.
Solar and wind power dominate, but new areas like green hydrogen, battery storage, and waste-to-energy are gaining attention. Companies like Adani Green, ReNew Power, and NTPC are spearheading massive renewable projects.
With global ESG (Environmental, Social, Governance) investments rising, India’s renewable energy sector could attract trillions in foreign investment over the next two decades.
6. Biotechnology & Healthcare Innovation
India’s pharmaceutical industry is already known as the “pharmacy of the world”, but biotechnology and healthcare innovation are expanding the sector further.
Emerging areas:
Gene therapy and personalized medicine
Biotechnology in agriculture and food security
Telemedicine and digital health platforms
Medical devices and diagnostics
Startups in health-tech (Practo, 1mg, PharmEasy) are bridging gaps in healthcare access. With rising health awareness and global demand, India’s biotech industry could reach $150 billion by 2025.
7. EdTech (Education Technology)
India has one of the largest student populations in the world, creating huge demand for quality education. EdTech platforms like Byju’s, Unacademy, Vedantu, and PhysicsWallah are transforming how students learn.
Key innovations:
Live online classes
AI-based personalized learning
Skill development & upskilling platforms
AR/VR-based immersive education
Though growth slowed after the pandemic boom, long-term demand for hybrid and skill-focused education will keep EdTech a strong emerging sector.
8. Agritech & Food Processing
Agriculture still employs 40% of India’s workforce, but productivity is low. Agritech startups are using AI, IoT, blockchain, and drones to modernize farming.
Examples:
DeHaat, Ninjacart (farm-to-market supply chains)
Stellapps (dairy tech)
AgroStar (input advisory & marketplace)
Meanwhile, food processing is gaining momentum, with India moving from raw produce to value-added exports. This sector could generate millions of jobs and boost farmers’ income significantly.
9. Space Technology & Satellite Services
India’s space sector, led by ISRO, is opening up to private players. With the success of Chandrayaan-3 and Aditya-L1, global attention is on India’s space tech.
Private startups like Skyroot, Agnikul Cosmos, and Pixxel are innovating in satellite launch services, earth observation, and space-based applications.
The government’s IN-SPACe policy and privatization efforts could turn India into a global hub for affordable space technology.
10. Artificial Intelligence, Robotics & Automation
AI and automation are transforming multiple industries, from finance to healthcare to manufacturing. India’s AI market is expected to reach $17 billion by 2027.
Applications include:
AI in customer service (chatbots, voice assistants)
Robotics in manufacturing and logistics
AI-driven medical imaging
Smart cities and predictive governance
Indian IT and startups are actively adopting AI tools, with government initiatives supporting skill development in this field.
Conclusion
India stands at a historic crossroads. The emerging sectors described above are not just industries – they represent the aspirations of a young, ambitious nation aiming for global leadership. With strong policy support, rapid digital adoption, and entrepreneurial energy, India is building the foundations of a $5–10 trillion economy.
While challenges remain, the direction is clear: India’s growth story will be powered by emerging sectors that combine innovation, sustainability, and inclusivity.

India 10-Year Yields and Rupee – A Long-Term SetupThe Bond Yield Story
India’s 10-year government bond yield has been moving inside a long contracting triangle for more than 20 years.
The highs are getting lower.
The lows are getting higher.
Yields are now sitting near the middle, around 6.5%.
This triangle will not last forever. When it breaks, the move can be strong and last for years.
If yields break down: Bond prices go up, borrowing gets cheaper.
If yields break up: Borrowing costs rise, pressure builds on companies and the government.
The Rupee Story
The USD/INR chart shows a very clear uptrend since 2011 .
Every dip has made a higher low.
The line of support is still holding.
Today the rupee is near ₹88 per USD .
This means the rupee has been slowly losing value for many years.
Weak rupee: Imports (oil, gold, electronics) become costlier → inflation risk.
But: Exporters like IT and pharma get some advantage.
Fiscal Pressure
As per a Reuters update on TradingView’s news feed, the GST Council has approved tax cuts on many consumer goods starting September 22, 2025 .
This could boost consumption.
But it may also lead to a large revenue shortfall for the government.
Implication for markets:
Bond yields: More government borrowing could push yields higher.
Rupee: Fiscal stress may keep INR weak against USD.
(source : in.tradingview.com
)
Big Picture
Bond yields are stuck inside a long contracting triangle – a breakout is coming.
The rupee has been in a steady downtrend – the pressure is clear.
Fiscal moves like GST tax cuts add extra risk , tilting towards higher yields and weaker INR.
In short: The charts show yields coiling and rupee sliding . Fundamentals only add more weight to this setup.
Disclaimer: This analysis is for educational purposes only and does not constitute investment advice. Please do your own research (DYOR) before making any trading decisions.

Part 3 Trading Master ClassIntroduction
Options trading is one of the most fascinating and versatile aspects of the financial markets. Unlike stocks, which give ownership in a company, or bonds, which provide fixed income, options are derivative instruments whose value is derived from an underlying asset such as stocks, indices, commodities, or currencies. They give traders the right, but not the obligation, to buy or sell the underlying asset at a predetermined price before a specific expiration date.
Because of this unique characteristic, options allow traders and investors to design strategies that suit a wide range of market conditions—whether bullish, bearish, or neutral. Through careful strategy selection, one can aim for limited risk with unlimited upside, hedge existing positions, or even profit from sideways markets where prices don’t move much.
This article explores options trading strategies in detail. We’ll cover the building blocks of options, common strategies, advanced combinations, and risk management. By the end, you’ll have a strong foundation to understand how professional traders use options to manage portfolios and generate returns.
Risk Management in Options Trading
Options carry significant risks if misused. Successful traders emphasize:
Position Sizing: Never risk too much on one trade.
Diversification: Spread across multiple strategies/assets.
Stop-Loss & Adjustments: Exit losing trades early.
Implied Volatility (IV) Awareness: High IV increases premiums; selling strategies may be better.

Futures & Options (F&O) TradingIntroduction
Futures and Options (commonly known as F&O) are among the most exciting segments of financial markets. They fall under the category of derivatives trading, meaning their value is derived from an underlying asset such as stocks, commodities, currencies, or indices.
Unlike simple buying and selling of shares, F&O trading allows investors to hedge risks, speculate on price movements, and even leverage small capital into big trades. However, it also carries high risk and requires deep understanding.
This guide will cover:
What F&O trading is
How futures work
How options work
Key terms
Strategies used
Advantages & risks
Practical examples
Psychology of F&O trading
Regulations in India
Final thoughts for beginners
By the end, you’ll have a solid foundation in F&O trading.
Part 1: Understanding Derivatives
What are Derivatives?
A derivative is a financial contract whose value depends on the price of an underlying asset. For example, if you buy a derivative linked to Reliance Industries stock, its value will move as Reliance’s stock price moves.
Derivatives can be of many types:
Futures
Options
Forwards
Swaps
In India, the most popular are Futures and Options (F&O).
Part 2: Futures Trading
What are Futures?
A futures contract is an agreement between two parties to buy or sell an asset at a predetermined price on a future date.
Buyer of futures: Agrees to buy the asset in future.
Seller of futures: Agrees to sell the asset in future.
Both are obligated to honor the contract on expiry.
Key Features of Futures:
Standardized contracts – traded on exchanges (like NSE, BSE).
Leverage – You pay only a margin (a fraction of total value).
Settlement – Can be cash-settled or delivery-based.
Expiry dates – Futures have fixed expiry (weekly, monthly, quarterly).
Example of Futures:
Suppose Reliance stock is trading at ₹2,500.
You buy a Reliance Futures contract (lot size 250 shares).
Contract value = ₹2,500 × 250 = ₹6,25,000.
But you don’t pay full amount, only margin (say 15% = ₹93,750).
If Reliance rises to ₹2,600, your profit = (100 × 250) = ₹25,000.
If Reliance falls to ₹2,400, your loss = ₹25,000.
So, futures magnify both profit and loss.
Part 3: Options Trading
What are Options?
Options are more flexible than futures. An option gives the buyer the right, but not the obligation, to buy or sell the underlying asset at a fixed price on or before expiry.
There are two types of options:
Call Option (CE): Right to buy.
Put Option (PE): Right to sell.
Key Terms in Options:
Strike Price: Pre-decided price at which option can be exercised.
Premium: Price paid by buyer to seller of option.
Option Buyer: Has rights, limited risk (loss = premium).
Option Seller (Writer): Has obligation, unlimited risk but limited profit (premium received).
Example of Call Option:
Reliance at ₹2,500.
You buy a Call Option (CE) 2600 strike, expiring in 1 month, paying ₹20 premium.
Lot size = 250. Total premium paid = ₹5,000.
If Reliance goes to ₹2,700 before expiry:
Option value = ₹100 (intrinsic value).
Profit = (100 - 20) × 250 = ₹20,000.
If Reliance stays below ₹2,600, option expires worthless.
Loss = only premium paid (₹5,000).
So, options limit risk for buyers but sellers face higher risk.
Part 4: Comparison – Futures vs Options
Feature Futures Options
Obligation Buyer & seller both obligated Buyer has right, seller has obligation
Risk High (both sides) Limited for buyer, unlimited for seller
Cost Margin required Premium required
Profit Potential Unlimited both ways Unlimited for buyer, limited for seller
Best for Speculation & hedging Hedging, speculation, income strategies
Part 5: Why Trade F&O?
1. Hedging
Investors use F&O to protect portfolios from adverse price movements.
Example: An investor holding Reliance shares can buy a Put Option to protect against downside.
2. Speculation
Traders use leverage to bet on market movements.
3. Arbitrage
Taking advantage of price differences between cash market and F&O.
4. Income Generation
Selling (writing) options to earn premium.
Part 6: Important Concepts in F&O
Leverage & Margin – You control large value with small capital.
Mark-to-Market (MTM) – Futures contracts are settled daily.
Time Decay (Theta) – Options lose value as expiry nears.
Implied Volatility (IV) – Measures expected price swings.
Greeks in Options – Delta, Gamma, Vega, Theta, Rho – help manage risk.
Part 7: Common F&O Strategies
Futures Strategies:
Long Futures – Buy if you expect rise.
Short Futures – Sell if you expect fall.
Options Strategies:
Covered Call – Hold stock + sell call.
Protective Put – Hold stock + buy put (insurance).
Straddle – Buy call + buy put (expect big move).
Strangle – Buy out-of-money call & put.
Iron Condor – Combination to earn premium in sideways market.
Part 8: Risks in F&O Trading
High Leverage Risk – Small moves can wipe out capital.
Time Decay in Options – Value erodes with time.
Volatility Risk – Sudden moves may cause losses.
Liquidity Risk – Some contracts have low trading volume.
Psychological Pressure – High stress and emotions.
Part 9: F&O in India
Introduced in 2000 (NSE).
Most popular: Index Futures & Options (Nifty, Bank Nifty).
Also available: Stock futures, stock options, currency derivatives, commodity derivatives.
Regulated by SEBI (Securities and Exchange Board of India).
Lot Sizes in India
Each F&O contract has a fixed lot size decided by SEBI (e.g., Nifty lot = 50 units).
Expiry Cycle
Index Options: Weekly & monthly expiry.
Stock Options: Monthly expiry.
Part 10: Psychology of F&O Trading
Success in F&O is not just about knowledge, but also about mindset:
Discipline – Stick to stop-loss and plan.
Patience – Wait for right setup.
Emotional Control – Don’t let greed/fear drive decisions.
Risk Management – Never risk more than 1–2% of capital in one trade.
Conclusion
Futures & Options (F&O) trading is a double-edged sword. It offers leverage, hedging, and high profit potential, but also comes with complexity and high risk.
For beginners:
Start with options buying (limited risk).
Learn basic strategies like covered call, protective put.
Always use stop-loss.
Treat F&O as a tool for hedging first, speculation second.
With proper knowledge, discipline, and risk management, F&O can become a powerful addition to an investor’s toolkit.
Part 2 Master Candlestick PatternAdvanced Strategies for Experienced Traders
If you’ve mastered the basics, here are some advanced setups:
Bull Call Spread → Buy 1 Call, Sell higher strike Call.
Bear Put Spread → Buy 1 Put, Sell lower strike Put.
Butterfly Spread → Profit from low volatility (range-bound market).
Calendar Spread → Buy long-term option, sell short-term option.
These strategies help balance risk vs reward.
SEBI Regulations & Margins
In India, SEBI ensures options trading is safe:
Option sellers must keep high margins.
Brokers must collect upfront premiums.
Intraday exposure limits are monitored.
This protects retail traders from excessive risks.

Part 1 Ride The Big Moves Options trading is one of the most versatile tools in financial markets, allowing traders and investors to hedge risk, generate income, and speculate on price movements. While options can seem complex at first, understanding their structure, types, and strategies can make them an invaluable part of your trading toolkit.
What Are Options?
An option is a financial contract that gives the holder the right, but not the obligation, to buy or sell an underlying asset (like stocks, indices, or commodities) at a predetermined price within a specific period. Unlike futures or stocks, options provide flexibility and limited risk.
There are two main types of options:
Call Option: Gives the buyer the right to buy the underlying asset at a predetermined price (strike price) before or on the expiration date.
Put Option: Gives the buyer the right to sell the underlying asset at the strike price before or on expiration.
Key terms to understand:
Underlying Asset: The stock, index, commodity, or currency on which the option is based.
Strike Price: The price at which the option can be exercised.
Premium: The price paid to buy the option.
Expiration Date: The date on which the option expires.
In-the-Money (ITM): Options with intrinsic value (profitable if exercised now).
Out-of-the-Money (OTM): Options without intrinsic value (currently unprofitable).
At-the-Money (ATM): Option strike price equals the underlying asset price.

Volume Profile & Market Structure1. Introduction
If you have ever looked at a stock or index chart, you’ll notice prices move up, down, or sometimes just sideways. Traders are always trying to answer one simple question:
👉 Where is the market likely to go next?
To answer that, two powerful tools come into play:
Market Structure → tells us the story of price movement by showing how highs, lows, and trends form.
Volume Profile → shows us where the biggest battles between buyers and sellers happened by plotting traded volumes at different price levels.
Think of Market Structure as the “skeleton” of price movement, and Volume Profile as the “blood flow” that shows which areas have real strength and participation. When combined, these tools help traders understand who controls the market (buyers or sellers) and where important levels are for making decisions.
In this guide, we’ll break down these concepts step by step in simple language so you can use them in real-world trading.
2. Understanding Market Structure
Market structure simply means the framework of how price moves over time. It helps traders identify the trend, key levels, and potential reversals.
2.1 What is Market Structure?
At its core, market structure is about recognizing patterns in price:
When the market is making higher highs (HH) and higher lows (HL) → it’s in an uptrend.
When the market is making lower highs (LH) and lower lows (LL) → it’s in a downtrend.
When the market is not making new highs or lows, just bouncing within levels → it’s in a range.
📌 Example:
If Nifty goes from 19,000 → 19,200 → 19,100 → 19,400 → 19,250, we can see it’s making higher highs and higher lows, which means buyers are stronger.
2.2 Why Market Structure Matters
It shows the direction of the market.
Helps identify good entry and exit points.
Builds discipline (you trade with the trend, not against it).
2.3 Phases of Market Structure
Markets move in cycles. These are usually broken into four phases:
Accumulation Phase
Big players (institutions) quietly buy at low prices.
Price moves sideways.
Volume is steady but not explosive.
Uptrend/Advancing Phase
Price starts breaking resistance levels.
Higher highs and higher lows form.
Retail traders notice and start buying.
Distribution Phase
Big players slowly sell to latecomers.
Market looks like it’s topping out.
Price often moves sideways again.
Downtrend/Decline Phase
Price starts making lower highs and lower lows.
Panic selling happens.
Eventually, smart money will start accumulating again → cycle repeats.
2.4 Break of Structure (BOS) & Change of Character (ChoCh)
Two important concepts:
Break of Structure (BOS): when price breaks the previous high/low, signaling continuation of trend.
Change of Character (ChoCh): when price shifts from uptrend to downtrend (or vice versa). This often signals a reversal.
📌 Example:
If Bank Nifty keeps making higher highs but suddenly makes a lower low, that’s a ChoCh – trend may reverse.
2.5 Market Structure Across Timeframes
On higher timeframes (daily/weekly) → structure shows the big trend.
On lower timeframes (5-min, 15-min) → structure shows intraday opportunities.
Smart traders align both (called multi-timeframe analysis).
3. Understanding Volume Profile
Now that we understand how price moves, let’s look at the Volume Profile – the tool that shows where traders are most active.
3.1 What is Volume Profile?
Unlike the normal volume indicator (bars at the bottom of the chart showing volume per time), Volume Profile plots volume at each price level.
So instead of asking: “How much was traded at 10:30 AM?”
We ask: “How much was traded at ₹19,200, ₹19,300, ₹19,400?”
This gives a much clearer picture of where buyers and sellers are fighting hardest.
3.2 Key Elements of Volume Profile
POC (Point of Control):
The price level where the highest volume was traded.
Acts like a magnet – price often returns to this level.
Value Area (VA):
The range of prices where around 70% of the volume occurred.
Consists of:
VAH (Value Area High): top of this range.
VAL (Value Area Low): bottom of this range.
High Volume Nodes (HVN):
Price zones with heavy volume.
Represent areas of acceptance (market agrees fair value is here).
Low Volume Nodes (LVN):
Price zones with very little volume.
Represent areas of rejection (market quickly moved away).
📌 Simple Analogy:
Imagine an auction. Where people bid the most (POC), that’s the “fair price.” Places where few bids happen (LVN) are “unwanted” areas.
3.3 Why Volume Profile Matters
Shows real support & resistance (not just lines on charts).
Helps spot false breakouts (price goes above resistance but fails if volume is low).
Identifies where big players (institutions) are active.
3.4 Difference Between Volume Profile & Normal Volume
Normal Volume: tells when activity happened.
Volume Profile: tells where activity happened.
4. Combining Market Structure with Volume Profile
This is where magic happens.
Market structure tells us direction, and volume profile tells us important levels. Together, they give high-probability setups.
4.1 Example Setup: Trend Confirmation
If market is in uptrend (HH, HL structure) →
Look at POC/VAH. If price holds above these, trend is strong.
4.2 Example Setup: Reversal Spotting
If price breaks structure (ChoCh) AND rejects at an LVN, it signals strong reversal.
4.3 Example Setup: Liquidity Zones
Many traders put stop losses above resistance/below support.
Volume Profile helps spot whether these breakouts are real (with volume) or fake (low volume).
5. Trading Strategies Using Market Structure + Volume Profile
Let’s go through practical trading approaches.
5.1 Trend Trading Strategy
Identify trend with market structure (HH/HL for uptrend, LH/LL for downtrend).
Use POC/VAH/VAL as entry levels.
Enter with trend direction, place stop below VAL (for long) or above VAH (for short).
5.2 Range Trading Strategy
If market is sideways → watch Value Area.
Buy near VAL, sell near VAH.
Exit near POC.
5.3 Breakout Strategy
If market breaks resistance with high volume (confirmed by VP), enter breakout.
If breakout happens at LVN, it usually moves fast.
5.4 Reversal Strategy
Look for ChoCh in market structure.
Confirm with rejection at HVN/LVN.
Enter opposite direction.
5.5 Scalping (Intraday)
Use lower timeframes (5-min, 15-min).
Enter at POC retests.
Target small moves (20–30 points in Nifty).
5.6 Swing Trading (Positional)
Use higher timeframe VP (daily/weekly).
Identify major HVN (support) & LVN (breakout zones).
Ride bigger moves.
6. Risk Management & Psychology
Even with the best tools, without risk management you can lose money.
Stop Loss: always place stops beyond HVN/LVN levels.
Position Sizing: never risk more than 1–2% of capital per trade.
Patience: wait for price to confirm at volume profile levels, don’t jump early.
Discipline: follow your system, don’t let emotions rule.
7. Common Mistakes Traders Make
Ignoring Higher Timeframe Levels → focusing only on 5-min charts without seeing big picture.
Chasing Breakouts Without Volume Confirmation → leads to false breakout traps.
Overloading Chart with Indicators → volume profile + market structure are enough.
No Risk Management → one bad trade wipes profits.
8. Conclusion & Key Takeaways
Market Structure = Direction (trend, BOS, ChoCh, HH/HL, LH/LL).
Volume Profile = Importance (POC, VAH, VAL, HVN, LVN).
Combined → they show who controls the market and where to enter/exit safely.
📌 Golden Rule:
Trade with the structure and around the volume zones → your accuracy improves dramatically.
By using both tools together, you stop trading blindly and start trading with the footsteps of institutions.
Divergence SecretsRisks & Rewards in Option Trading
Option trading can be thrilling, but it’s not without risks.
For Buyers:
Maximum loss = premium paid.
Maximum profit = potentially unlimited (for calls) or huge (for puts).
For Sellers:
Maximum gain = premium received.
Maximum loss = unlimited (for calls) or very large (for puts).
Risks also come from:
Time decay (options lose value daily).
Volatility crush (sudden drop in implied volatility can reduce premiums).
Liquidity issues (wide bid-ask spreads can hurt execution).
That’s why risk management (stop-losses, proper sizing, hedging) is crucial.
Option Trading vs Stock Trading
Stocks = Ownership, long-term growth, dividends.
Options = Contracts, leverage, flexible strategies.
Stocks = Simpler, but capital-intensive.
Options = Complex, but require less capital and offer hedging.
For example:
Buying 100 shares of Reliance at ₹2500 = ₹2,50,000.
Buying 1 call option of Reliance at ₹100 premium with lot size 250 = only ₹25,000.
This leverage makes options attractive—but also riskier.

Part 3 Trading Master Class Option Trading in India (2025 Context)
India has seen an explosive rise in options trading. NSE reports show daily options turnover crossing ₹300 trillion in notional value.
Popular contracts:
Nifty 50 Weekly Options
Bank Nifty Weekly Options
FinNifty, Sensex, and Stock Options
Retail traders prefer weekly expiries because they are cheaper and offer fast opportunities. Institutions use monthly contracts for hedging and spreads.
10. Option Trading Psychology
Success in options is not just about strategies; it’s about mindset.
Discipline: Stick to stop-loss and position sizing.
Avoid Greed: Do not sell naked options without risk management.
Patience: Not every day is a trading day.
Continuous Learning: Market conditions and volatility regimes keep changing.

Trading Master Class With ExpertsBasic Concepts & Terminology
Before going deeper, let’s simplify the core terms in options trading:
Strike Price: The fixed price at which the buyer can buy (call) or sell (put) the asset.
Expiry Date: The date on which the option contract expires (e.g., weekly or monthly).
Option Premium: The cost paid by the buyer to the seller for getting this right.
Lot Size: Options are traded in lots, not single shares. Example: Nifty option lot = 50 units.
In-the-Money (ITM): When exercising the option is profitable.
Out-of-the-Money (OTM): When exercising the option is not profitable.
At-the-Money (ATM): When the strike price = current price of the underlying asset.
Example:
Suppose Reliance is trading at ₹2,500.
A Call option with strike 2,400 is ITM (because you can buy at 2,400, lower than 2,500).
A Put option with strike 2,600 is ITM (because you can sell at 2,600, higher than 2,500).

Quarterly Results TradingIntroduction
Quarterly results season is one of the most awaited periods in the stock market. For traders and investors alike, it brings excitement, volatility, and opportunities. Every three months, listed companies release their financial performance – revenues, profits, margins, guidance, and other key details. These numbers act as a report card for the company and often determine its short-term price direction.
For traders, this is not just about numbers but about market expectations versus reality. A company may post a strong profit jump, yet the stock could fall because the market expected even better. On the other hand, sometimes, even a small improvement compared to expectations can cause a stock to rally.
Quarterly results trading, therefore, is not simply about reading earnings reports but about understanding the psychology of the market, expectations, and how to position yourself before and after results.
1. Why Quarterly Results Matter
Quarterly results matter because:
Transparency: Companies must show how they are performing every three months, which helps investors evaluate progress.
Guidance: Many managements provide an outlook for upcoming quarters, shaping future stock expectations.
Catalyst for Price Movements: Earnings often trigger sharp stock moves – sometimes 5%, 10%, or even 20% in a single session.
Sectoral Trends: Results reveal which sectors are thriving (IT, banking, auto, FMCG, etc.) and which are struggling.
Macro Signals: Aggregated earnings give insight into the broader economy (e.g., consumer demand, credit growth, exports).
For traders, this creates volatility, and volatility equals opportunity.
2. Market Psychology During Earnings Season
Quarterly results trading is deeply tied to psychology. Here’s how it works:
Expectations vs Reality:
The market often “prices in” expectations before results. If analysts expect a 20% profit growth, and the company delivers only 18%, the stock may fall, even though profits grew.
Rumors & Hype:
Ahead of results, speculation and insider whispers move prices. “Buy on rumor, sell on news” often plays out.
Overreaction:
Investors sometimes overreact to one quarter. A temporary slowdown could cause panic selling, even if the long-term story remains intact.
Guidance Shock:
A company may post strong results but issue weak future guidance – causing a selloff. Conversely, weak results with strong future guidance may spark a rally.
3. Phases of Quarterly Results Trading
Quarterly earnings season typically unfolds in phases:
Pre-Results Run-Up (Speculation Phase):
Stocks often rally or decline based on rumors, channel checks, or analyst previews before official numbers.
Results Day (Volatility Spike):
Stocks witness sharp intraday moves – sometimes with gaps up/down at opening.
Immediate Reaction (1–3 days):
Price stabilizes based on how results compare with expectations and analyst commentary.
Post-Results Trend (1–4 weeks):
Institutional investors re-adjust portfolios, leading to sustained trends.
A good trader aligns strategies with these phases.
4. Key Metrics Traders Watch
When analyzing quarterly results, traders focus on:
Revenue (Top Line): Growth shows demand.
EBITDA & Operating Margin: Profitability efficiency.
Net Profit (Bottom Line): Final earnings after expenses.
Earnings Per Share (EPS): Direct impact on valuations.
Management Commentary/Guidance: Future growth outlook.
Order Book / New Contracts (for IT, infra, manufacturing).
Asset Quality (for Banks/NBFCs): NPA ratios, credit growth.
Volume Growth (for FMCG/Auto): Real demand indicator.
For traders, sometimes just one line in the commentary can swing sentiment.
5. Trading Strategies for Quarterly Results
A. Pre-Results Strategy (Speculative Positioning)
Approach: Buy/sell before results based on expectations.
Risk: Very high – numbers can surprise.
Tip: Suitable for experienced traders who can manage volatility.
B. Results-Day Strategy (Event Trading)
Approach: Trade intraday on sharp moves.
Tactics:
Momentum trading: Enter in direction of breakout.
Straddle/Strangle (Options): Trade volatility without directional bias.
Risk: Requires speed and discipline.
C. Post-Results Strategy (Confirmation Trading)
Approach: Wait for results + market reaction, then take position.
Example: If strong results + positive commentary + high volume buying, then go long for few weeks.
Advantage: Lower risk as clarity emerges.
D. Sector Rotation Strategy
Approach: Use results of large companies to gauge sector trend.
Example: If Infosys and TCS post strong results, smaller IT stocks may rally too.
E. Options Trading Around Results
Implied Volatility (IV): Rises before results due to uncertainty.
Strategy: Sell options after results when IV crashes (“volatility crush”).
Advanced Plays: Earnings straddles, iron condors, covered calls.
6. Case Studies (Indian Market Context)
Case 1: Infosys Quarterly Results
If Infosys posts weak guidance, entire IT sector (TCS, Wipro, HCLTech) reacts negatively.
Example: A 5% fall in Infosys can drag IT index down sharply.
Case 2: HDFC Bank Results
Being the largest bank, its results often set tone for entire banking sector.
NII growth, loan book expansion, and NPAs become benchmarks for peers.
Case 3: Maruti Suzuki Results
Auto stocks move not just on profits but on commentary about demand, chip supply, or new launches.
These show how one company’s results ripple across the market.
7. Risks in Quarterly Results Trading
Quarterly results trading is lucrative but risky. Main risks include:
Gap Openings: Stock may open with a huge gap, giving no chance to enter/exit.
Unexpected Commentary: Good numbers but weak guidance → stock falls.
Over-Leverage: Many traders use derivatives; sudden adverse moves cause big losses.
Noise vs Reality: Temporary slowdown may cause panic, while long-term fundamentals remain solid.
IV Crush in Options: Buying options before results often leads to losses post-results due to volatility collapse.
Risk management (stop-losses, position sizing) is essential.
8. Institutional vs Retail Traders
Institutional Investors:
Rely on detailed models, channel checks, analyst calls, and management interaction. They often position well in advance.
Retail Traders:
Often react after results, chasing momentum. Many fall into traps of speculative positioning without risk control.
Smart Approach for Retail:
Focus more on post-results trends rather than gambling pre-results.
9. Tools for Quarterly Results Trading
Earnings Calendar: NSE/BSE announcements.
Analyst Previews & Consensus Estimates: To know market expectations.
Financial Websites (Moneycontrol, Bloomberg, ET Markets): Quick numbers + commentary.
Charting Tools: Volume analysis, support/resistance for trading.
Options Data (OI, IV): To read market positioning.
10. Best Practices for Traders
Never trade all results – pick familiar sectors/stocks.
Avoid over-leverage; one wrong result can wipe out account.
Use options to hedge positions.
Study sector leaders first, then trade smaller peers.
Focus not just on results but on guidance and commentary.
If unsure, wait for confirmation trend post-results.
11. Long-Term Investor Angle
While traders focus on short-term volatility, long-term investors use quarterly results to:
Track consistent growth.
Evaluate management honesty.
Spot red flags (declining margins, debt buildup).
Accumulate during temporary corrections.
Thus, quarterly results season is not just for traders but also crucial for long-term positioning.
12. Global Context
Quarterly results trading is a global phenomenon:
US Markets: Tech giants like Apple, Amazon, Tesla move entire indices on results.
India: Banks, IT, and Reliance often dominate market direction.
Europe/Asia: Results reflect global demand and supply chain trends.
Indian traders increasingly follow US results (like Nasdaq tech earnings) to predict Indian IT stocks.
13. The Future of Quarterly Results Trading
With AI-driven trading and algorithmic models, quarterly results trading is evolving:
Algo Systems: Scan results instantly and trigger trades in seconds.
Social Media Sentiment: Twitter, Telegram groups influence sentiment.
Data Analytics: Alternative data (app downloads, credit card spending) gives early hints of results.
For retail traders, human intuition + discipline will remain valuable, but tech adoption is rising.
Conclusion
Quarterly results trading is one of the most exciting times in the stock market. It blends fundamentals, technicals, and psychology into a high-volatility environment. For traders, the key lies in understanding expectations, preparing strategies for different phases (pre-results, results day, post-results), and managing risk wisely.
Done right, quarterly results season can offer some of the biggest short-term opportunities in trading. Done wrong, it can lead to painful losses. The difference comes down to preparation, patience, and discipline.

Part 1 Support And ResistanceIntroduction to Options Trading
Options trading is one of the most flexible and powerful tools in the financial markets. Unlike stocks, where you simply buy and sell ownership of a company, options are derivative contracts that give you the right, but not the obligation, to buy or sell an underlying asset at a predetermined price within a specified time frame.
The beauty of options lies in their strategic possibilities — they allow traders to make money in rising, falling, or even sideways markets, often with less capital than buying stocks outright. But with that flexibility comes complexity, so understanding strategies is crucial.
Key Terms in Options Trading
Before we jump into strategies, let’s understand the key terms:
Call Option – Gives the right to buy the underlying asset at a fixed price (strike price) before expiry.
Put Option – Gives the right to sell the underlying asset at a fixed price before expiry.
Strike Price – The price at which you can buy/sell the asset.
Premium – The price you pay to buy an option.
Expiry Date – The date the option contract ends.
ITM (In-the-Money) – When exercising the option would be profitable.
ATM (At-the-Money) – Strike price is close to the current market price.
OTM (Out-of-the-Money) – Option has no intrinsic value yet.
Lot Size – Minimum number of shares/contracts per option.
Intrinsic Value – The real value if exercised now.
Time Value – Extra premium based on time left to expiry.

Trading Goals & ObjectivesIntroduction
Trading in the financial markets is not just about buying low and selling high. It is an art, a science, and a disciplined journey. Every successful trader—whether in stocks, forex, commodities, or cryptocurrencies—has one common trait: a clear set of goals and objectives. Without them, trading becomes directionless, impulsive, and emotionally draining.
Imagine stepping into the market without knowing what you want to achieve. Do you want to build wealth long-term, generate monthly income, or simply learn how markets move? Without goals, traders chase random trades, over-leverage, and often give in to fear and greed. With goals, trading becomes structured—like a business plan where you know your target audience, resources, and profit expectations.
In this guide, we’ll take a deep dive into trading goals and objectives—why they matter, how to set them, how to align them with your personality and capital, and how they evolve as you grow as a trader.
1. Why Goals Matter in Trading
Clarity of Purpose
Goals give you a “why.” Trading is tough, and there will be losing days. Without a clear reason for trading, setbacks can feel meaningless and discouraging.
Measurement of Progress
A trader without goals cannot measure success. Making ₹50,000 in a month means nothing if you don’t know whether your goal was income generation, capital growth, or skill development.
Accountability
Goals create a framework of accountability. Just like in business, where profits and KPIs matter, trading needs benchmarks.
Discipline Anchor
Emotional swings are the biggest enemy of traders. Goals act as anchors, reminding you not to overtrade or deviate from your plan.
2. Types of Trading Goals
Trading goals are not one-size-fits-all. They vary based on a trader’s stage, style, and capital. Broadly, they can be divided into short-term, medium-term, and long-term goals.
A. Short-Term Goals (Daily/Weekly)
These are immediate, tactical goals that help a trader stay disciplined:
Limiting the number of trades per day.
Avoiding revenge trading.
Maintaining a win/loss ratio journal.
Risking no more than 1–2% of account per trade.
Ending the week green, regardless of how small.
B. Medium-Term Goals (Monthly/Quarterly)
These involve skill-building and consistency:
Achieving 3–5% monthly account growth.
Increasing position size only after three profitable months.
Learning advanced strategies like options spreads, market profile, or algo trading.
Improving risk-to-reward ratios (e.g., aiming for 2:1 instead of 1:1).
C. Long-Term Goals (Yearly/Multi-Year)
These define the bigger picture:
Growing capital from ₹5 lakhs to ₹20 lakhs in 3 years.
Building trading as a full-time career.
Achieving financial independence through trading income.
Developing your own system or algorithm.
Managing capital for friends/family or starting a fund.
3. Common Trading Objectives
While goals are broader, objectives are specific, measurable, and actionable. Here are some realistic objectives traders should set:
Capital Preservation
Rule #1 of trading: protect your capital. Without capital, you cannot trade. Many traders set an objective to never lose more than 10–15% of their account in a year.
Consistent Returns
Instead of aiming for 200% returns overnight, a practical objective is 2–5% monthly growth. Small, consistent returns compound massively over years.
Risk Management Mastery
Keep maximum risk per trade at 1–2%.
Use stop-loss in every trade.
Diversify strategies.
Skill Development
Trading is a skill-based profession. Objectives can include:
Learning technical analysis (charts, candlesticks, indicators).
Understanding fundamentals.
Practicing order flow or volume profile.
Emotional Discipline
Set objectives around psychology:
No impulsive trades.
No checking P&L during open positions.
Accepting losses without frustration.
Process-Oriented Goals
For many traders, objectives are not about money but about process:
Journaling trades daily.
Reviewing weekly mistakes.
Following a strict entry/exit rulebook.
4. SMART Framework for Trading Goals
Goals work best when they are SMART: Specific, Measurable, Achievable, Relevant, Time-Bound.
Specific: “Make 2% profit per week” is better than “Make money.”
Measurable: Track win rate, risk-reward ratio, monthly returns.
Achievable: Don’t aim to turn ₹1 lakh into ₹10 lakh in 6 months.
Relevant: Goals must fit your life (full-time job traders can’t monitor intraday scalps all day).
Time-Bound: “Reach ₹10 lakhs in 3 years” provides focus.
5. Aligning Goals with Trading Styles
Each trading style has unique goals:
Scalpers: High win rate, small profits, strict discipline. Goal: earn 10–20 trades per day with 1–2 ticks profit.
Day Traders: Capture intraday momentum. Goal: 2–3% daily returns, avoid overnight risk.
Swing Traders: Hold positions for days/weeks. Goal: catch bigger moves with fewer trades.
Investors/Position Traders: Focus on wealth building. Goal: double portfolio in 5–7 years with minimal stress.
6. Psychological Aspect of Goals
Many traders fail not because their strategies are weak, but because their goals are unrealistic.
Setting a goal of “I must double my account in 3 months” creates pressure → emotional decisions → big losses.
Realistic goals like “survive the first year without blowing up” or “be consistent for 6 months” help traders grow steadily.
7. Examples of Good vs. Bad Goals
Bad Goal: “I want to make ₹1 crore quickly.”
Good Goal: “I want to make 3% per month consistently for 12 months.”
Bad Goal: “I will never lose a trade.”
Good Goal: “I will limit loss per trade to 1.5% of my capital.”
Bad Goal: “I want to quit my job next month and trade full-time.”
Good Goal: “I will build a 2-year track record before considering trading full-time.”
8. Building a Trading Goal Roadmap
A practical roadmap could look like this:
First 3 Months: Focus on learning and paper trading. Goal: survive, not profit.
3–6 Months: Small capital live trading, strict risk management. Goal: consistency.
6–12 Months: Improve strategies, refine journaling, slowly scale lot size.
Year 2–3: Grow account steadily, build confidence, test advanced strategies.
Year 3–5: Transition towards professional trading (income replacement, capital management).
9. Tracking & Reviewing Goals
A goal is meaningless if not tracked. Traders should:
Maintain a trading journal (entries, exits, reasons, mistakes).
Track performance metrics: win rate, risk-reward, average loss vs. profit.
Review weekly/monthly.
Adjust goals if unrealistic or too easy.
10. Challenges in Achieving Goals
Overconfidence after a winning streak.
Fear & hesitation after losses.
Market volatility disrupting strategies.
Lack of patience in long-term goals.
External distractions (job, family, stress).
Overcoming these requires not just a strong trading system, but mental resilience.
11. Case Study: Two Traders
Trader A: No goals, trades randomly. Sometimes makes big profits, but loses more. Blames market. Ends year negative.
Trader B: Goal is 3% per month, risks max 1% per trade. Keeps a journal. Ends year with 25% return and improved skills. Over time, Trader B grows exponentially.
This shows the power of structured goals.
12. Final Thoughts
Trading goals and objectives are not about dreaming big overnight. They are about creating a roadmap, staying disciplined, and building consistency. Success in markets is a marathon, not a sprint.
Goals give direction.
Objectives make them actionable.
Tracking ensures accountability.
Discipline ensures survival.
A trader who sets realistic, measurable, and process-oriented goals will not only survive but thrive in the long run.
US 10 YEAR BOND YIELD HEAD TO MOONBuckle Up, the situation looks perilous and such high interest rate will break the backbone
THE KING TRADER

US- 10 YR Yield - Upside Push - 3rd WaveUS 10 Year Yield is showing a near term completion of 2nd wave (corrective wave) and 3rd wave might start within few weeks or before indicating a higher yield push to the range of 9%.
Trump Tariff Tantrums and Indian MarketsAs Trump Tariffs continue to shock and guide global assets, Indian equities are also not spared. This video tries to co-relate US yields, Gold, Oil, Indian bond yields, USDINR and Indian equities and make sense of all that is happenning globally and what can be the impact of that in the future for retail investors.
We also visit our Algo on ETFs and see how this has performed in the current turmoil.

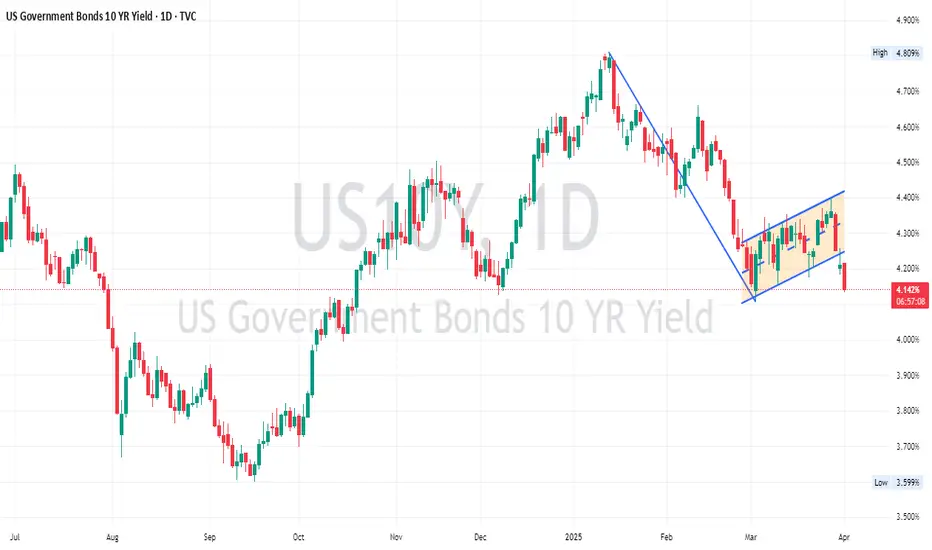
Bear Flag materializing in US 1O Year Yield (US10Y)US 10 Year yield suggests markets are moving towards risk off environment.
The fundamental causes for yields to fall are complex and difficult to disentangle - geopolitics, macro reasons, uncertainty, inflation risk, recession risk etc.
This will further put pressure on Stock Markets (equities).
The current trend looks bearish for US10Y.
Trade Safe
Database Part 2Options are a type of contract that gives the buyer the right to buy or sell a security at a specified price at some point in the future. An option holder is essentially paying a premium for the right to buy or sell the security within a certain time frame.
Option trading is largely a skill requiring knowledge of market trends, strategies, and risk management techniques. While there is an element of uncertainty in the markets, successful traders rely on analysis, planning, and discipline rather than luck.

Technical AnalysisTechnical analysis is a means of examining and predicting price movements in the financial markets, by using historical price charts and market statistics. It is based on the idea that if a trader can identify previous market patterns, they can form a fairly accurate prediction of future price trajectories.
Technical analysis is a strategy for predicting movement in the stock market, or other securities markets, that relies on information from short periods of time. For this reason, day traders or other short-term traders often use technical analysis.
