RSI: chart overlay
This indicator maps RSI thresholds directly onto price. Since the EMA of price aligns with RSI’s 50-line, it draws a volatility-based band around the EMA to reveal levels such as 70 and 30.
By converting RSI values into visible price bands, the overlay lets you see exactly where price would have to move to hit traditional RSI boundaries. These bands adapt in real time to both price movement and market volatility, keeping the classic RSI logic intact while presenting it in the context of price action. This approach helps traders interpret RSI signals without leaving the main chart window.
The calculation uses the same components as the RSI: alternative derivation script: Wilder’s EMA for smoothing, a volatility-based unit for scaling, and a normalization factor. The result is a dynamic band structure on the chart, representing RSI boundary levels in actual price terms.
Key components and calculation breakdown:
Wilder’s EMA
Used as the anchor point for measuring price position.
myEMA = ta.rma(close, Length)
Volatility Unit
Derived from the EMA of absolute close-to-close price changes.
CC_vol = ta.rma(math.abs(close - close ), Length)
Normalization Factor
Scales the volatility unit to align with the RSI formula’s structure.
normalization_factor = 1 / (Length - 1)
Upper and Lower Boundaries
Defines price bands corresponding to selected RSI threshold values.
up_b = myEMA + ((upper - 50) / 50) * (CC_vol / normalization_factor)
down_b = myEMA - ((50 - lower) / 50) * (CC_vol / normalization_factor)
Inputs
RSI length
Upper boundary – RSI level above 50
Lower boundary – RSI level below 50
ON/OFF toggle for 50-point line (EMA of close prices)
ON/OFF toggle for overbought/oversold coloring (use with line chart)
Interpretation:
Each band on the chart represents a chosen RSI level.
When price touches a band, RSI is at that threshold.
The distance between moving average and bands adjusts automatically with volatility and your selected RSI length.
All calculations remain fully consistent with standard RSI values.
Feedback and code suggestions are welcome, especially regarding implementation efficiency and customization.
Bands and Channels

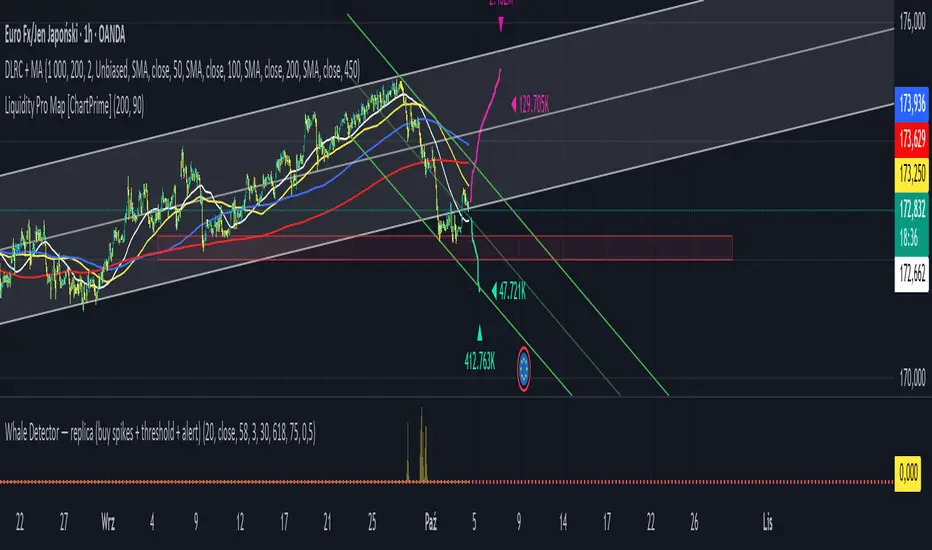
Jarass regression linesDouble Linear Regression Ultimate + MA Ribbon (DLRC + MA)
The DLRC + MA indicator is an advanced technical analysis tool that combines double linear regression channels with a moving average ribbon (MA Ribbon). Designed for traders who want to simultaneously track trend, volatility, and potential support/resistance levels.
Key Features:
1. Double Linear Regression Channels:
• Inner Channel – shorter period, more sensitive to recent price movements.
• Outer Channel – longer period, reflects the long-term trend.
• Both channels display upper and lower boundaries and a midline.
• Optional logarithmic scale for price adjustment.
• Real-time R² values to assess regression accuracy.
2. MA Ribbon:
• Up to 4 different moving averages simultaneously.
• Supports SMA, EMA, SMMA (RMA), WMA, VWMA.
• Each MA can be individually enabled/disabled, with customizable period, source, and color.
• Helps identify trend direction and dynamic support/resistance levels.
3. Visualization:
• Channels are filled with semi-transparent colors for clarity.
• Midline for quick trend direction assessment.
• Label displays R² values of the channels in real time.
4. Suitable For:
• Short-term and long-term traders seeking a combination of linear regression analysis and classic trend-following tools.
• Useful for identifying overbought/oversold zones and potential trend reversal points.
Summary:
DLRC + MA combines statistical precision of linear regression with intuitive trend visualization via a MA ribbon. It provides quick insight into market direction, volatility, and potential turning points, all in one chart overlay.
John Bollinger's Bollinger BandsJapanese below / 日本語説明は下記
This indicator replicates how John Bollinger, the inventor of Bollinger Bands, uses Bollinger Bands, displaying Bollinger Bands, %B and Bandwidth in one indicator with alerts and signals.
Bollinger Bands is created by John Bollinger in 1980s who is an American financial trader and analyst. He introduced %B and Bandwidth 30 years later.
🟦 What's different from other Bollinger Bands indicator?
Unlike the default Bollinger Bands or other custom Bollinger Bands indicators on TradingView, this indicator enables to display three Bollinger Bands tools into a single indicator with signals and alerts capability.
You can plot the classic Bollinger Bands together with either %B or Bandwidth or three tools altogether which requires the specific setting(see below settings).
This makes it easy to quantitatively monitor volatility changes and price position in relation to Bollinger Bands in one place.
🟦 Features:
Plots Bollinger Bands (Upper, Basis, Lower) with fill between bands.
Option to display %B or Bandwidth with Bollinger Bands.
Plots highest and lowest Bandwidth levels over a customizable lookback period.
Adds visual markers when Bandwidth reaches its highest (Bulge) or lowest (Squeeze) value.
Includes ready-to-use alert conditions for Bulge and Squeeze events.
📈Chart
Green triangles and red triangles in the bottom chart mark Bulges and Squeezes respectively.
🟦 Settings:
Length: Number of bars used for Bollinger Band middleline calculation.
Basis MA Type: Choose SMA, EMA, SMMA (RMA), WMA, or VWMA for the midline.
StdDev: Standard deviation multiplier (default = 2.0).
Option: Select "Bandwidth" or "%B" (add the indicator twice if you want to display both).
Period for Squeeze and Bulge: Lookback period for detecting the highest and lowest Bandwidth levels.(default = 125 as specified by John Bollinger )
Style Settings: Colors, line thickness, and transparency can be customized.
📈Chart
The chart below shows an example of three Bollinger Bands tools: Bollinger Band, %B and Bandwidth are in display.
To do this, you need to add this indicator TWICE where you select %B from Option in the first addition of this indicator and Bandwidth from Option in the second addition.
🟦 Usage:
🟠Monitor Volatility:
Watch Bandwidth values to spot volatility contractions (Squeeze) and expansions (Bulge) that often precede strong price moves.
John Bollinger defines Squeeze and Bulge as follows;
Squeeze:
The lowest bandwidth in the past 125 period, where trend is born.
Bulge:
The highest bandwidth in the past 125 period where trend is going to die.
According to John Bollinger, this 125 period can be used in any timeframe.
📈Chart1
Example of Squeeze
You can see uptrends start after squeeze(red triangles)
📈Chart2
Example of Bulge
You can see the trend reversal from downtrend to uptrends at the bulge(green triangles)
📈Chart3
Bulge DOES NOT NECESSARILY mean the beginning of a trend in opposite direction.
For example, you can see a bulge happening in the right side of the chart where green triangles are marked. Nevertheless, uptrend still continues after the bulge.
In this case, the bulge marks the beginning of a consolidation which lead to the continuation of the trend. It means that a phase of the trend highlighted in the light blue box came to an end.
Note: light blue box is not drawn by the indicator.
Like other technical analysis methods or tools, these setups do not guarantee birth of new trends and trend reversals. Traders should be carefully observing these setups along with other factors for making decisions.
🟠Track Price Position:
Use %B to see where price is located in relation to the Bollinger Bands.
If %B is close to 1, the price is near upper band while %B is close to 0, the price is near lower band.
🟠Set Alerts:
Receive alerts when Bandwidth hits highest and lowest values of bandwidth, helping you prepare for potential breakout, ending of trends and trend reversal opportunities.
🟠Combine with Other Tools:
This indicator would work best when combined with price action, trend analysis, or
market environmental analysis.
—————————————————————————————
このインジケーターはボリンジャーバンドの考案者であるジョン・ボリンジャー氏が提唱するボリンジャーバンドの使い方を再現するために、ボリンジャーバンド、%B、バンドウィズ(Bandwidth) の3つを1つのインジケーターで表示可能にしたものです。シグナルやアラートにも対応しています。
ボリンジャーバンドは1980年代にアメリカ人トレーダー兼アナリストのジョン・ボリンジャー氏によって開発されました。彼はその30年後に%Bとバンドウィズを導入しました。
🟦 他のボリンジャーバンドとの違い
TradingView標準のボリンジャーバンドや他のボリンジャーバンドとは異なり、このインジケーターでは3つのボリンジャーバンドツールを1つのインジケーターで表示し、シグナルやアラート機能も利用できるようになっています。
一般的に知られている通常のボリンジャーバンドに加え、%Bやバンドウィズを組み合わせて表示でき、設定次第では3つすべてを同時にモニターすることも可能です。これにより、価格とボリンジャーバンドの位置関係とボラティリティ変化をひと目で、かつ定量的に把握することができます。
🟦 機能:
ボリンジャーバンド(アッパーバンド・基準線・ロワーバンド)を描画し、バンド間を塗りつぶし表示。
オプションで%Bまたはバンドウィズを追加表示可能。
バンドウィズの最高値・最安値を、任意の期間で検出して表示。
バンドウィズが指定期間の最高値(バルジ※)または最安値(スクイーズ)に達した際にシグナルを表示。
※バルジは一般的にボリンジャーバンドで用いられるエクスパンションとほぼ同じ意味ですが、定義が異なります。(下記参照)
バルジおよびスクイーズ発生時のアラート設定が可能。
📈 チャート例
下記チャートの緑の三角と赤の三角は、それぞれバルジとスクイーズを示しています。
🟦 設定:
Length: ボリンジャーバンドの基準線計算に使う期間。
Basis MA Type: SMA, EMA, SMMA (RMA), WMA, VWMAから選択可能。
StdDev: 標準偏差の乗数(デフォルト2.0)。
Option: 「Bandwidth」または「%B」を選択(両方表示するにはこのインジケーターを2回追加)。
Period for Squeeze and Bulge: Bandwidthの最高値・最安値を検出する期間(デフォルトはジョン・ボリンジャー氏が推奨する125)。
Style Settings: 色、線の太さ、透明度などをカスタマイズ可能。
📈 チャート例
下のチャートは「ボリンジャーバンド」「%B」「バンドウィズ」の3つを同時に表示した例です。
この場合、インジケーターを2回追加し、最初に追加した方ではOptionを「%B」に、次に追加した方では「Bandwidth」を選択します。
🟦 使い方:
🟠 ボラティリティを監視する:
バンドウィズの値を見ることで、価格変動の収縮(スクイーズ)や拡大(バルジ)を確認できます。
これらはしばしば強い値動きの前兆となります。
ジョン・ボリンジャー氏はスクイーズとバルジを次のように定義しています:
スクイーズ: 過去125期間の中で最も低いバンドウィズ→ 新しいトレンドが生まれる場所。
バルジ: 過去125期間の中で最も高いバンドウィズ → トレンドが終わりを迎える場所。
この「125期間」はどのタイムフレームでも利用可能とされています。
📈 チャート1
スクイーズの例
赤い三角のスクイーズの後に上昇トレンドが始まっているのが確認できます。
📈 チャート2
バルジの例
緑の三角のバルジの箇所で下降トレンドから上昇トレンドへの反転が見られます。
📈 チャート3
バルジが必ずしも反転を意味しない例
下記のチャート右側の緑の三角で示されたバルジの後も、上昇トレンドが継続しています。
この場合、バルジは反転ではなく「トレンド一時的な調整(レンジ入り)」を示しており、結果的に上昇トレンドが継続しています。
この場合、バルジは水色のボックスで示されたトレンドのフェーズの終わりを示しています。
※水色のボックスはインジケーターが描画したものではありません。
また、他のテクニカル分析と同様に、これらのセットアップは必ず新しいトレンドの発生やトレンド転換を保証するものではありません。トレーダーは他の要素も考慮し、慎重に意思決定する必要があります。
🟠 価格とボリンジャーバンドの位置関係を確認する:
%Bを利用すれば、価格がバンドのどこに位置しているかを簡単に把握できます。
%Bが1に近ければ価格はアッパーバンド付近、0に近ければロワーバンド付近にあります。
🟠 アラートを設定する:
バンドウィズが一定期間の最高値または最安値に到達した際にアラートを設定することで、ブレイクアウトやトレンド終了、反転の可能性に備えることができます。
🟠 他のツールと組み合わせる:
このインジケーターは、プライスアクション、トレンド分析、環境認識などと組み合わせて活用すると最も効果的です。

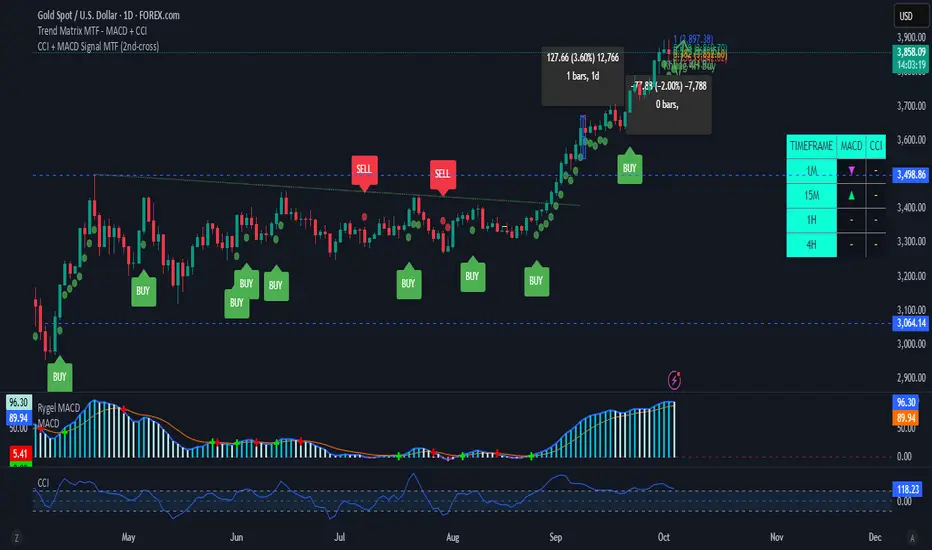
CCI + MACD Signal MTF (2nd-cross)This custom indicator combines the Commodity Channel Index (CCI) and the MACD to generate trading signals.
Basic signals (dots):
A green dot is plotted when CCI is above +100 and MACD is positive.
A red dot is plotted when CCI is below –100 and MACD is negative.
These dots help visualize momentum alignment between the two indicators.
Second-cross signals (text + alert):
The indicator also tracks cycles of the CCI.
When CCI first moves above +100 and later falls back below +100, this is counted as one completed cycle.
The next time CCI crosses back above +100 (the second cross), if MACD is still positive, a “BUY” label is plotted and a buy alert is triggered.
Conversely, when CCI first moves below –100 and later rises back above –100, that is one completed cycle.
The next time CCI crosses back below –100 (the second cross), if MACD is negative, a “SELL” label is plotted and a sell alert is triggered.
Alerts:
Alerts are only fired on the second-cross events (BUY or SELL), making them rarer but potentially more reliable than the basic dot conditions.
Timeframe flexibility:
Both the CCI and the MACD can be calculated on custom timeframes independently of the chart’s timeframe.
Fisher Transform Trend Navigator [QuantAlgo]🟢 Overview
The Fisher Transform Trend Navigator applies a logarithmic transformation to normalize price data into a Gaussian distribution, then combines this with volatility-adaptive thresholds to create a trend detection system. This mathematical approach helps traders identify high-probability trend changes and reversal points while filtering market noise in the ever-changing volatility conditions.
🟢 How It Works
The indicator's foundation begins with price normalization, where recent price action is scaled to a bounded range between -1 and +1:
highestHigh = ta.highest(priceSource, fisherPeriod)
lowestLow = ta.lowest(priceSource, fisherPeriod)
value1 = highestHigh != lowestLow ? 2 * (priceSource - lowestLow) / (highestHigh - lowestLow) - 1 : 0
value1 := math.max(-0.999, math.min(0.999, value1))
This normalized value then passes through the Fisher Transform calculation, which applies a logarithmic function to convert the data into a Gaussian normal distribution that naturally amplifies price extremes and turning points:
fisherTransform = 0.5 * math.log((1 + value1) / (1 - value1))
smoothedFisher = ta.ema(fisherTransform, fisherSmoothing)
The smoothed Fisher signal is then integrated with an exponential moving average to create a hybrid trend line that balances statistical precision with price-following behavior:
baseTrend = ta.ema(close, basePeriod)
fisherAdjustment = smoothedFisher * fisherSensitivity * close
fisherTrend = baseTrend + fisherAdjustment
To filter out false signals and adapt to market conditions, the system calculates dynamic threshold bands using volatility measurements:
dynamicRange = ta.atr(volatilityPeriod)
threshold = dynamicRange * volatilityMultiplier
upperThreshold = fisherTrend + threshold
lowerThreshold = fisherTrend - threshold
When price momentum pushes through these thresholds, the trend line locks onto the new level and maintains direction until the opposite threshold is breached:
if upperThreshold < trendLine
trendLine := upperThreshold
if lowerThreshold > trendLine
trendLine := lowerThreshold
🟢 Signal Interpretation
Bullish Candles (Green): indicate normalized price distribution favoring bulls with sustained buying momentum = Long/Buy opportunities
Bearish Candles (Red): indicate normalized price distribution favoring bears with sustained selling pressure = Short/Sell opportunities
Upper Band Zone: Area above middle level indicating statistically elevated trend strength with potential overbought conditions approaching mean reversion zones
Lower Band Zone: Area below middle level indicating statistically depressed trend strength with potential oversold conditions approaching mean reversion zones
Built-in Alert System: Automated notifications trigger when bullish or bearish states change, allowing you to act on significant developments without constantly monitoring the charts
Candle Coloring: Optional feature applies trend colors to price bars for visual consistency and clarity
Configuration Presets: Three parameter sets available - Default (balanced settings), Scalping (faster response with higher sensitivity), and Swing Trading (slower response with enhanced smoothing)
Color Customization: Four color schemes including Classic, Aqua, Cosmic, and Custom options for personalized chart aesthetics

VWAP / ORB / VP & POCThis is an all-in-one technical analysis tool designed to give you a comprehensive view of the market on a single chart. It combines three powerful indicators—VWAP, Opening Range, and Volume Profile—to help you identify key price levels, understand intraday trends, and spot areas of high liquidity.
What It Does
The indicator plots three distinct components on your chart:
Volume-Weighted Average Price (VWAP): A benchmark that shows the average price a security has traded at throughout the day, based on both price and volume. It's often used by institutional traders to gauge whether they are getting a good price. The script also plots standard deviation or percentage-based bands around the VWAP line, which can act as dynamic support and resistance.
Opening Range Breakout (ORB): A tool that highlights the high and low of the initial trading period of a session (e.g., the first 15 minutes). The script draws lines for the opening price, range high, and range low for the rest of the session. It also colors the chart with zones to visually separate price action above, below, and within this critical opening range.
Volume Profile (VP): A powerful study that shows trading activity over a set number of bars at specific price levels. Unlike traditional volume that is plotted over time, this is plotted on the price axis. It helps you instantly see where the most and least trading has occurred, identifying significant levels like the Point of Control (POC)—the single price with the most volume—and the Value Area (VA), where the majority of trading took place.
How to Use It for Trading
The real strength of this indicator comes from finding confluence, where two or more of its components signal the same key level.
Identifying Support & Resistance: The POC, VWAP bands, Opening Range high/low, and session open price are all powerful levels to watch. When price approaches one of these levels, you can anticipate a potential reaction (a bounce or a breakout).
Gauging Intraday Trend: A simple rule of thumb is to consider the intraday trend bullish when the price is trading above the VWAP and bearish when it is trading below the VWAP.
Finding High-Value Zones: The Volume Profile’s Value Area (VA) shows you where the market has accepted a price. Trading within the VA is considered "fair value," while prices outside of it are "unfair." Reversals often happen when the price tries to re-enter the Value Area from the outside.
Settings:
Here’s a breakdown of all the settings you can change to customize the indicator to your liking.
Volume Profile Settings:
Number of Bars: How many of the most recent bars to use for the calculation. A higher number gives a broader profile.
Row Size: The number of price levels (rows) in the profile. Higher numbers give a more detailed, granular view.
Value Area Volume %: The percentage of total volume to include in the Value Area (standard is 70%).
Horizontal Offset: Moves the Volume Profile further to the right to avoid overlapping with recent price action.
Colors & Styles: Customize the colors for the POC line, Value Area, and the up/down volume bars.
VWAP Settings:
Anchor Period: Resets the VWAP calculation at the start of a new Session, Week, Month, Year, etc. You can even anchor it to corporate events like Earnings or Splits.
Source: The price source used in the calculation (default is hlc3, the average of the high, low, and close).
Bands Calculation Mode:
Standard Deviation: The bands are based on statistical volatility.
Percentage: The bands are a fixed percentage away from the VWAP line.
Bands Multiplier: Sets the distance of the bands from the VWAP. You can enable and configure up to three sets of bands.
ORB Settings (Opening Range)
Opening Range Timeframe: The duration of the opening range (e.g., 15 for 15 minutes, 60 for the first hour).
Market Session & Time Zone: Crucial for ensuring the range is calculated at the correct time for the asset you're trading.
Line & Zone Styles: Full customization for the colors, thickness, and style (Solid, Dashed, Dotted) of the High, Low, and Opening Price lines, as well as the background colors for the zones above, below, and within the range.

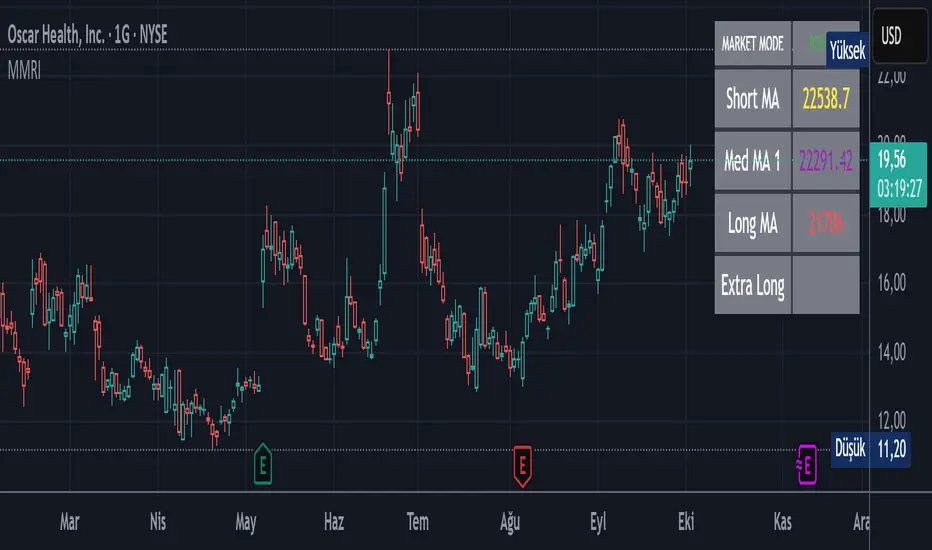
Market Mode Risk IndicatorMarket Mode Risk Indicator v1.1
This custom indicator helps traders gauge market risk sentiment by monitoring Exponential Moving Average (EMA) or Simple Moving Average (SMA) crossovers on key indices like BIST 100 (for Turkish markets), NASDAQ Composite (tech-focused US), or Dow Jones Industrial Average (industrial US). It dynamically categorizes the market into three actionable modes based on the index's position relative to layered MAs, providing a quick visual snapshot without cluttering your chart.
Risk Modes Explained:
RISK OFF (Red): Index closes below the Long MA (default 50 periods) – signals bearish caution; time to tighten stops or reduce exposure.
RISK TEST (Orange): Index above Medium MA1 (21 periods) and Extra Long MA (55 periods), but below Short MA (10 periods) and above Long MA – a transitional "test" phase; watch for confirmation before entering.
RISK ON (Green): Index above all MAs (Short, Medium, Long, Extra Long) – bullish green light; favorable for longs or momentum plays.
How It Works:
The core logic uses boolean checks on the index's close price against user-defined MA lengths. For example:
It pulls live data from your selected index via request.security.
Computes MAs with ternary operators for EMA (ta.ema) or SMA (ta.sma) based on your choice.
Mode detection relies on AND/OR conditions (e.g., aboveShort and aboveMed1 and aboveLong and aboveExtraLong for RISK ON) to filter noise and focus on meaningful shifts.
No lookahead bias – all calculations are historical and real-time compatible. Defaults (10/21/50/55) are inspired by common Fibonacci-inspired periods for balanced sensitivity.
Alerts fire only on mode transitions (e.g., from RISK OFF to ON) to prevent spam, using alertcondition with dynamic messages including price and ticker.
Customization Options:
Index & MA Settings: Switch EMA/SMA; tweak lengths (min 1 period) for your timeframe (e.g., shorter for intraday).
Display: Position the table (top/bottom, left/right); toggle MA values on/off.
Looks: Background/border/text colors, transparency (0-100%) for theme matching.
Built in Pine Script v5 for efficiency – lightweight, no repaints.
Usage Tips:
Add to any stock chart (e.g., GARAN for BIST analysis).
Select your index in settings; refresh chart if switching MA type.
Use on daily/4H timeframes for swing trading; alerts via email/SMS for hands-free monitoring.
Pro Tip: Combine with volume or RSI for confirmation – RISK ON + rising volume = stronger buy signal.
EMA CloudThe EMA Crossover Cloud is a clean and intuitive indicator that combines two Exponential Moving Averages (EMA) into a visual cloud.
Key features:
Cloud visualization: The space between EMA A and EMA B is shaded, making the current trend direction easier to identify.
Crossover signals: A clear LONG signal is plotted when EMA A crosses above EMA B, and a SHORT signal when EMA A crosses below EMA B.
Bar coloring: Candles are automatically colored according to the trend (uptrend, downtrend, or neutral).
Customizable colors: Cloud, signals, and bars can all be customized to match your chart style.
Alerts ready: Built-in alerts for EMA crossovers (LONG/SHORT).
Status label: A compact label shows the current cloud trend state in real time.
This indicator is ideal for traders who prefer simple and reliable crossover signals combined with a clear trend visualization. It works on any timeframe or asset.

8 SMA Bands (Points)The "8 SMA Bands (Points)" indicator creates a set of eight Simple Moving Average (SMA) bands with adjustable offsets, overlaid on a price chart.
Here’s a breakdown:
Purpose: It tracks price trends using multiple SMAs of varying lengths (default 25, 50, 100, 200, 400, 800, 1600 periods) and adds upper and lower bands around each SMA based on point offsets, helping identify potential support, resistance, and trend strength.
Key Components:
SMAs: Eight SMAs are calculated using closing prices with lengths ranging from 25 to 1600 periods. Each SMA is plotted with a distinct color and line thickness (e.g., MA 1 is blue, MA 8 is white with thicker lines).
Bands: For each SMA, upper and lower bands are created by adding or subtracting a point-based offset (suggestions are to use default Murray Math based numbers e.g., 0.305176 for MA 1, 39.062528 for MA 8) multiplied by a global multiplier (default 1.0). These offsets define the band width and are customizable.
Customization: Users can adjust SMA lengths, offset points, colors, and the global multiplier via input settings grouped by each MA.
Visuals: SMAs are plotted as solid lines with increasing thickness for longer periods (e.g., MA 6–8 use thicker lines or circles).
Bands are plotted as semi-transparent lines matching the SMA color, with longer-term bands (MA 6–7) using a different style for emphasis.
Usage: The indicator helps traders visualize trend direction (upward if price is above most SMAs, downward if below) and potential reversal zones where price interacts with band boundaries.
The flattening or crossing of bands can signal momentum shifts. The coming together of multiple envelope tops/bottoms can signal reversal zones of various degrees based on how many envelopes come together. More envelopes converging mean a more significant top or bottom.
This indicator is particularly useful for identifying multi-timeframe trends and volatility zones on assets like Gold Futures, with flexibility to fine-tune based on market conditions.

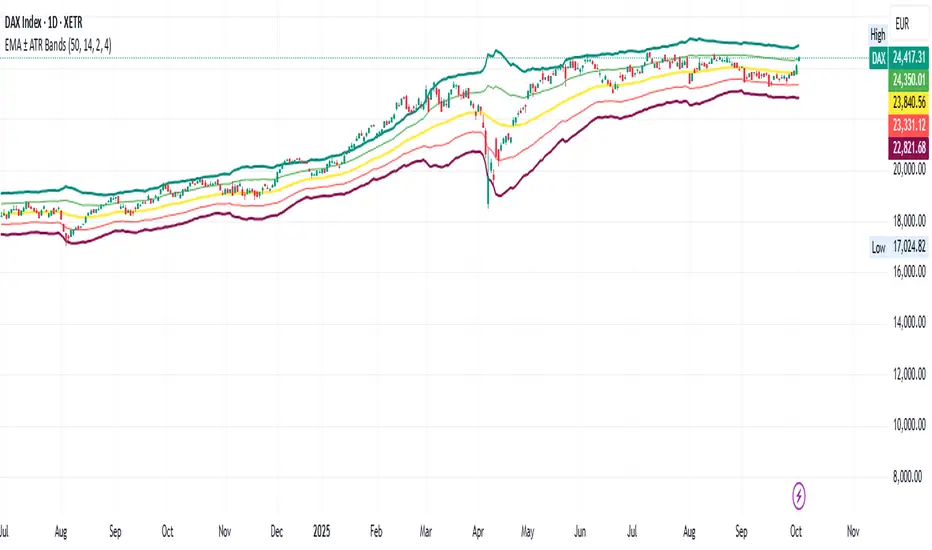
EMA ± ATR BandsPlot the bands from EMA as potential points where may want to enter/exit on principle that price returns to mean over time.
This script was created using Chat GPT.
Atlantean Sideways / Range Regime DetectorPurpose
When using trend based indicators, you can skip the false signals when there is a sideways action, protecting you from the false signals.
Flags likely sideways/range phases using three checks:
Weak trend (ADX from DMI)
Price compression (Bollinger Band Width, normalized)
Low volatility (NATR = ATR/Price%)
Logic
isSideways = (ADX < adxThresh) AND (bbNorm < 0.25) AND (NATR < natrMax)
When true: bars + background turn teal and a provisional Range High/Low (rolling rangeWin) is drawn.
Key Inputs
DMI: diLen(22)
Optimized for 15 mins Bitcoin, could change it to 14 for more general approach
ADX: adxSmooth(14), adxThresh(18)
Volatility: lenATR(14), natrMax(1.8)
Visuals: rangeWin(20), bar/range toggles
Quick Tuning
More signals: raise adxThresh to 20–25, raise natrMax to 2.5–4.0, increase BB cutoff by editing bbNorm < 0.25 --> 0.35–0.50.
Smoother range lines: increase rangeWin to 30–40.
Use Cases
Mean reversion inside teal ranges.
Breakout prep when price closes outside the drawn range after teal ends. Could be used as a signal although not suggested.
Filter trend systems: skip trades when sidewaysCond is true. This is the main purpose, for it to be combined with trend based indicators, like Supertrend.
Alert
“Sideways Detected” triggers when isSideways is true.
Script could be expanded upon your requests.

Open Range Breakout (ORB) with Alerts and LabelsThis is a classic 5min ORB indicator that highlights the orb range for your chosen session. This makes it easy to reference the range later in the trading day. In addition to the original orb signals for both buy and sell you can play off that zone for powerful entries later in the session. The signals give TP1 1:1 TP2 2:1
Options
You can set the name of the session
The color of the range.
The buffer for the SL
How many entries for the orb
EQ + Bandas Pro 📊 EQ + Bands Pro is an advanced indicator built on OHLC analysis. It calculates a synthetic equilibrium price and plots dynamic, robust bands that adapt to volatility while filtering outliers. The tool highlights zones of overvaluation and undervaluation, helping traders identify key imbalances, potential reversals, and trend confirmations.

Harry Dunn Volatility BandsEnter strike price and 2 percentage numbers to automatically calculate and draw volatility bands on chart.

ATR Volatility and Trend AnalysisATR Volatility and Trend Analysis
Unlock the power of the Average True Range (ATR) with the ATR Volatility and Trend Analysis indicator. This comprehensive tool is designed to provide traders with a multi-faceted view of market dynamics, combining volatility analysis, dynamic support and resistance levels, and trend detection into a single, easy-to-use indicator.
How It Works
The ATR Volatility and Trend Analysis indicator is built upon the core concept of the ATR, a classic measure of market volatility. It expands on this by providing several key features:
Dynamic ATR Bands: The indicator plots three sets of upper and lower bands around the price. These bands are calculated by multiplying the current ATR value by user-defined multipliers. They act as dynamic support and resistance levels, widening during volatile periods and contracting during calm markets.
Volatility Breakout Signals: Identify potential breakouts with precision. The indicator generates a signal when the current ATR value surges above its own moving average by a specified threshold, indicating a significant increase in volatility that could lead to a strong price move.
Trend Detection: The indicator determines the market trend by analyzing both price action and ATR behavior. A bullish trend is signaled when the price is above its moving average and volatility is increasing. Conversely, a bearish trend is signaled when the price is below its moving average and volatility is increasing.
How to Use the ATR Multi-Band Indicator
Identify Support and Resistance: Use the ATR bands as key levels. Price approaching the outer bands may indicate overbought or oversold conditions, while a break of the bands can signal a strong continuation.
Confirm Breakouts: Look for a volatility breakout signal to confirm the strength behind a price move. A breakout from a consolidation range accompanied by a volatility signal is a strong indicator of a new trend.
Trade with the Trend: Use the background coloring and trend signals to align your trades with the dominant market direction. Enter long positions during confirmed bullish trends and short positions during bearish trends.
Set Up Alerts: The indicator includes alerts for band crosses, trend changes, and volatility breakouts, ensuring you never miss a potential trading opportunity.
What makes it different?
While many indicators use ATR, the ATR Volatility and Trend Analysis tool is unique in its integration of multiple ATR-based concepts into a single, cohesive system. It doesn't just show volatility; it interprets it in the context of price action to deliver actionable trend and breakout signals, making it a complete solution for ATR-based analysis.
Disclaimer
This indicator is designed as a technical analysis tool and should be used in conjunction with other forms of analysis and proper risk management.
Past performance does not guarantee future results, and traders should thoroughly test any strategy before implementing it with real capital.

Regression Channel (ShareScope-style, parallel)What it does
Replicates ShareScope’s Trend of displayed data look: a single straight linear-regression line (dashed) across a chosen window with parallel, constant-width bands above and below, plus optional shading.
Use it to see the overall trend gradient for a period and a statistically sized channel based on the fit’s residual error.
How it works (math, short)
Computes an OLS regression once over the analysis window.
Residual standard error s is derived from SSE and degrees of freedom (n−2).
Band half-width is constant across the window:
Mean CI (narrower): half = z * s / √n
Prediction (wider): half = z * s * √(1 + 1/n)
Three straight, parallel lines are drawn from the regression endpoints; midline is dashed.
This is intentionally not a tapered CI (which widens at the ends). It matches the visual behaviour of ShareScope’s shaded trend line channel.
Inputs
Source – Price series (Close, High, Low, HL2, etc.).
Use last N bars / N (bars) – Rolling window length.
From / To (date mode) – Alternative fixed date window.
Confidence (%) – 90 / 95 / 99 / Custom (uses z≈t).
Custom Z (t) – Override the quantile if desired.
Prediction bands – Use wider prediction envelope instead of mean CI.
Shade region + colors / opacity / line width.
Usage
To mimic ShareScope exactly, pick the same date span (use date mode) and set Confidence 99%.
Choose Prediction OFF for a tighter “confidence” look; ON for a wider, more permissive channel.
If ShareScope used High as source, set Source = High here as well.
Notes & limitations
TradingView does not expose the visible viewport to Pine. The script cannot auto-read “displayed data.” Use last N bars or date range.
Bands are parallel by design. Prices may close outside; the channel does not bend.
Window capped at 5,000 bars for performance. No alerts are emitted.
Differences vs TV’s native tools
Linear Regression (drawing) – manual object; no statistical sizing or shading.
Linear Regression Channel (indicator) – uses price standard deviations around the regression; width is a user stdev multiple.
This script – uses residual error of the OLS fit and a z/t quantile to size a statistically meaningful parallel channel.
Changelog
r3.1 – Guard fix (no return at top level), minor refactor, stable line updates.
r3 – Switched to single-fit OLS with parallel constant-width bands (ShareScope look).
(Earlier experimental builds r1–r2.2 implemented rolling/tapered CI; superseded.)
Disclaimer: Educational use only. Not investment advice.

Dynamic Volume Trace Profile [ChartPrime]⯁ OVERVIEW
Dynamic Volume Trace Profile is a reimagined take on volume profile analysis. Instead of plotting a static horizontal histogram on the side of your chart, this indicator projects dynamic volume trace lines directly onto the price action. Each bin is color-graded according to its relative strength, creating a living “volume skeleton” of the market. The orange trace highlights the current Point of Control (POC)—the price level with maximum historical traded volume within the lookback window. On the right side, the tool builds a mini profile, showing absolute volume per bin alongside its percentage share, where the POC always represents 100% strength .
⯁ KEY FEATURES
Dynamic On-Chart Bins:
The range between highest high and lowest low is split into 25 bins. Each bin is drawn as a horizontal trace line across the lookback chart period.
Gradient Color Encoding:
Trace lines fade from transparent to teal depending on relative volume size. The more intense the teal, the stronger the historical traded activity at that level.
Automatic POC Highlight:
The bin with the highest aggregated volume is flagged with an orange line . This POC adapts bar-by-bar as volume distribution shifts.
Right-Side Volume Profile:
At the chart’s right edge, the script prints a box-style profile. Each bin shows:
• Total volume (absolute units).
• Percentage of max volume, in parentheses (POC bin = 100%).
This gives both raw and normalized context at a glance.
Adjustable Lookback Window:
The lookback defines how many bars feed the profile. Increase for stable HTF zones or decrease for responsive intraday distributions.
POC Toggle & Styling:
Optionally toggle POC highlighting on/off, adjust colors, and set line thickness for better integration with your chart theme.
⯁ HOW IT WORKS (UNDER THE HOOD)
Step Sizing:
over last 100 bars is divided by to calculate bin height.
Volume Aggregation:
For each bar in the , the script checks which bin the close falls into, then adds that bar’s volume to the bin’s counter.
Gradient Mapping:
Bin volume is normalized against the max volume across all bins. That value is mapped onto a gradient from transparent → teal.
POC Logic:
The bin with highest volume is colored orange both on the dynamic trace and in the right-side profile.
Right-Hand Profile:
Boxes are drawn for each bin proportional to volume / maxVolume × 50 units, with text labels showing both absolute volume and normalized %.
⯁ USAGE
Use the orange trace as the dominant “magnet” level—price often gravitates to the POC.
Watch for clusters of strong teal traces as areas of high acceptance; thin or faint zones mark low-liquidity gaps prone to fast moves.
On intraday charts, tighten lookback to reveal session-based distributions . For swing or position trading, expand lookback to surface more durable volume shelves.
Compare the right-side profile % to judge how “top-heavy” or “bottom-heavy” the current distribution is.
Use bright, intense color traces as context for confluence with structure, OBs, or liquidity hunts.
⯁ CONCLUSION
Dynamic Volume Trace Profile takes the traditional volume profile and fuses it into the body of price itself. Instead of a fixed sidebar, you see gradient traces layered directly on the chart, giving real-time context of where volume concentrated and where price may be drawn. With built-in POC highlighting, normalized % readouts, and an adaptive right-side profile, it offers both precision levels and market structure awareness in a cleaner, more intuitive form.

Pivot Trend Flow [BigBeluga]🔵 OVERVIEW
Pivot Trend Flow turns raw swing points into a clean, adaptive trend band. It averages recent pivot highs and lows to form two dynamic reference levels; when price crosses above the averaged highs, trend flips bullish and a green band is drawn; when it crosses below the averaged lows, trend flips bearish and a red band is drawn. During an uptrend the script highlights breakouts of previous pivot highs with ▲ labels, and during a downtrend it flags breakdowns of previous pivot lows with ▼ labels—making structure shifts and continuation signals obvious.
🔵 CONCEPTS
Pivot-Based Averages : Recent pivot highs/lows are collected and averaged to create smoothed upper/lower reference levels.
if not na(ph)
phArray.push(ph)
if not na(pl)
plArray.push(pl)
if phArray.size() > avgWindow
upper := phArray.avg()
phArray.shift()
if plArray.size() > avgWindow
lower := plArray.avg()
plArray.shift()
Trend State via Crosses : Close above the averaged-highs ⇒ bullish trend; close below the averaged-lows ⇒ bearish trend.
Trend Band : A colored band (green/red) is plotted and optionally filled to visualize the active regime around price.
Structure Triggers :
In bull mode the tool watches for prior pivot-high breakouts (▲).
In bear mode it watches for prior pivot-low breakdowns (▼).
🔵 FEATURES
Adaptive Trend Detection from averaged pivot highs/lows.
Clear Visuals : Green band in uptrends, red band in downtrends; optional fill for quick read.
Breakout/Breakdown Labels :
▲ marks breaks of previous pivot highs in uptrends
▼ marks breaks of previous pivot lows in downtrends
Minimal Clutter : Uses compact lines and labels that extend only on confirmation.
Customizable Colors & Fill for trend states and band styling.
🔵 HOW TO USE
Pivot Length : Sets how swing points are detected. Smaller = more reactive; larger = smoother.
Avg Window (pivots) : How many recent pivot highs/lows are averaged. Increase to stabilize the band; decrease for agility.
Read the Band :
Green band active ⇒ prioritize longs, pullback buys toward the band.
Red band active ⇒ prioritize shorts, pullback sells toward the band.
Trade the Triggers :
In bull mode, ▲ on a prior pivot-high break can confirm continuation.
In bear mode, ▼ on a prior pivot-low break can confirm continuation.
Combine with Context : Use HTF trend, S/R, or volume for confluence and to filter signals.
Fill Color Toggle : Enable/disable band fill to match your chart style.
🔵 CONCLUSION
Pivot Trend Flow converts swing structure into an actionable, low-lag trend framework. By blending averaged pivots with clean breakout/breakdown labels, it clarifies trend direction, timing, and continuation spots—ideal as a core bias tool or a confirmation layer in any trading system.

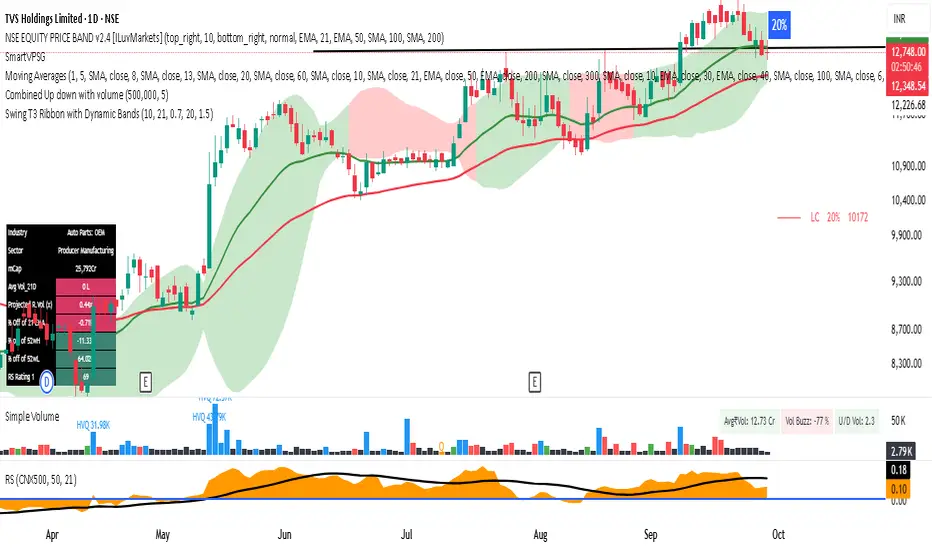
Swing T3 Ribbon with Dynamic Bandswing T3 Ribbon with Dynamic Bands
This indicator combines T3 moving averages with a dynamic Bollinger-style ribbon to highlight early trend changes and volatility-driven price moves.
Key Features:
T3 Ribbon: Fast T3 vs. Slow T3 shows trend direction; ribbon color is green for bullish, red for bearish.
Dynamic Bands: Bands fluctuate with recent price volatility, similar to Bollinger Bands, providing a visual guide for overbought/oversold areas.
Early Swing Markers:
E0 (Early Upswing): Price above top band while trend is temporarily bearish.
Ex (Early Downswing): Price below bottom band while trend is temporarily bullish.
Alerts:
Early upswing (E0)
Early downswing (Ex)
Price crossing the bottom (red) band from below.
Purpose:
Helps traders detect early trend reversals or price breakouts in the context of volatility.
Dynamic bands adapt to changing market conditions, giving a more responsive signal than fixed-width ribbons.
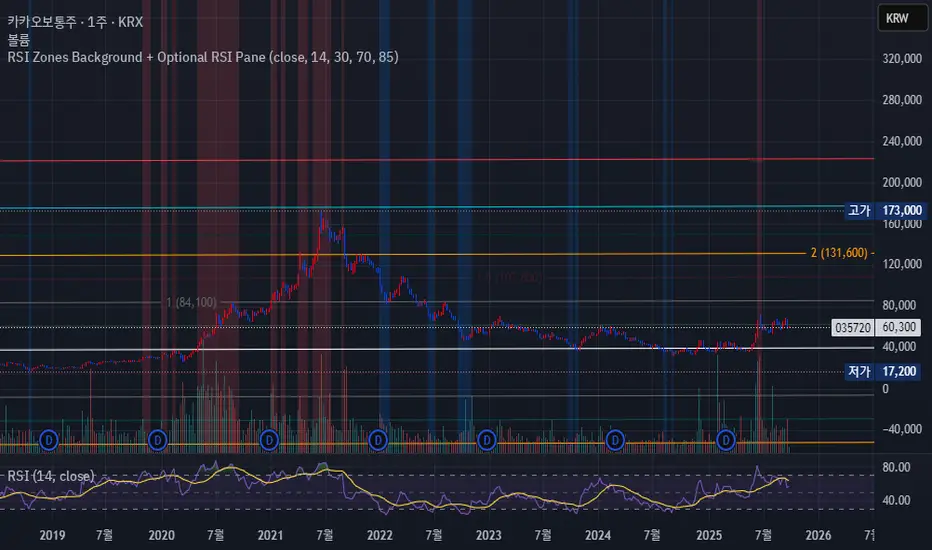
RSI Zones Background + Optional RSI PaneOverview
This Pine Script indicator does two things at once:
Colors the background of the main price chart whenever the RSI value is below a lower threshold (default 30) or above an upper threshold (default 70). This highlights oversold and overbought zones directly on the price chart itself.
Optionally displays a separate RSI panel with the RSI line and shaded region between the two threshold levels for reference.
The indicator is fully customizable through the settings panel—color choices, transparency, and whether to show the separate RSI pane can all be adjusted.
Key Parts of the Code
1. Inputs
src: The source price series for RSI calculation.
len: RSI lookback length (default 14).
lowerThr and upperThr: The lower and upper thresholds (defaults: 30 and 70).
lowColor and highColor: Colors for the background when RSI is below or above the thresholds.
bgTrans: Transparency level for the background shading.
showRSI: Boolean to toggle the optional RSI pane on or off.
2. RSI Calculation
rsi = ta.rsi(src, len)
This computes the RSI from the chosen price source.
3. Background Coloring on the Price Chart
bgCol = rsi <= lowerThr ? color.new(lowColor,bgTrans) :
rsi >= upperThr ? color.new(highColor,bgTrans) :
na
bgcolor(bgCol)
If RSI ≤ lower threshold: background turns lowColor (oversold zone).
If RSI ≥ upper threshold: background turns highColor (overbought zone).
Otherwise, no background color.
4. Optional RSI Pane
plot(showRSI ? rsi : na, display=display.pane)
Plots the RSI line in a separate pane when showRSI is true; otherwise hides it.
5. Horizontal Lines for Thresholds
hLower = hline(lowerThr, ...)
hUpper = hline(upperThr, ...)
Two horizontal lines at the lower and upper thresholds.
Because hline() can’t be wrapped inside if blocks, the script always creates them but makes them transparent (using na color) when the pane is hidden.
6. Filling Between Threshold Lines
fill(hLower, hUpper, color=showRSI ? color.new(color.gray,95) : na)
When the RSI pane is visible, the area between the two threshold lines is shaded in gray to create a “mid-zone” effect. This fill also switches off (becomes na) if the pane is hidden.
7. Alerts
The script also includes two alert conditions:
When RSI crosses below the lower threshold.
When RSI crosses above the upper threshold.
How It Works in Practice
On the price chart, you’ll see the background turn blue (or your chosen color) when RSI is ≤30, and red when RSI is ≥70.
If you enable “Show RSI” in the settings, a separate RSI pane will appear below the price chart, plotting the RSI line with two threshold lines and a shaded region in between.
You can fully adjust transparency and colors to suit your chart style.
Benefits
Quickly visualize overbought and oversold conditions without opening a separate RSI window.
Optional RSI pane provides context when needed.
Customizable colors and transparency make it easy to integrate with any chart theme.
Alerts give you automatic notifications when RSI crosses key levels.
------------------------------------------------------------------------------------------------------------------
개요
이 지표는 두 가지 기능을 동시에 수행합니다.
가격 차트 뒤 배경에 색상 표시
RSI 값이 설정한 하단 임계값(기본 30) 이하이거나 상단 임계값(기본 70) 이상일 때, 가격 차트 뒤쪽에 과매도·과매수 구간을 색으로 표시해줍니다.
선택적으로 RSI 보조창 표시
옵션을 켜면 별도의 RSI 패널이 나타나서 RSI 라인과 두 임계값(30, 70)을 연결한 구간을 음영 처리하여 보여줍니다.
설정 창에서 색상·투명도·보조창 표시 여부를 전부 조정할 수 있습니다.
코드 핵심 설명
1. 입력값
src: RSI 계산에 사용할 가격 소스(기본 종가).
len: RSI 기간(기본 14).
lowerThr / upperThr: RSI 하단·상단 임계값(기본 30, 70).
lowColor / highColor: RSI가 각각 하단 이하·상단 이상일 때 배경 색상.
bgTrans: 배경 투명도(0=불투명, 100=투명).
showRSI: RSI 보조창을 켜고 끌 수 있는 스위치.
2. RSI 계산
rsi = ta.rsi(src, len)
지정한 가격 소스를 기반으로 RSI를 계산합니다.
3. 가격 차트 배경 색칠
bgCol = rsi <= lowerThr ? color.new(lowColor,bgTrans) :
rsi >= upperThr ? color.new(highColor,bgTrans) :
na
bgcolor(bgCol)
RSI ≤ 하단 임계값 → lowColor(과매도 색)
RSI ≥ 상단 임계값 → highColor(과매수 색)
나머지 구간은 색상 없음.
4. 선택적 RSI 보조창
plot(showRSI ? rsi : na, display=display.pane)
showRSI가 켜져 있으면 RSI 라인을 보조창에 표시하고, 꺼져 있으면 숨깁니다.
5. 임계값 가로선
hLower = hline(lowerThr, ...)
hUpper = hline(upperThr, ...)
하단·상단 임계값을 가로선으로 표시합니다.
hline은 if 블록 안에서 쓸 수 없기 때문에 항상 그려지지만, 보조창이 꺼지면 색을 na로 처리해 안 보이게 합니다.
6. 임계값 사이 영역 음영 처리
fill(hLower, hUpper, color=showRSI ? color.new(color.gray,95) : na)
보조창이 켜져 있을 때만 두 가로선 사이를 회색으로 채워 “중립 구간”을 강조합니다.
7. 알림 조건
RSI가 하단 임계값을 아래로 돌파할 때 알림.
RSI가 상단 임계값을 위로 돌파할 때 알림.
실제 작동 모습
가격 차트 뒤쪽에 RSI ≤30이면 파란색, RSI ≥70이면 빨간색 배경이 나타납니다(색상은 설정에서 변경 가능).
RSI 보조창을 켜면, RSI 라인과 임계값 가로선, 그리고 그 사이 음영 영역이 함께 나타납니다.
투명도를 높이거나 낮추어 강조 정도를 조절할 수 있습니다.
장점
별도의 RSI창을 열지 않고도 가격 차트 배경만으로 과매수·과매도 상태를 직관적으로 확인 가능.
필요하면 보조창으로 RSI를 직접 확인하면서 임계값 가이드와 음영 영역을 함께 볼 수 있음.
색상·투명도를 자유롭게 조절할 수 있어 차트 스타일에 맞게 커스터마이징 가능.
RSI가 임계값을 돌파할 때 자동 알림을 받을 수 있음.
Opening Candle Zone with ATR Bands by nkChartsThis indicator highlights the opening range of each trading session and projects dynamic ATR-based zones around it.
Key Features
Plots high and low levels of the opening candle for each new daily session.
Extends these levels across the session, providing clear intraday support and resistance zones.
Adds ATR-based offset bands above and below the opening range for volatility-adjusted levels.
Customizable colors, ATR length, and multiplier for flexible use across markets and timeframes.
Adjustable session history limit to control how many past levels remain on the chart.
How to Use:
The opening range high/low often acts as strong intraday support or resistance.
The ATR bands give an adaptive volatility buffer, useful for breakout or mean-reversion strategies.
Works on any market with clear session opens.
This tool is designed for traders who want to combine session-based price action with volatility insights, helping identify potential breakouts, reversals, or consolidation areas throughout the day.
⚠️ Disclaimer: This indicator is for educational purposes only. It does not provide financial advice or guarantee profits. Always perform your own analysis before making trading decisions.
