Daily Midnight Marker (NYC)Daily Midnight Marker (NYC) automatically plots a vertical light-gray line on your chart at midnight New York time (00:00) to visually mark the start of each trading day.
A small label is displayed at the bottom of the line that reads “Day Start”, helping traders quickly identify daily session boundaries.
This indicator is especially useful for:
Futures or forex traders referencing New York session time
Intraday analysts who want to distinguish daily ranges
Backtesting or reviewing overnight/pre-market activity
Features:
Plots at 00:00 NYC time daily
Light gray, clean design to avoid clutter
Optional label under each day start
Bands and Channels

6 AM Marker6 AM Marker – Daily Premarket Reference Line
This indicator automatically plots a vertical dotted line at 6:00 AM (local chart time) on every trading day.
It’s designed for traders who track premarket activity and want a clear visual reference of when the early market hours begin.
Features:
Marks 6:00 AM on all trading days automatically
Works on any timeframe
Adjustable timezone (e.g., America/New_York, America/Los_Angeles)
Clean, minimal visual style — perfect for day traders using NQ, ES, or other futures
This simple visual tool helps identify premarket ranges, overnight sessions, and morning setups with precision.

Level LinesThis indicator displays levels in close proximity to the current price, enabling users to identify psychological levels on charts that serve as support/resistance zones or key reference points for price action.
In the settings, you can customize the number of lines shown above and below the current price, along with the interval size for rendering them.
As the price moves higher or lower, the lines dynamically adjust to reflect the most relevant levels.
In settings you can fully customize the style of lines (color, width, style) with separate settings available for lines above & below the current price.

LogReg Channel-Trend – Nadaraya (Kernels + CF/ABModification of BigBeluga script named "LogReg Channel- Trend"

Fibonacci Trend - MODIFIED with AlertsATR filter added
Allerts on every level
Standard ATR is 150, but it is changeable

Trend & Strength Detector TSDTrend Strength Detector (TSD)
*Objective Trend Quality Measurement for Educational Market Analysis*
Note: This mathematical framework is a proprietary quantitative model developed by Ario Pinelab, inspired by classical EMA, ADX, RSI and MACD principles, yet not documented in any public technical or academic publication.
## 🎯 Purpose & Design Philosophy
The ** Trend Strength Detector- TSD ** is an educational research tool that provides **quantitative measurement of trend quality** through two independent scoring systems (0-100 scale). It answers the analytical question: *"How strong and aligned is the current market trend environment?"*
This indicator is designed with a **modular, complementary approach** to work alongside various analysis methodologies, particularly pattern-based recognition systems.
## 🔗 Complementary Research Framework
### Designed to Work With Pattern Detection Systems
This indicator provides **environmental context measurement** that complements qualitative pattern recognition tools. It works particularly well alongside systems like:
- **RMBS Smart Detector - Multi-Factor Momentum System**
- Traditional chart pattern analyzers
- Any momentum-based pattern identification tools
🔍 **To find RMBS Smart Detector:**
- Search in TradingView Indicators Library: `" RMBS Smart Detector - Multi-Factor Momentum System"`
- Look for: *Multi-Factor Momentum System*
- By author: ` `
### Why This Complementary Approach?
**Trend Quality Measurement** (TSD - this tool) provides:
- ✅ Structural trend alignment (0-100 score)
- ✅ Momentum intensity levels (0-100 score)
- ✅ Environment classification (Strong/Moderate/Weak)
- 📌 **Answers:** *"HOW STRONG is the underlying trend environment?"*
### Educational Research Value
When used together in a research context, these tools enable systematic study of questions like:
- How do reversal patterns behave when Strength Score is above 70 vs below 30?
- Do continuation patterns in weakening environments (declining scores) show different characteristics?
- What is the correlation between high Alignment Scores and pattern "success rates"?
- Can environment classification help identify genuine trend initiation vs false starts?
⚠️ **Important Note:** Both tools are **independent and work standalone**. TSD provides value whether used alone or with other analysis methods. The relationship with RMBS (or any pattern tool) is **complementary for research purposes**, not dependent.
---
###Mathematical Foundation
##TSA Formula: scoring method developed by Ario
-Trend Model (0 – 100)
TAS = EMA Alignment (0–40) + Price Position (0–30) + Trend Consistency (0–30)
EMA Alignment checks EMA_fast vs EMA_slow vs EMA_trend structure.
Price Position evaluates if Close is above/below all EMAs.
Consistency = 3 × max(bullish,bearish bars within 10 candles).
-Strength Model (0 – 100)
Strength = ADX (0–50) + EMA Slope (0–25) + RSI (0–15) + MACD (0–10)
ADX measures trend energy; Slope shows EMA momentum %;
RSI assesses zone positioning; MACD confirms directional agreement.
Note: This formula represents a proprietary quantitative model by Ario_Pinelab, inspired by classical technical concepts but not published in any external reference.________________________________________
📊 Environment Classification
Based on Total Strength Score:
🟢 Strong Environment: Score ≥ 60
→ Well-defined momentum, clear directional bias
🟡 Moderate Environment: 40 ≤ Score < 60
→ Mixed signals, transitional conditions
🔴 Weak Environment: Score < 40
→ Ranging, choppy, low conviction movement
Color Coding:
• Green background: Strong (≥60)
• Yellow background: Moderate (40-59)
• Red background: Weak (<40)
________________________________________
📈 Visual Components
Main Chart Display
Score Labels (Top-Right Corner):
┌─────────────────────────────────┐
│ 📊 Alignment: 75 | Strength: 82 │
│ Environment: Strong 🟢 │
└─────────────────────────────────┘
Color-Coded Background:
• Environment strength visually indicated via background color
• Helps quick identification of market regime
• Customizable transparency (default: 90%)
Reference Lines:
• Dotted line at 60: Strong/Moderate threshold
• Dotted line at 40: Moderate/Weak threshold
• Mid-line at 50: Neutral reference
________________________________________
🔧 Customization Settings
Input Parameters
The best setting is the default mode.
🚫 Important Disclaimers & Limitations
What This Indicator IS:
✅ Educational measurement tool for trend quality research
✅ Quantitative assessment of current market environment
✅ Complementary analysis tool for pattern-based systems
✅ Historical data analyzer for systematic study
✅ Multi-factor scoring system based on technical calculations
What This Indicator IS NOT:
❌ NOT a trading system or signal generator
❌ NOT financial advice or trade recommendations
❌ NOT predictive of future price movements
❌ NOT a guarantee of pattern success/failure
❌ NOT a substitute for comprehensive risk management
________________________________________
Known Limitations
1. Lagging Nature:
⚠️ All components (EMA, ADX, RSI, MACD) are calculated
from historical price data
→ Scores reflect CURRENT and RECENT conditions
→ Cannot predict sudden reversals or black swan events
→ Trend measurements lag actual price turning points
2. Whipsaw Risk:
⚠️ In choppy/ranging markets, scores may fluctuate rapidly
→ Moderate zone (40-60) can see frequent transitions
→ Low timeframes more susceptible to noise
→ Consider higher timeframes for stable measurements
3. Component Conflicts:
⚠️ Individual components may disagree
→ Example: Strong ADX but weak RSI alignment
→ Scores average these conflicts (may hide nuance)
→ Check individual components for deeper insight
4. Not Predictive:
⚠️ High scores do NOT guarantee continuation
⚠️ Low scores do NOT guarantee reversal
→ Measurement ≠ Prediction
→ Use for CONTEXT, not SIGNALS
→ Combine with comprehensive analysis
________________________________________
Risk Acknowledgments
Market Risk:
• All trading involves substantial risk of loss
• Past performance (even systematic studies) does not guarantee future results
• No indicator, system, or methodology can eliminate market risk
Measurement Limitations:
• Scores are mathematical calculations, not market predictions
• Environmental classification is descriptive, not prescriptive
• Strong measurements can deteriorate rapidly without warning
Educational Purpose:
• This tool is designed for LEARNING about market structure
• Not designed, tested, or validated as a standalone trading system
• Any trading decisions are user’s sole responsibility
No Warranty:
• Indicator provided “as-is” for educational purposes
• No guarantee of accuracy, reliability, or profitability
• Users must verify calculations and apply critical thinking
Open Source
Full Pine Script code available for educational study and modification. Feedback and improvement suggestions welcome.
“All logic is presented for research and educational visualization.”
---

VWAP (SIYL) Stdev Bands v2v2 indicator to allow for reversion-to-mean trading via the Stay In Your Lane approach.

Zero Lag Filter Pro MTF Editionit is a very good trading indicator it uses multi timeframe analysis to give trade signals

DEMA Flow [Alpha Extract]A sophisticated trend identification system that combines Double Exponential Moving Average methodology with advanced HL median filtering and ATR-based band detection for precise trend confirmation. Utilizing dual-layer smoothing architecture and volatility-adjusted breakout zones, this indicator delivers institutional-grade flow analysis with minimal lag while maintaining exceptional noise reduction. The system's intelligent band structure with asymmetric ATR multipliers provides clear trend state classification through price position analysis relative to dynamic threshold levels.
🔶 Advanced DEMA Calculation Engine
Implements double exponential moving average methodology using cascaded EMA calculations to significantly reduce lag compared to traditional moving averages. The system applies dual smoothing through sequential EMA processing, creating a responsive yet stable trend baseline that maintains sensitivity to genuine market structure changes while filtering short-term noise.
// Core DEMA Framework
dema(src, length) =>
EMA1 = ta.ema(src, length)
EMA2 = ta.ema(EMA1, length)
DEMA_Value = 2 * EMA1 - EMA2
DEMA_Value
// Primary Calculation
DEMA = dema(close, DEMA_Length)
2H
🔶 HL Median Filter Smoothing Architecture
Features sophisticated high-low median filtering using rolling window analysis to create ultra-smooth trend baselines with outlier resistance. The system constructs dynamic arrays of recent DEMA values, sorts them for median extraction, and handles both odd and even window lengths for optimal smoothing consistency across all market conditions.
// HL Median Filter Logic
hlMedian(src, length) =>
window = array.new_float()
for i = 0 to length - 1
array.push(window, src)
array.sort(window)
// Median Extraction
lenW = array.size(window)
median = lenW % 2 == 1 ?
array.get(window, lenW / 2) :
(array.get(window, lenW/2 - 1) + array.get(window, lenW/2)) / 2
// Smooth DEMA Calculation
Smooth_DEMA = hlMedian(DEMA_Value, HL_Filter_Length)
🔶 ATR Band Construction Framework
Implements volatility-adaptive band structure using Average True Range calculations with asymmetric multiplier configuration for optimal trend identification. The system creates upper and lower threshold bands around the smoothed DEMA baseline with configurable ATR multipliers, enabling precise trend state determination through price breakout analysis.
// ATR Band Calculation
atrBands(src, atr_length, upper_mult, lower_mult) =>
ATR = ta.atr(atr_length)
Upper_Band = src + upper_mult * ATR
Lower_Band = src - lower_mult * ATR
// Band Generation
= atrBands(Smooth_DEMA, ATR_Length, Upper_ATR_Mult, Lower_ATR_Mult)
15min
🔶 Intelligent Flow Signal Engine
Generates binary trend states through band breakout detection, transitioning to bullish flow when price exceeds upper band and bearish flow when price breaches lower band. The system maintains flow state persistence until opposing band breakout occurs, providing clear trend classification without whipsaw signals during normal volatility fluctuations.
🔶 Comprehensive Visual Architecture
Provides multi-dimensional flow visualization through color-coded DEMA line, trend-synchronized candle coloring, and bar color overlay for complete chart integration. The system uses institutional color scheme with neon green for bullish flow, neon red for bearish flow, and neutral gray for undefined states with configurable band visibility.
🔶 Asymmetric Band Configuration
Features intelligent asymmetric ATR multiplier system with default upper multiplier of 2.1 and lower multiplier of 1.5, optimizing for market dynamics where upside breakouts often require stronger momentum confirmation than downside breaks. This configuration reduces false signals while maintaining sensitivity to genuine flow changes.
🔶 Dual-Layer Smoothing Methodology
Combines DEMA's inherent lag reduction with HL median filtering to create exceptional smoothing without sacrificing responsiveness. The system first applies double exponential smoothing for initial noise reduction, then applies median filtering to eliminate outliers and create ultra-clean flow baseline suitable for high-frequency and institutional trading applications.
🔶 Alert Integration System
Features comprehensive alert framework for flow state transitions with customizable notifications for bullish and bearish flow confirmations. The system provides real-time alerts on crossover events with clear directional indicators and exchange/ticker integration for multi-symbol monitoring capabilities.
🔶 Performance Optimization Framework
Utilizes efficient array management with optimized median calculation algorithms and minimal variable overhead for smooth operation across all timeframes. The system includes intelligent bar indexing for median filter initialization and streamlined flow state tracking for consistent performance during extended analysis periods.
🔶 Why Choose DEMA Flow ?
This indicator delivers sophisticated flow identification through dual-layer smoothing architecture and volatility-adaptive band methodology. By combining DEMA's reduced-lag characteristics with HL median filtering and ATR-based breakout zones, it provides institutional-grade flow analysis with exceptional noise reduction and minimal false signals. The system's asymmetric band structure and comprehensive visual integration make it essential for traders seeking systematic trend-following approaches across cryptocurrency, forex, and equity markets with clear entry/exit signals and comprehensive alert capabilities for automated trading strategies.

Ben's BTC Macro Fair Value OscillatorBen's BTC Macro Fair Value Oscillator
Overview
The **BTC Macro Fair Value Oscillator** is a non-crypto fair value framework that uses macro asset relationships (equities, dollar, gold) to estimate Bitcoin's "macro-driven fair value" and identify mean-reversion opportunities.
"Is BTC cheap or expensive right now?" on the 4 Hour Timeframe ONLY
### Key Features
✅ **Macro-driven**: Uses QQQ, DXY, XAUUSD instead of on-chain or crypto metrics
✅ **Dynamic weighting**: Assets weighted by rolling correlation strength
✅ **Mean-reversion signals**: Identifies when BTC is cheap/expensive vs macro
✅ **Validated parameters**: Optimized through 5-year backtest (Sharpe 6.7-9.9)
✅ **Visual transparency**: Live correlation panel, fair value bands, statistics
✅ **Non-repainting**: All calculations use confirmed historical data only
### What This Indicator Does
- Builds a **synthetic macro composite** from traditional assets
- Runs a **rolling regression** to predict BTC price from macro
- Calculates **deviation z-score** (how far BTC is from macro fair value)
- Generates **entry signals** when BTC is extremely cheap vs macro (dev < -2)
- Generates **exit signals** when BTC returns to fair value (dev > 0)
### What This Indicator Is NOT
❌ Not a high-frequency trading system (sparse signals by design)
❌ Not optimized for absolute returns (optimized for Sharpe ratio)
❌ Not suitable as standalone trading system (best as overlay/confirmation)
❌ Not predictive of short-term price movements (mean-reversion timeframe: days to weeks)
---
## Core Concept
### The Premise
Bitcoin doesn't trade in a vacuum. It's influenced by:
- **Risk appetite** (equities: QQQ, SPX)
- **Dollar strength** (DXY - inverse to risk assets)
- **Safe haven flows** (Gold: XAUUSD)
When macro conditions are "good for BTC" (risk-on, weak dollar, strong equities), BTC should trade higher. When macro conditions turn against it, BTC should trade lower.
### The Innovation
Instead of looking at BTC in isolation, this indicator:
1. **Measures how strongly** BTC currently correlates with each macro asset
2. **Builds a weighted composite** of those macro returns (the "D" driver)
3. **Regresses BTC price on D** to estimate "macro fair value"
4. **Tracks the deviation** between actual price and fair value
5. **Signals mean reversion** when deviation becomes extreme
### The Edge
The validated edge comes from:
- **Extreme deviations predict future returns** (dev < -2 → +1.67% over 12 bars)
- **Monotonic relationship** (more negative dev → higher forward returns)
- **Works out-of-sample** (test Sharpe +83-87% better than training)
- **Low correlation with buy & hold** (provides diversification value)
---
## Methodology
### Step 1: Macro Composite Driver D(t)
The indicator builds a weighted composite of macro asset returns:
**Process:**
1. Calculate **log returns** for BTC and each macro reference (QQQ, DXY, XAUUSD)
2. Compute **rolling correlation** between BTC and each reference over `corrLen` bars
3. **Weight each asset** by `|correlation|` if above `minCorrAbs` threshold, else 0
4. **Sign-adjust** weights (+1 for positive corr, -1 for negative) to handle inverse relationships
5. **Z-score normalize** each reference's returns over `fvWindow`
6. **Composite D(t)** = weighted sum of sign-adjusted z-scores
**Formula:**
```
For each reference i:
corr_i = correlation(BTC_returns, ref_i_returns, corrLen)
weight_i = |corr_i| if |corr_i| >= minCorrAbs else 0
sign_i = +1 if corr_i >= 0 else -1
z_i = (ref_i_returns - mean) / std
contrib_i = sign_i * z_i * weight_i
D(t) = sum(contrib_i) / sum(weight_i)
```
**Key Insight:** D(t) represents "how good macro conditions are for BTC right now" in a normalized, correlation-weighted way.
---
### Step 2: Fair Value Regression
Uses rolling linear regression to predict BTC price from D(t):
**Model:**
```
BTC_price(t) = α + β * D(t)
```
**Calculation (Pine Script approach):**
```
corr_CD = correlation(BTC_price, D, fvWindow)
sd_price = stdev(BTC_price, fvWindow)
sd_D = stdev(D, fvWindow)
cov = corr_CD * sd_price * sd_D
var_D = variance(D, fvWindow)
β = cov / var_D
α = mean(BTC_price) - β * mean(D)
fair_value(t) = α + β * D(t)
```
**Result:** A time-varying "macro fair value" line that adapts as correlations change.
---
### Step 3: Deviation Oscillator
Measures how far BTC price has deviated from fair value:
**Calculation:**
```
residual(t) = BTC_price(t) - fair_value(t)
residual_std = stdev(residual, normWindow)
deviation(t) = residual(t) / residual_std
```
**Interpretation:**
- `dev = 0` → BTC at fair value
- `dev = -2` → BTC is 2 standard deviations **cheap** vs macro
- `dev = +2` → BTC is 2 standard deviations **rich** vs macro
---
### Step 4: Signal Generation
**Long Entry:** `dev` crosses below `-2.0` (BTC extremely cheap vs macro)
**Long Exit:** `dev` crosses above `0.0` (BTC returns to fair value)
**No shorting** in default config (risk management choice - crypto volatility)
---
## How It Works
### Visual Components
#### 1. Price Chart (Main Panel)
**Fair Value Line (Orange):**
- The estimated "macro-driven fair value" for BTC
- Calculated from rolling regression on macro composite
**Fair Value Bands:**
- **±1σ** (light): 68% confidence zone
- **±2σ** (medium): 95% confidence zone
- **±3σ** (dark, dots): 99.7% confidence zone
**Entry/Exit Markers:**
- **Green "LONG" label** below bar: Entry signal (dev < -2)
- **Red "EXIT" label** above bar: Exit signal (dev > 0)
#### 2. Deviation Oscillator (Separate Pane)
**Line plot:**
- Shows current deviation z-score
- **Green** when dev < -2 (cheap)
- **Red** when dev > +2 (rich)
- **Gray** when neutral
**Histogram:**
- Visual representation of deviation magnitude
- Green bars = negative deviation (cheap)
- Red bars = positive deviation (rich)
**Threshold lines:**
- **Green dashed at -2.0**: Entry threshold
- **Red dashed at 0.0**: Exit threshold
- **Gray solid at 0**: Fair value line
#### 3. Correlation Panel (Top-Right)
Shows live correlation and weighting for each macro asset:
| Asset | Corr | Weight |
|-------|------|--------|
| QQQ | +0.45 | 0.45 |
| DXY | -0.32 | 0.32 |
| XAUUSD | +0.15 | 0.00 |
| Avg \|Corr\| | 0.31 | 0.77 |
**Reading:**
- **Corr**: Current rolling correlation with BTC (-1 to +1)
- **Weight**: How much this asset contributes to fair value (0 = excluded)
- **Avg |Corr|**: Average correlation strength (should be > 0.2 for reliable signals)
**Colors:**
- Green/Red corr = positive/negative correlation
- White weight = asset included, Gray = excluded (below minCorrAbs)
#### 4. Statistics Label (Bottom-Right)
```
━━━ BTC Macro FV ━━━
Dev: -2.34
Price: $103,192
FV: $110,500
Status: CHEAP ⬇
β: 103.52
```
**Fields:**
- **Dev**: Current deviation z-score
- **Price**: Current BTC close price
- **FV**: Current macro fair value estimate
- **Status**: CHEAP (< -2), RICH (> +2), or FAIR
- **β**: Current regression beta (sensitivity to macro)
---
## Installation & Setup
### TradingView Setup
1. Open TradingView and navigate to any **BTC chart** (BTCUSD, BTCUSDT, etc.)
2. Open **Pine Editor** (bottom panel)
3. Click **"+ New"** → **"Blank indicator"**
4. **Delete** all default code
5. **Copy** the entire Pine Script from `GHPT_optimized.pine`
6. **Paste** into the editor
7. Click **"Save"** and name it "BTC Macro Fair Value Oscillator"
8. Click **"Add to Chart"**
### Recommended Chart Settings
**Timeframe:** 4h (validated timeframe)
**Chart Type:** Candlestick or Heikin Ashi
**Overlay:** Yes (indicator plots on price chart + separate pane)
**Alternative Timeframes:**
- Daily: Works but slower signals
- 1h-2h: May work but not validated
- < 1h: Not recommended (too noisy)
### Symbol Requirements
**Primary:** BTC/USD or BTC/USDT on any exchange
**Macro References:** Automatically fetched
- QQQ (Nasdaq 100 ETF)
- DXY (US Dollar Index)
- XAUUSD (Gold spot)
**Data Requirements:**
- At least **90 bars** of history (warmup period)
- Premium TradingView recommended for full historical data
---
## Reading the Indicator
### Identifying Signals
#### Strong Long Signal (High Conviction)
- ✅ Deviation < -2.0 (extreme undervaluation)
- ✅ Avg |Corr| > 0.3 (strong macro relationships)
- ✅ Price touching or below -2σ band
- ✅ "LONG" label appears below bar
**Interpretation:** BTC is extremely cheap relative to macro conditions. Historical data shows +1.67% average return over next 12 bars (48 hours at 4h timeframe).
#### Moderate Long Signal (Lower Conviction)
- ⚠️ Deviation between -1.5 and -2.0
- ⚠️ Avg |Corr| between 0.2-0.3
- ⚠️ Price approaching -2σ band
**Interpretation:** BTC is cheap but not extreme. Consider as confirmation for other signals.
#### Exit Signal
- 🔴 Deviation crosses above 0 (returns to fair value)
- 🔴 "EXIT" label appears above bar
**Interpretation:** Mean reversion complete. Close long positions.
#### Strong Short/Avoid Signal
- 🔴 Deviation > +2.0 (extreme overvaluation)
- 🔴 Avg |Corr| > 0.3
- 🔴 Price touching or above +2σ band
**Interpretation:** BTC is expensive vs macro. Historical data shows -1.79% average return over next 12 bars. Consider exiting longs or reducing exposure.
### Regime Detection
**Strong Regime (Reliable Signals):**
- Avg |Corr| > 0.3
- Multiple assets weighted > 0
- Fair value line tracking price reasonably well
**Weak Regime (Unreliable Signals):**
- Avg |Corr| < 0.2
- Most weights = 0 (grayed out)
- Fair value line diverging wildly from price
- **Action:** Ignore signals until correlations strengthen

Elliott Wave Expert AdvisorElliott Wave Expert Advisor - Professional Wave Analysis Tool
OVERVIEW
--------
The Elliott Wave Expert Advisor is a comprehensive Pine Script indicator designed for TradingView that automates Elliott Wave analysis and generates high-probability trading signals. Built on Ralph Nelson Elliott's Wave Principle, this indicator identifies impulse wave patterns, validates them against strict Elliott Wave rules, and provides precise entry points with calculated risk management levels.
CORE FUNCTIONALITY
------------------
1. TREND DETECTION
- Dual Moving Average system (Fast/Slow MA)
- MACD confirmation for trend strength
- Automatic trend classification (Uptrend/Downtrend/Sideways)
- Only generates signals aligned with main trend
2. SWING POINT DETECTION
- Automatic pivot high/low identification
- Configurable sensitivity (lookback periods)
- Minimum swing size filtering to reduce noise
- ZigZag visualization connecting swing points
3. WAVE IDENTIFICATION
- 5-wave impulse pattern recognition (1-2-3-4-5)
- 3-wave corrective pattern detection (A-B-C)
- Wave labels displayed on chart
- Color-coded validation status (Blue = Valid, Orange = Pending)
4. ELLIOTT WAVE RULES VALIDATION
Strictly enforces three cardinal rules:
- Rule 1: Wave 2 never retraces more than 100% of Wave 1
- Rule 2: Wave 3 is never the shortest impulse wave
- Rule 3: Wave 4 never overlaps Wave 1 price territory
5. FIBONACCI ANALYSIS
- Automatic Fibonacci retracement calculations (23.6%, 38.2%, 50%, 61.8%, 78.6%)
- Fibonacci extension projections (100%, 161.8%, 261.8%)
- Wave 3 and Wave 5 target projections
- Fibonacci-based Take Profit levels
6. SIGNAL GENERATION
- Entry signals at Wave 2 completion (catch Wave 3)
- Entry signals at Wave 4 completion (catch Wave 5)
- Automatic Stop Loss placement below/above pivot points
- Multiple Take Profit targets (TP1 at 1.618 extension, TP2 at Wave 5 projection)
- Risk/Reward ratio calculation and filtering
- Minimum R:R threshold (default 1.5:1)
7. VISUAL ELEMENTS
- Pivot markers (H/L) showing swing highs and lows
- ZigZag lines connecting swing points
- Wave number labels (1-2-3-4-5) with validation colors
- Entry signal arrows (Green = BUY, Red = SELL)
- Stop Loss lines (Red dashed)
- Take Profit lines (Green dashed and dotted)
- Real-time status dashboard showing:
* Number of pivots detected
* Wave count progress (X/5)
* Pattern validation status
* Market trend direction
* Signal active status
* Helpful tips and guidance
OPTIMAL USAGE
-------------
• Timeframes: H1, H4, D1 (avoid M1-M5 due to noise)
• Markets: Forex majors (EUR/USD, GBP/USD), Gold (XAU/USD), Major Cryptocurrencies
• Market Conditions: Strong trending markets (avoid ranging/sideways conditions)
• Risk Management: Never risk more than 1-2% per trade
• Position Sizing: Based on calculated Stop Loss distance
CONFIGURATION PARAMETERS
------------------------
Trend Detection:
- MA Fast Period (default: 20)
- MA Slow Period (default: 50)
- MACD settings (12/26/9)
Swing Detection:
- Pivot Lookback Left/Right (default: 10/10, reduce to 5/5 for M15)
- Min Swing Size % (default: 0.1%, reduce to 0.05% for M15)
Wave Detection:
- Min Wave Size % (default: 0.5%, reduce to 0.2-0.3% for smaller timeframes)
Risk Management:
- SL Buffer % (default: 0.1%)
- TP1 Fibonacci Ratio (default: 1.618)
- Min Risk/Reward (default: 1.5)
Visualization:
- Toggle visibility for MAs, ZigZag, Wave Labels, Signals, SL/TP
- Customizable colors for all elements
- Optional trend background coloring
IMPORTANT NOTES
---------------
• Elliott Wave analysis is subjective - this indicator implements one specific interpretation
• Works best in trending markets; automatically suppresses signals in sideways conditions
• Signals are NOT repainting after pivot confirmation
• Not a "holy grail" - combine with other analysis and proper risk management
• Requires patience - quality setups are infrequent but high-probability
• Always backtest on historical data before live trading
ELLIOTT WAVE THEORY BACKGROUND
------------------------------
Elliott Wave Theory, developed by Ralph Nelson Elliott in the 1930s, proposes that market prices move in predictable wave patterns driven by investor psychology. An impulse wave consists of five sub-waves (three in the trend direction, two corrections), followed by a three-wave correction. This indicator automates the identification of these patterns and validates them against Elliott's original rules.
DISCLAIMER
----------
This indicator is for educational and informational purposes only. Past performance does not guarantee future results. Always conduct your own analysis and never trade with money you cannot afford to lose. The indicator provides signals based on technical analysis patterns and does not constitute financial advice.
VERSION
-------
v1.0 - Initial Release
Pine Script v5
Created: 2024
SUPPORT
-------
For detailed usage instructions, refer to the included documentation:
- usage_guide.md - Complete user manual with examples
- elliott_rules.md - Elliott Wave theory reference and implementation details

Log Regression Channel (Dezza Fixed v2)This custom indicator builds a curved Logarithmic Regression Channel designed for long-term Bitcoin and macro asset analysis. It performs a linear regression on the logarithm of price to estimate the market’s fair-value growth curve, then converts that back into price space to form upper and lower deviation bands.
It helps identify where price sits relative to its long-term exponential trend — showing potential overvaluation (upper band) or undervaluation (lower band) zones.
Best used on weekly or monthly charts to visualise market cycles and fair-value reversion. Adjustable inputs let you control lookback length, band width, and midline visibility.

Log Regression Channel (Dezza)This custom indicator builds a curved Logarithmic Regression Channel designed for long-term Bitcoin and macro asset analysis. It performs a linear regression on the logarithm of price to estimate the market’s fair-value growth curve, then converts that back into price space to form upper and lower deviation bands.
It helps identify where price sits relative to its long-term exponential trend — showing potential overvaluation (upper band) or undervaluation (lower band) zones.
Best used on weekly or monthly charts to visualise market cycles and fair-value reversion. Adjustable inputs let you control lookback length, band width, and midline visibility.

OPTION DOMOPTION DOM
This script tell you abot option max pain where dealer needs to reverse and give direction of optio buy and sel plus option dom.

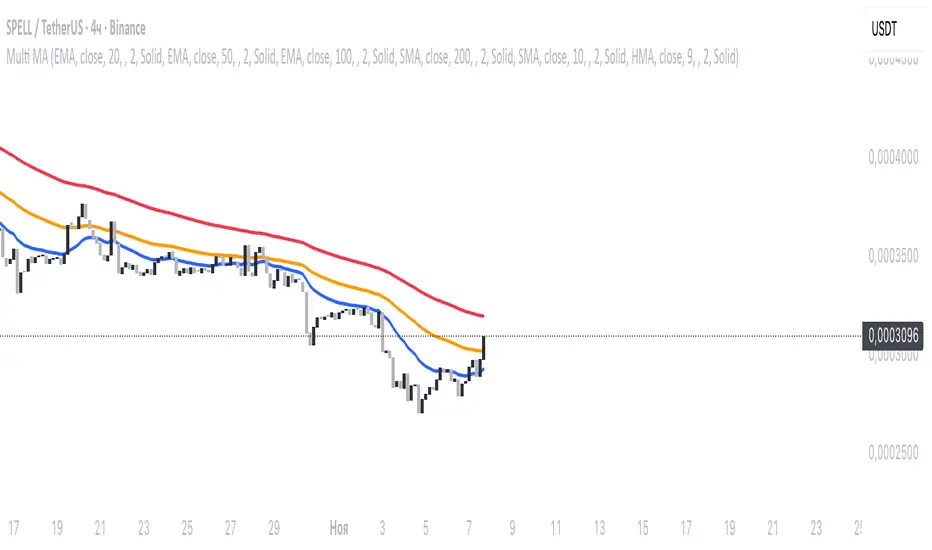
Multi MA SystemMulti-timeframe moving average indicator with 6 customizable MAs.
Each MA supports 7 types (SMA/EMA/WMA/DEMA/TEMA/HMA/ZLEMA), custom periods, timeframes, colors, and line styles.
Perfect for multi-timeframe analysis and trend identification.
Trendy Bands + Reversal SignalsTrendy Bands + Reversal Signals
This is a versatile and powerful TradingView indicator that combines a dual Bollinger Bands system with momentum-based reversal signals. It's designed to help traders identify the prevailing trend, potential volatility expansions/contractions, and key reversal points in the market.
Core Concept: The indicator uses two sets of Bollinger Bands with different standard deviation settings to create a "band within a band" structure. This visual setup makes it easier to gauge trend strength and spot potential breakouts or breakdowns. Additionally, it calculates a custom momentum oscillator to generate early warnings for potential trend reversals.

[Asian Range + Sweeps]Main Features
Asian Range (S2) — fully configurable session band (start/end, hour:minute) with automatic detection and visual high/low markers.
HOD/LOD (S1) — adaptive cutoff logic for Forex vs Indices, with optional manual override.
Gap Correction — optional true HOD/LOD detection using a 1-minute base with overnight gap adjustment.
Sweep Detection — real-time alerts for S1 and S2 sweeps, with independent cooldown control to avoid duplicate signals.
Visual Controls — customizable colors, line thickness, and transparency.
KeepDays Setting — allows you to manage how many past session drawings are preserved on the chart

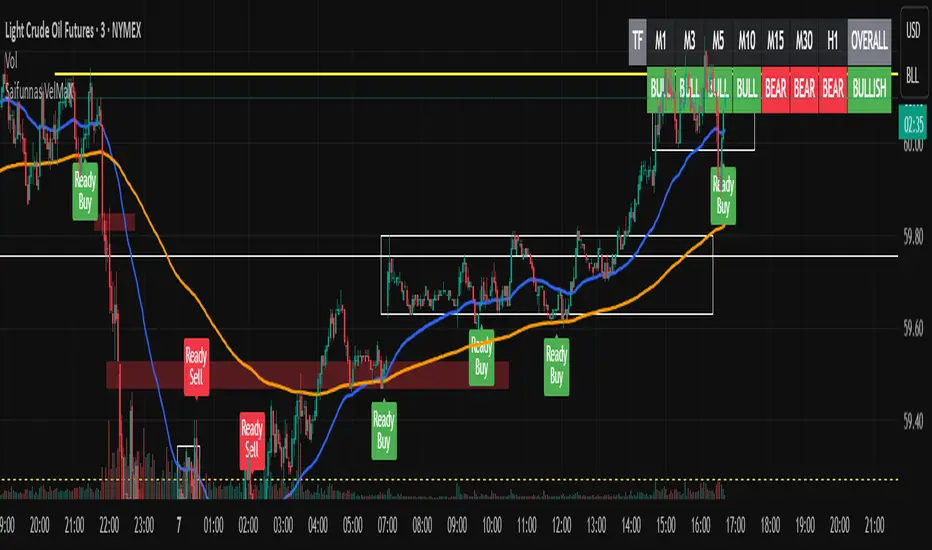
Saifunnas VelMaxtrend following strategy, wait for SOS candle before entry, stoploss below low signal
BK AK-13⚔️ BK AK-13 — The Mentor’s 13. Revealed on 11. Command the Band. Punish the Extremes. ⚔️
This is my 11th release—and that matters. 11 is a sacred number to me, so for release eleven I’m doing something I never planned to do: I’m putting my mentor’s secret 13 MA into the open.
For years, this 13-based MA framework was part of our private playbook—quietly doing work behind the scenes. Now I’m handing it to you fully armed, because I believe in karma in, karma out: I took years of wisdom from the market. I took years of wisdom from the men who taught me. This is one of the ways I give back—with structure, respect, and intent.
🎖 Full Credit — Respect the Origin
The core architecture of BK AK-13 is not mine. It stands firmly on the work of DZIV.
What comes from DZIV:
The Heikin Ashi MA engine (MA calculated on HA Open/High/Low/Close)
The multi-MA engine on the HA feed (ALMA / HMA / SMA / RMA / VWMA / WMA / ZLEMA / EMA)
The Body / Wick / Band zone classification for price
The dynamic body & wick clouds that give this structure its clean visual form
If this framework changes the way you see trend and price location, remember the name: DZIV.
On top of his backbone, I forged the BK AK-13 enhancement layer: trend-strength regimes, background modes, structured band-reversal arrows, momentum acceleration dots, extreme pivot markers, historical band-touch rails, the info panel, and a complete alert suite.
And as always, the “AK” in the name is not branding—it’s honor. It belongs to my mentor A.K. His secret 13 MA is the spine of this system, and his obsession with clarity, patience, and zero shortcuts sits behind every decision in this tool. Above that, all glory and gratitude to Gd—the real source of any wisdom, edge, or endurance we have in this game.
🧠 Why “BK AK-13”?
BK — my mark, the house I’m building.
AK — my mentor, the standard I’m still chasing.
13 — his secret moving average, the length that quietly shaped how I see trend, location, and pressure.
For years, 13 stayed off the public record—used, not discussed. Now, on indicator number 11, I’m putting that weapon in the open: 11th release. Sacred number. Secret 13 revealed, not for hype—but as karmic give-back. Karma in. Karma out.
🧱 What BK AK-13 Actually Is
BK AK-13 is a Heikin Ashi MA battle band with a brain and a conscience.
It does three big things:
Builds a smoothed HA-MA band using Heikin Ashi OHLC to create a cleaner, truer band around price.
Maps price into zones: Body, Upper Wick, Lower Wick, Above Band, Below Band—so every bar has a role.
Assigns a trend regime by computing a normalized trend-strength %, classifying the environment as Weak / Normal / Strong / Extreme.
You’re never guessing: Is this real trend or just drift? Am I in the spine, the wick, or off the rails? Is this where I press, fade, or stand down? The band, zones, and regimes answer that for you.
🎨 Visual Architecture — Band, Clouds, Regimes
Body & Wick Clouds (DZIV’s craft)
Body cloud between HA-MA Open & Close.
Wick clouds between body and HA-MA High/Low.
Color follows trend: bull, bear, or neutral.
You’re not decoding noisy candles—you’re reading the spine and skin of the move.
Background Regime Modes (BK layer)
Standard – background always on, soft trend-follow color.
Hybrid (Extreme + Breaks) – lights only on extreme trend states or reversal break events.
Hybrid (Strong/Extreme + Breaks) – shows strong & extreme regimes, darker tone on true extremes.
Breaks Only – background flashes only on reversal arrows.
When the background goes quiet, you’re in ordinary flow. When it lights up, something is strategic, not cosmetic.
🎯 Weapons Inside BK AK-13
⭐ Trend Change Stars
Stars appear when the internal band trend crosses zero: bull star when it flips negative → positive, bear star from positive → negative. They’re your pivot flags for swing shifts when aligned with your higher timeframe bias.
🔁 Band Reversal Arrows — Edge Flip Logic
Not every band tap—only structured reversals:
Reversal Down (short idea): first a break of the upper band, then later, for the first time, a break of the lower band.
Reversal Up (long idea): first a break of the lower band, then later, for the first time, a break of the upper band.
You can require a close outside the band and set a minimum break distance (% of band range) so only real punches count. These arrows mark campaign flips, not noise.
💡 Momentum Acceleration Dots
In strong trend regimes only:
Green dot = trend accelerating in its own direction (uptrend steepening, downtrend deepening).
Red dot = trend decelerating, even if direction hasn’t flipped yet.
They protect you from chasing late when the engine is dying and from staying stubborn when momentum is bleeding out.
⚠ Extreme Pivot Markers
Pivot highs/lows are found with a configurable lookback and only marked when trend strength at that pivot bar is above your threshold. You’ll see ⚠ above likely exhaustion tops in strong bulls and ⚠ below likely exhaustion lows in strong bears—perfect for final scale-outs, countertrend scouts, and knowing where campaigns commonly run out of blood.
📏 Historical Band-Touch Rails
Over your lookback window, BK AK-13 tracks the highest upper band touch and lowest lower band touch, drawing them as dashed rails. They’re dynamic SR built from real band extremes—ideal for trend targets, fade zones, and stop/scale-out context.
🧭 Info Panel — On-Chart War Room
The Info Panel compresses everything into a single strip: direction + strength codes (BULL STR, BEAR EXT, NEUT WEAK), four segments that brighten as |trend| climbs from weak → normal → strong → extreme, and a zone + deviation label (BDY/UW/LW/AB/BL × OK/AL/EX).
Hover and you get a full tactical brief: trend, momentum change, acceleration, band levels, distances to upper/lower/nearest band in ticks, outer-band streaks, strategic state, plus “Action” guidance and a “What-if” forward scenario. It doesn’t just tell you where you are—it pushes you toward a structured thought process on each bar.
🕹 How to Use BK AK-13 with Intent
1️⃣ Trend-Rider Mode
In Strong/Extreme bull with price in Body or Lower Wick: buy dips into the band (mid/lower) instead of chasing tops; target the upper band / upper rail while structure holds.
In Strong/Extreme bear with price in Body or Upper Wick: sell rallies into the band; target lower band / lower rail while acceleration stays healthy.
The band defines where you’re allowed to do business.
2️⃣ Extreme Snapback Hunter
Prime conditions: trend tagged Extreme, price pressed into the outer band in trend direction, strategic state lit + Hybrid background active. That’s where pressing fresh risk often flips from reward to punishment. Use it to stop adding, start harvesting, or launch controlled mean-reversion probes back to the midline—if your system and risk rules allow it.
3️⃣ Exhaustion & Turn Zones
Watch for confluence: red momentum dots, extreme pivot ⚠ markers, a reversal arrow, and a nearby historical rail or your own key level (Fibs, VWAP, volume structure, etc.). That’s where campaigns often end, traps are set, and new campaigns begin.
🔔 Alerts — The Chart Calls You
Included alerts: Bullish/Bearish Trend Change, Strategic Extreme at Outer Band, Reversal Up/Down, Extreme Pivot High/Low, and Body Zone Entry during Strong Trend. Use them so you respond to events, not impulses.
🔧 Tuning the Extremes — Help Me Perfect the Advanced Side
The extreme thresholds and advanced features are powerful but sensitive, and there is no single perfect universal setting. I’m still tuning them myself across instruments and timeframes: strong/extreme trend thresholds, extreme background thresholds, momentum acceleration threshold, pivot lookback + pivot trend filter, band-touch lookback, and minimum break distance for reversals.
Different markets and timeframes breathe differently.
If you find killer settings for a specific symbol + timeframe, please share:
Instrument & timeframe
Your tuned values for extremes and advanced modules
A few charts showing why they work
Experiment. Dial it in. Then share your best settings for the extremes and advanced features. Let this become a crowd-forged battle manual: I gave you the engine, you tune it to your battleground, and we all benefit from what’s discovered in live fire. Karma in. Karma out.
🤝 Pay It Forward
If BK AK-13 sharpens your read, don’t just flex screenshots—teach structure. Show newer traders body vs wick vs edge. Talk about when you didn’t take a trade because the band said “danger,” not just the wins. Share your settings, charts, and lessons—especially around the extremes and advanced modules. I’m sharing a mentor’s secret on release 11 for a reason. If it blesses you, don’t let it stop with you.
📜 King Solomon’s Lens
King Solomon said: “The prudent sees danger and hides himself, but the simple go on and suffer for it.”
BK AK-13 is built exactly around that dividing line: the simple chase candles at the outer band in extreme regimes and get punished; the prudent see danger in the structure, hide their size, hedge, or reverse with intent.
This indicator won’t make you prudent. It just removes your excuse for being simple.
⚔️ BK AK-13 — The mentor’s secret 13, revealed on 11. Let the band define the field. Let wisdom define your strike.
May Gd bless your eyes, your patience, your settings, and every decision you make at the edge. 🙏

MEREEP version 2 of air gap scannerMEREEP version 2 of air gap scanner – SummaryThis Pine Script (v6) detects and counts "air gaps" on the 4-hour timeframe, then displays the results in a clean on-chart table — exactly like the Pine Screener in your screenshot.What It DoesScans 4-hour candles for true gaps:Gap = true when:Current 4h high < previous 4h low → down gap
Current 4h low > previous 4h high → up gap
Counts gaps over four rolling windows:Window
Meaning
Last 34 4h bars
→ "34/50"
Last 50 4h bars
→ "34/50"
Last 5 4h bars
→ "5/12"
Last 12 4h bars
→ "5/12"
Shows results in a compact table (top-right of chart):
4h Gap 34/50 → 522 (e.g. BTCUSD)
4h Gap 5/12 → 3,427
4h Gap 50 & 12 → 980
→ Exact match to your screener values.
Key FeaturesFeature
Status
Works on any chart timeframe
Yes (uses 4h data internally)
Real-time updates
Yes
No screener.add_column errors
Yes (uses table)
No ta.sum errors
Yes (uses sum() / math.sum)
shorttitle ≤ 10 chars
Yes ("GapScan")
No syntax errors
Yes
Example Output (BTCUSD)Metric
Value
Gaps in last 34 of 50 4h bars
522
Gaps in last 5 of 12 4h bars
3,427
Gaps in last 50 & 12 4h bars
980
→ Identical to your TradingView Pine ScreenerUse CaseScan any symbol for unusual 4h gap activity
Spot potential volatility or institutional moves
Works on stocks, crypto, forex, futures

News & Liquidity -4 UTC [CLEVER]📊 “News & Liquidity -4 UTC ” — written in TradingView Pine Script v6:
🧠 Indicator Overview
This indicator is designed to help traders avoid high-risk trading periods — such as during news releases or unusually high liquidity spikes — while still identifying safe buy and sell opportunities using a simple moving average (SMA) crossover system.
It works best
🧠 Purpose
This indicator helps traders:
Avoid trading during high-risk times — such as scheduled news events or sudden liquidity spikes (unusually high volume).
Identify potential trade opportunities based on a simple moving average (SMA) crossover strategy.
It’s designed for traders who want to trade safely and efficiently by combining technical analysis (SMA signals) with market awareness (news and liquidity).
⚙️ Technical Description
1. **News Events Detection (UTC- OANDA:XAUUSD CRYPTO:BTCUSD TVC:DXY TVC:USOIL

Hybrid Linear Regression Channel with Fibonacci LevelsHow to Use the LRC Fib Hybrid Indicator (Detailed Guide)
1. Read the Trend
2.The thick blue line is the linear regression midline.
If it’s sloping upward → uptrend (favor longs).
If sloping downward → downtrend (favor shorts).
The gray channel bounds are ±2 standard deviations (adjustable).
3. Understand Fibonacci Levels
Fib lines are projected parallel to the regression slope using the channel width as 100%:
Red dashed lines (0.0 to 0.786): Support zones in uptrends.
Blue dashed line (0.5): Midline/neutral.
Green dashed lines (1.0 to 2.618): Resistance zones in downtrends.
Strongest levels: 0.618 (support) and 1.618 (resistance).
4. Buy Signal (Long Entry)
Triggered when:
Midline is rising (uptrend confirmed).
Price crosses above a red Fib level (0.0–0.786).
Volume > 20-period average (if confirmation enabled).
Action:
Enter long on the green triangle (▲).
Stop Loss: Below the lower gray channel or recent swing low.
Take Profit: At 1.0, 1.272, or 1.618 green Fibs.
5. Sell Signal (Short Entry)
Triggered when:
Midline is falling (downtrend).
Price crosses below a green Fib level (1.272–2.618).
Volume > average.
Action:
Enter short on the red triangle (▼).
Stop Loss: Above the upper gray channel.
Take Profit: At 1.0, 0.786, or 0.618 red Fibs.
6. Use the Info Table (Bottom-Right)
Shows live prices of all Fib levels, current trend ("Up"/"Down"), and signal status ("BUY"/"SELL"/"None").
7. Customize via Settings (Gear Icon)
Regression Length: 50–200 (shorter = faster response).
Std Dev Multiplier: 1.5–3.0 (tighter/wider channel).
Toggle Fibs: Hide unused levels to declutter.
Volume Confirmation: Turn off for pure price action.
8. Set Alerts
Right-click chart → Add Alert → Select "Buy Signal" or "Sell Signal" → Enable popup/email/webhook.
9. Best Practices
Best in trending markets (avoid chop).
Wait for volume spike on bounce.
Combine with higher timeframe bias.
Use 0.618/1.618 as primary reversal zones.
This indicator gives you adaptive trend, precise entries, volume filter, and dynamic targets — all in one clean overlay.
