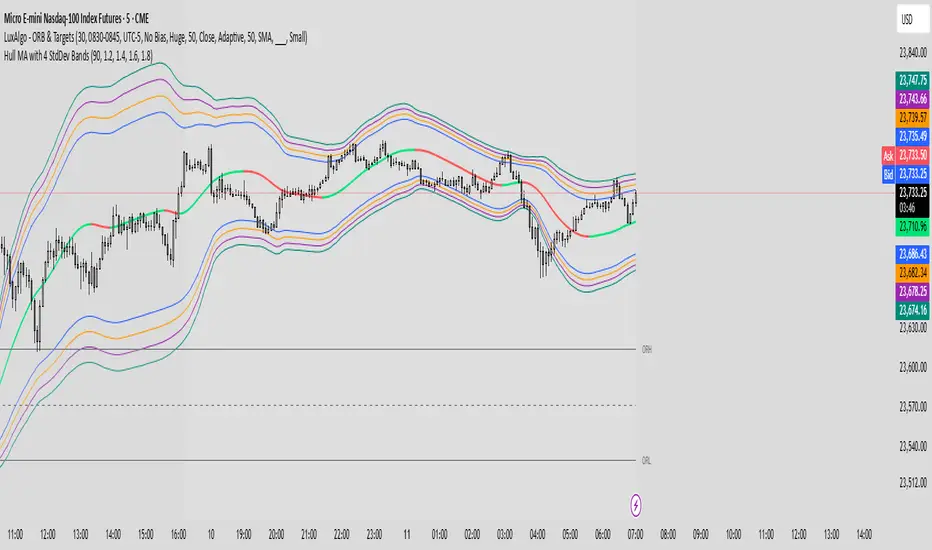
Hull MA with 4 StdDev Bandsull MA with Multi-StdDev Bands
This indicator plots a Hull Moving Average (HMA) of (High + Low) / 2 with a default length of 90, surrounded by four customizable standard deviation bands.
Features:
Dynamic Hull MA coloring: Green when price trend is rising, red when falling.
Customizable deviation levels: Default set to 1.2, 1.4, 1.6, and 1.8 standard deviations, adjustable in the settings.
4 upper and 4 lower volatility bands: Based on the standard deviation of price relative to the Hull MA, providing a clear visual of potential overbought and oversold zones.
Uses:
Identify trend direction quickly via Hull MA color change.
Monitor volatility expansion/contraction.
Spot potential reversal or breakout areas when price interacts with outer bands.
Bands and Channels
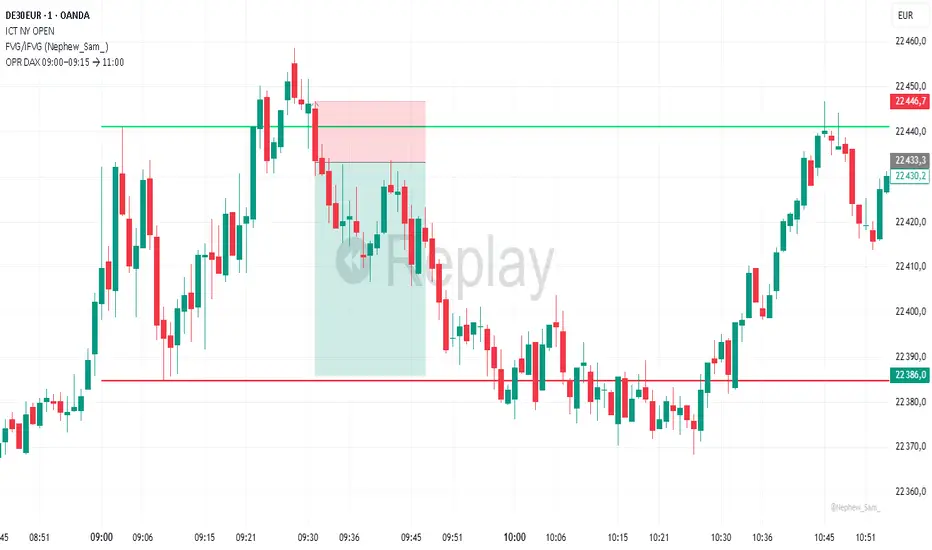
OPR DAX 09:00–09:15 → 11:00 Nico VThis indicator plots on the DAX each day:
The high (green) and low (red) of the 09:00 → 09:15 Berlin time range.
These levels are extended horizontally until 11:00.
Optionally, it displays the midpoint as a white dashed line.
Purpose: to quickly identify the morning opening range (OPR) and observe how price reacts to these levels during the rest of the morning.
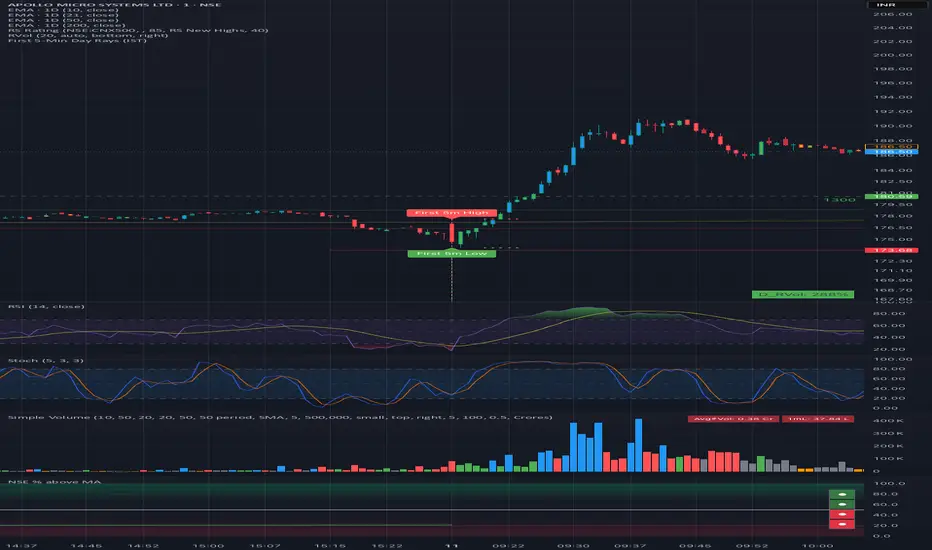
915 Opening Range RaysDraws the high and low of the 09:15–09:20 first 5-min candle each day as horizontal rays with options for extension and alerts.
Gamma & Max Pain HelperGamma & Max Pain Helper
Plots Call Wall, Put Wall, and Max Pain levels directly on your chart so you can see where options positioning might influence price.
Features:
Manually enter Call Wall, Put Wall, and Max Pain strike prices.
Lines auto-update each bar — no redrawing needed.
Labels display name + strike price.
Option to only show lines near current price (within a % you choose).
Color-coded:
Red = Call Wall (potential resistance)
Green = Put Wall (potential support)
Blue = Max Pain (price magnet into expiry)
Adjustable line width & extension.
Use Case:
Perfect for traders combining options open interest/gamma analysis with price action, pivots, VWAP, and other intraday levels. Quickly spot overlaps between option walls and technical barriers for high-probability reaction zones.

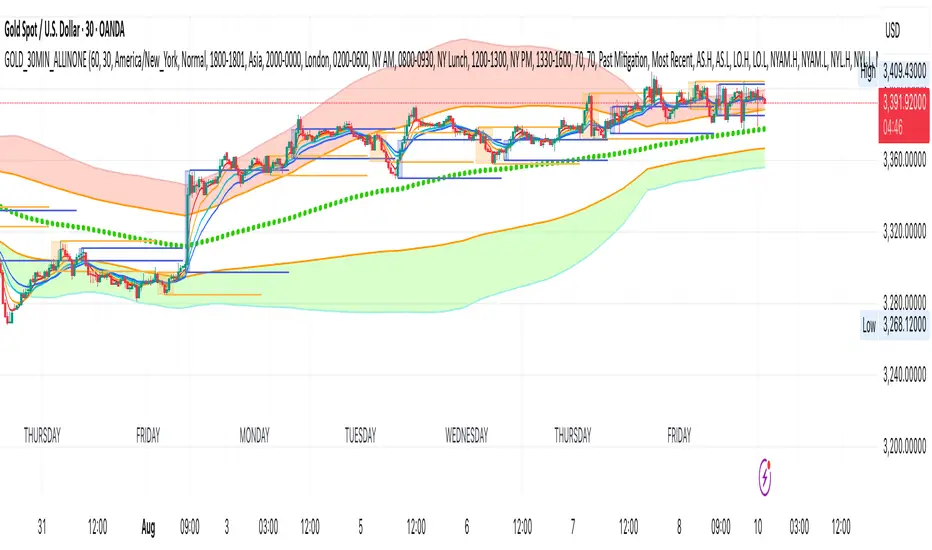
GOLD_30MIN_ALLINONEA comprehensive 30 minute trading tool for XAUUSD trading.
Use in combination of the indicator: 1 minute Easy Scalping Sys v3.0 (by BulltradingAM).
Rules:
1. A solid break out (measure breakout strength from the other indicator mentioned above) from the London session high or low (Orange Boxes), during the first 3 30Min candles of NYC session (Blue Boxes).
2. open position in the direction of the break out, set SL on London session high/low and TP on 1:1 RR or Bollinger Band outer line (for trending trades) and Bollinger Band Base line (for pullbacks and trend reversal trades).
3. No long trades in Bollinger red section and no short trades in Bollinger green section.
More Information:
You need the indicator only for the breakout candle momentum strength with the following indicator settings:
Timeframe 1: 1 Day
Timeframe 2: 30 Minutes
Timeframe 3: 30 Minutes
Timeframe 4: 30 Minutes
and set the week candles fill to blank for easy identification.
You will not need ATRs or Hulls lines or anything else from the other indicator.
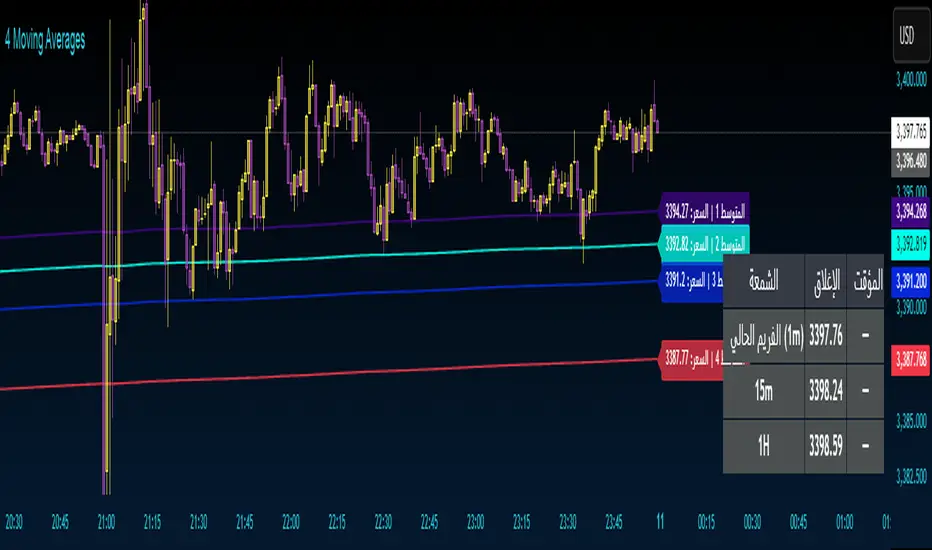
4 Moving Averages 4 Moving Averages
An indicator with four moving averages with ready-to-use settings. Use them as support and resistance.
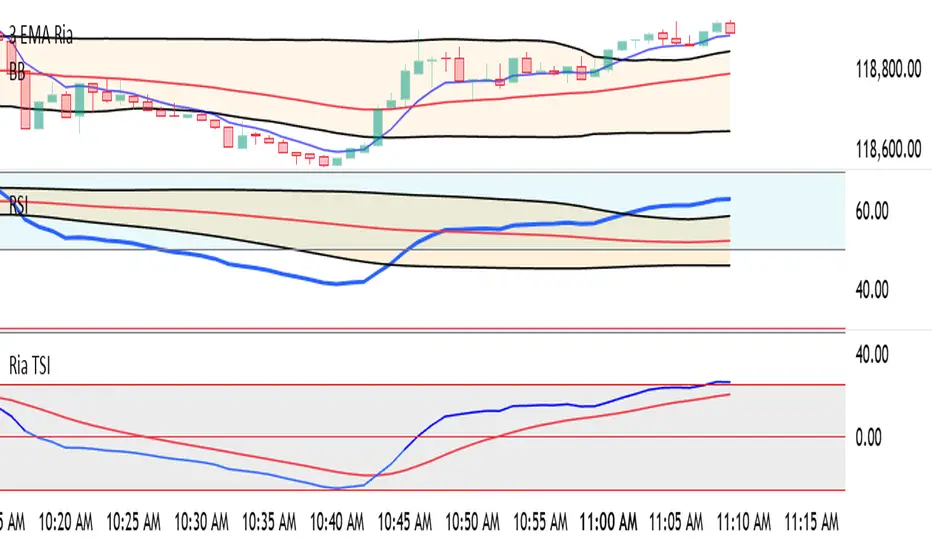
Ria TsiPlots TTM Squeeze momentum histogram (green/red).
Plots RSI (blue) in the same pane.
Shows squeeze dots and RSI overbought/oversold lines.
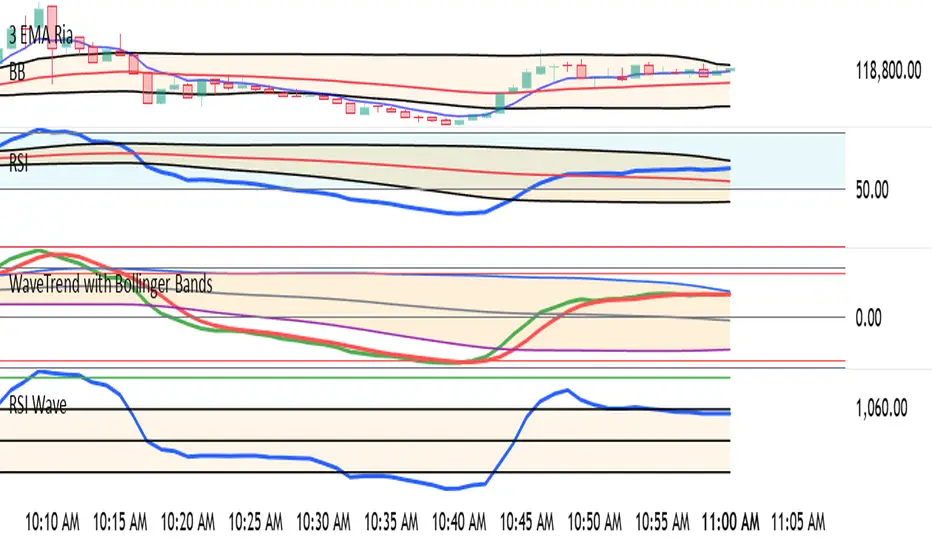
RSI Wave squeezePlots TTM Squeeze momentum histogram (green/red).
Plots RSI (blue) in the same pane.
Shows squeeze dots and RSI overbought/oversold lines.

WaveTrend with Bollinger BandsPlots TTM Squeeze momentum histogram (green/red).
Plots RSI (blue) in the same pane.
Shows squeeze dots and RSI overbought/oversold lines.
S/R Clouds Overview
The S/R Clouds Indicator is a sophisticated TradingView tool designed to visualize support and resistance levels through dynamic cloud formations. Built on the principles of Keltner Channels, it employs a central moving average enveloped by volatility-based bands to highlight potential price reversal zones. This indicator enhances chart analysis with customizable aesthetics and practical alerts, making it suitable for traders across various strategies and timeframes.
Key Features
Dynamic Bands: Calculates upper and lower bands using a configurable moving average (SMA or EMA) offset by multiples of the average true range (derived from high-low ranges), capturing volatility deviations for precise S/R identification.
Cloud Visualization: Renders semi-transparent clouds between primary and extended bands, providing a clear, layered view of support (lower) and resistance (upper) areas.
Trend Detection: Incorporates a trend state logic based on price position relative to bands and moving average direction, aiding in bullish/bearish market assessments.
Customization Options:
Select from multiple color themes (e.g., Neon, Grayscale) or use custom colors for bands.
Enable glow effects for enhanced visual depth and adjust opacity for chart clarity.
Volatility Insights: Monitors band width to detect squeezes (low volatility) and expansions (high volatility), signaling potential breakouts.
Alerts System: Triggers notifications for price crossings of bands, trend changes, and other key events to support timely decision-making.
How It Works
At its core, the indicator centers on a user-defined period moving average. Volatility is measured via an exponential moving average of the high-low range, multiplied by adjustable factors to form the bands. This setup creates adaptive clouds that expand/contract with market volatility, offering a more responsive alternative to static S/R lines. The result is a clean, professional overlay that integrates seamlessly with other technical tools.
This high-quality indicator prioritizes usability and visual appeal, ensuring traders can focus on analysis without distraction.

Fiyat Önceki 10 Barın En Yükseğinden Büyükhareketli ortalamalar ve kanal üzeri alıma dayalı bir strateji

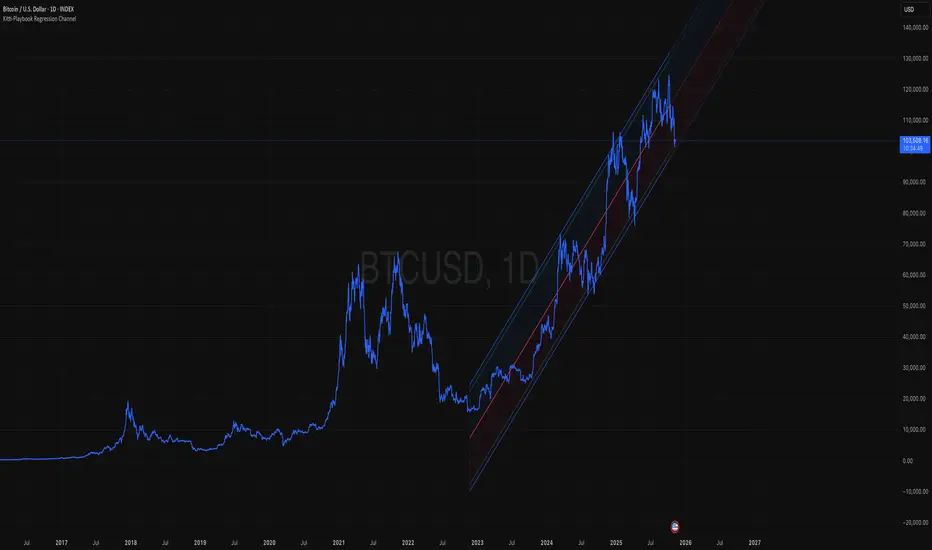
Kitti-Playbook Regression ChannelThis indicator used to study price movements in the form of a Regression Channel, and offers the following capabilities:
1)Specify the starting point., which bar to start from
2)Specify the ending point., which bar to end at
3)Option to set the end point to the very last bar
4)Adjust the channel width from 0 to 4 standard deviations (SD)
5)Adjust the channel color
6)Extend channel ( Left / Right / Both )
7)Display points where the MACD (12, 26) crosses the zero line”
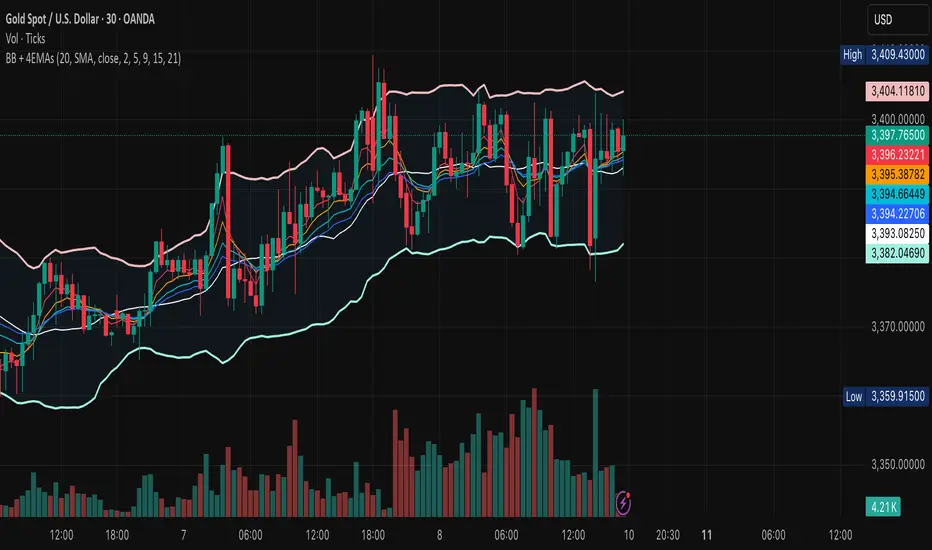
BB + 4 EMAsCustom Bollinger Bands with 4EMAs of your choice. All added in one indicator.
Look Before You Leap!

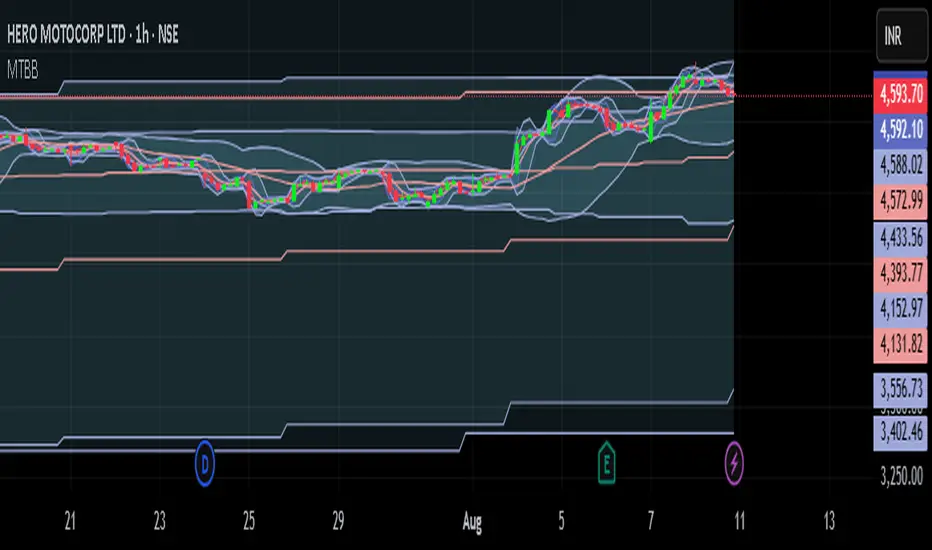
Multi Timeframe 7 Bollinger Bands by CSPMulti Timeframe 7 Bollinger Bands by CSP IT SHOW 1MT,5MT,10MT,1HR,D, W,M BOLLINGER BAND IN ASINGLE CHART.


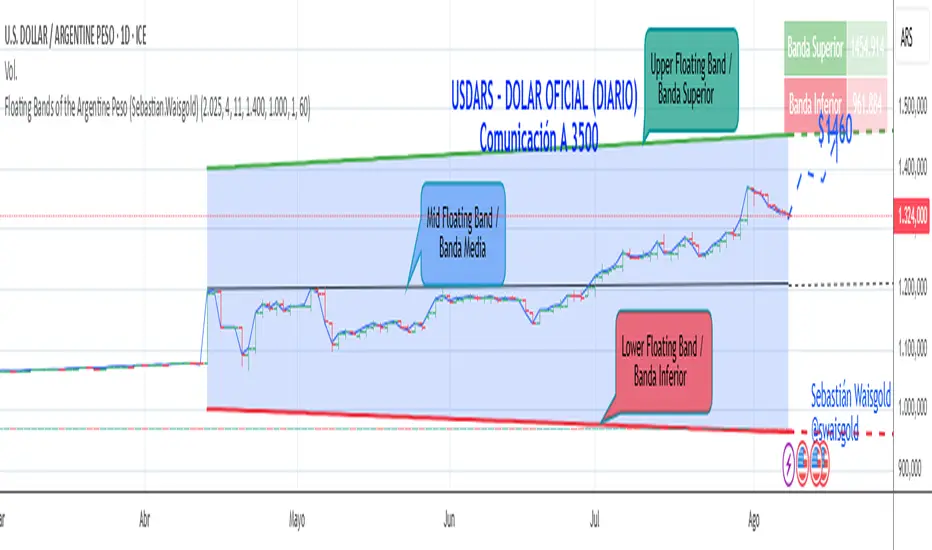
Floating Bands of the Argentine Peso (Sebastian.Waisgold)
The BCRA ( Central Bank of the Argentine Republic ) announced that as of Monday, April 15, 2025, the Argentine Peso (USDARS) will float within a system of divergent exchange rate bands.
The upper band was set at ARS 1400 per USD on 15/04/2025, with a +1% monthly adjustment distributed daily, rising by a fraction each day.
The lower band was set at ARS 1000 per USD on 15/04/2025, with a –1% monthly adjustment distributed daily, falling by a fraction each day.
This indicator is crucial for anyone trading USDARS, since the BCRA will only intervene in these situations:
- Selling : if the Peso depreciates against the USD above the upper band .
- Buying : if the Peso appreciates against the USD below the lower band .
Therefore, this indicator can be used as follows:
- If USDARS is above the upper band , it is “expensive” and you may sell .
- If USDARS is below the lower band , it is “cheap” and you may buy .
It can also be applied to other assets such as:
- USDTARS
- Dollar Cable / CCL (Contado con Liquidación) , derived from the BCBA:YPFD / NYSE:YPF ratio.
A mid band —exactly halfway between the upper and lower bands—has also been added.
Once added, the indicator should look like this:
In the following image you can see:
- Upper Floating Band
- Lower Floating Band
- Mid Floating Band
User Configuration
By double-clicking any line you can adjust:
- Start day (Dia de incio), month (Mes de inicio), and year (Año de inicio)
- Initial upper band value (Valor inicial banda superior)
- Initial lower band value (Valor inicial banda inferior)
- Monthly rate Tasa mensual %)
It is recommended not to modify these settings for the Argentine Peso, as they reflect the BCRA’s official framework. However, you may customize them—and the line colors—for other assets or currencies implementing a similar band scheme.

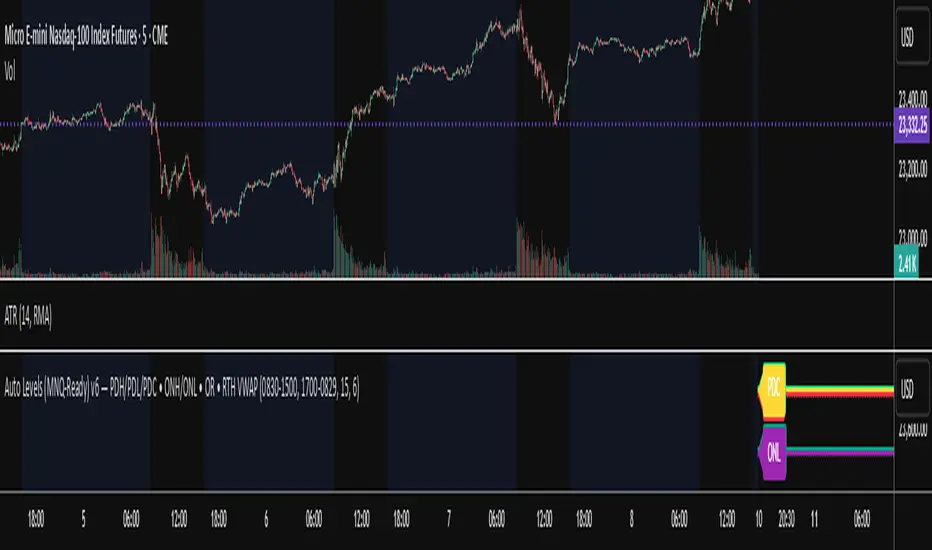
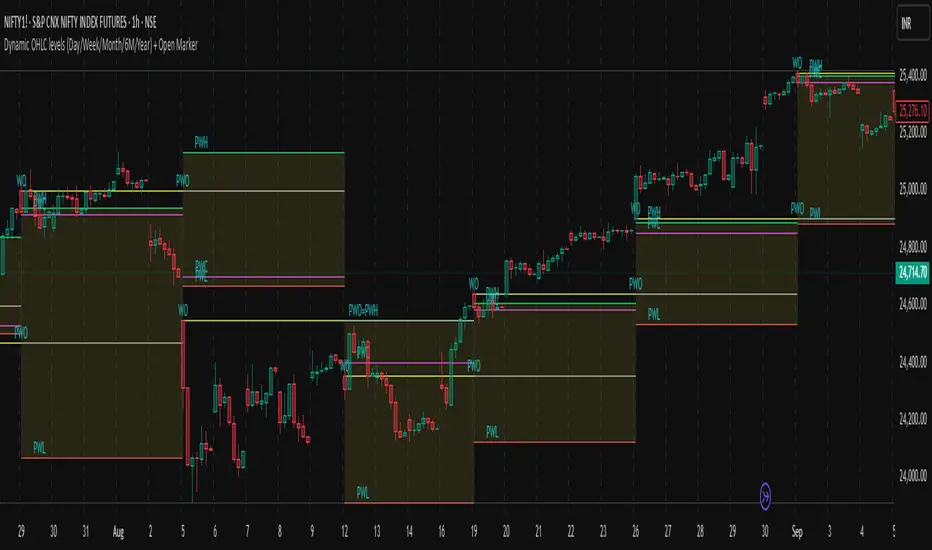
Dynamic OHLC levels(Day/Week/Month/6M/Year)+Open MarkerThis indicator automatically displays the Open, High, Low, and Close (OHLC) levels from the previous trading period directly on your chart. It's a versatile tool for identifying key support and resistance zones based on historical price action. The indicator offers a unique "Auto" mode that intelligently selects the most relevant time frame (Daily, Weekly, Monthly, 6M, or Yearly) based on your current chart's time frame. Alternatively, you can choose a specific time frame in "Manual" mode.
The indicator is designed to provide traders with clear visual cues for important price levels, helping them make more informed trading decisions. It's a valuable resource for both intraday and swing traders, as these levels often act as significant psychological barriers and turning points in the market.
Key Benefits 🎯
Identifies Key Levels Instantly: Automatically plots crucial support and resistance levels from the previous session, saving you time and effort.
Adaptable & Versatile: The "Auto" mode intelligently adjusts to your chart's time frame, ensuring you always see the most relevant OHLC levels.
Customizable: You have full control over which levels to display (High, Low, Open, Close), their colors, line styles, and thickness.
Visual Clarity: The option to highlight the area between the previous high and low provides a clear visual representation of the past session's range.
Multi-Session Support: It supports both Regular Trading Hours (RTH) and Extended Trading Hours (ETH), with a configurable timezone, making it globally applicable.
Core Features ✨
Dynamic Timeframe Selection:
Auto Mode: Automatically displays previous Day OHLC on intraday charts (e.g., 1-hour), previous Week OHLC on daily charts, and so on.
Manual Mode: Allows you to explicitly choose between previous Day, Week, Month, 6-Month, or Year OHLC levels.
Customizable Visuals:
Show Previous High: Plots the highest price of the previous period.
Show Previous Low: Plots the lowest price of the previous period.
Show Previous Open: Plots the opening price of the previous period.
Show Previous Close: Plots the closing price of the previous period.
Show Current Open Marker Line: A separate line that marks the open of the current period.
Highlight Area: Fills the space between the previous high and low with a customizable color.
Global Trading Support:
Session Mode: Choose to display levels based on Regular Trading Hours, Extended Hours, or both.
Timezone Selection: Configure the session timezone to align with major markets like New York, London, Tokyo, or Kolkata.
Line Styling: Adjust the line thickness, style (Solid, Dashed, Dotted), and transparency for each level to match your chart's aesthetics.
Labels: Toggle on/off text labels that clearly identify each plotted level (e.g., "PDH" for Previous Day High).
Who is this indicator for? 👤
This indicator is a powerful tool for a wide range of traders looking to incorporate historical price action into their analysis.
Intraday Traders: Can use the previous Daily OHLC levels to identify potential support/resistance for breakouts and reversals during the trading day.
Swing Traders: Can leverage the previous Weekly, Monthly, or Yearly OHLC levels on higher time frames to spot long-term trend continuation or reversal points.
Day Traders: Use the Previous Daily High/Low to frame the day's trading range and identify key levels for potential mean-reversion trades.
Technical Analysts: Those who rely on key levels and price action will find this indicator invaluable for their analysis.
This indicator simplifies a crucial part of technical analysis, providing a clean, customizable, and adaptive way to visualize and trade off of historical price levels.
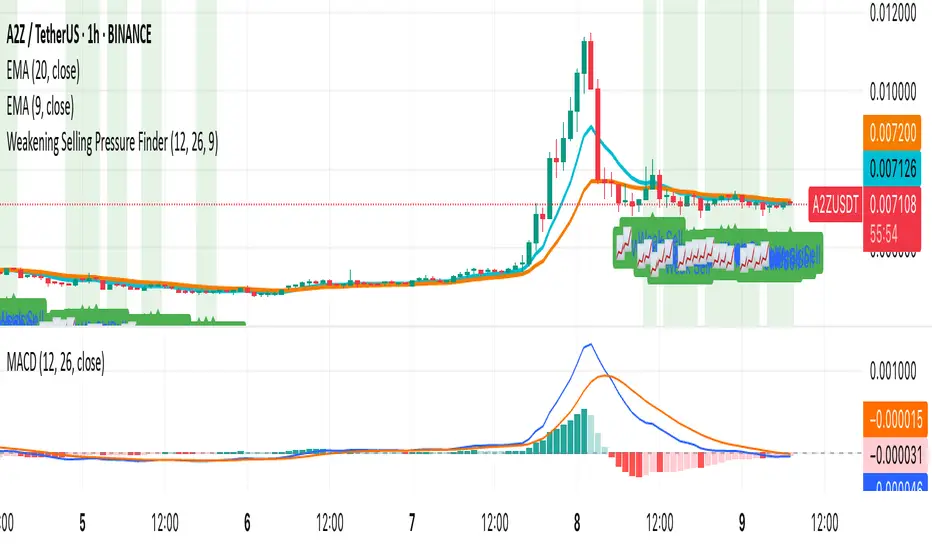
Weakening Selling Pressure FinderDescription:
This indicator helps traders identify potential trend reversals by detecting when selling pressure is weakening.
It uses the MACD histogram to spot moments when bearish momentum is still present but fading — a condition that often precedes a shift to bullish sentiment.
The indicator:
Highlights points where the MACD histogram is negative but rising
Marks these spots with a 📈 label for easy chart scanning
Works on any crypto pair and timeframe
Traders can use it to:
Spot early reversal setups before the crowd reacts
Time entries for potential trend changes
Complement other indicators like RSI, AO, or price action
This is a momentum shift detection tool — perfect for swing traders, scalpers, or anyone looking for early bullish signals after extended selling pressure.