Trend or Reversal (NQ optimized)This indicator is a session-aware trade map for NQ futures that combines VWAP, an adaptive Opening Range Box (ORB), prior-day/weekly value areas, and CVD-based divergences into a single confluence engine. It scores trend and reversal setups separately on every bar, then selects one best signal per bar (long or short) so you’re never flooded with conflicting entries.
Key features
Adaptive ORB box (RTH only): First 5–15 minutes after 9:30 ET (length auto-adjusts with ADX). The box defines the opening auction; once it closes, those highs/lows are locked as ORB breakout levels for the rest of the session.
Dynamic bias: Bias flips between bullish, bearish, or neutral based on ORB breaks and how price + EMA9 behave around VWAP.
Value-area context: Uses yesterday’s and last week’s VAH/VAL (70% range model) to define “safer” long/short zones (above VAL for longs, below VAH for shorts).
Session CVD & divergence: Builds a running intraday Cumulative Volume Delta and flags bullish/bearish divergences at extremes.
Confluence scoring: Four internal scores—Trend Long, Trend Short, Reversal Long, Reversal Short—each built from multiple factors (bias, VWAP, ORB, value areas, divergence). The side with the stronger score that passes its threshold prints:
T-LONG / T-SHORT for trend continuation
R-L / R-S for mean-reversion (fade) setups
How to use
Treat T-signals as your primary entries in strong directional moves, aligned with VWAP and ORB/value-area structure.
Treat R-signals as tactical fade opportunities into extremes, preferably at prior VAH/VAL or ORB edges and supported by CVD divergence.
The indicator is not a standalone system—combine it with your own execution rules, risk management, and higher-timeframe context. Not Financial Advice
Bands and Channels

Renko 2-block entry, 1-block exit (signals EVERY block)Renko 2-block entry, 1-block exit (signals EVERY block)

Vector CPR Bands## Overview
The Vector CPR Bands indicator enhances the classic Central Pivot Range (CPR) by incorporating "vector" detection—identifying periods with above-average or climactic volume. It projects CPR ranges from these high-volume periods forward as visual bands, which act as persistent support/resistance zones until invalidated by price action. Ideal for spotting key levels in trending or ranging markets, especially on higher timeframes like weekly or monthly.
## Key Features
- **CPR Calculation**: Plots previous, developing (non-repainting), and repainting CPR with mid-pivot, TC (top central), and BC (bottom central) lines, plus fills.
- **Vector Detection**: Scans for high-volume bars in the anchor timeframe (default weekly). Flags "above-average" (≥1.5x avg) or "large" (≥2x avg or max climax).
- **Band Projection**: Creates bands from vector-qualified CPR periods. Extends them rightward until touched/revisited (configurable: invalidate on wick/close, delete or freeze/gray out).
- **Customization**:
- Timeframe: Set CPR anchor (e.g., 'W' for weekly, 'M' for monthly).
- Display: Toggle CPR types, pivot guides.
- Volume Thresholds: Adjust lookback and ratios.
- De-clutter: Limit max bands, pin to period start, always extend.
- **Alerts & Signals**: Built-in alerts for developing pivot crossing previous pivot (bullish/bearish).
## How to Use
1. Add to chart and set anchor timeframe (e.g., 'M' for monthly vCPR on BTC, as shown in example charts).
2. Watch bands as S/R: Virgin (untested) bands often provide strong bounces; mitigated ones fade.
3. Combine with volume/price action: Bullish bands suggest upside bias, especially if price holds above.
4. Example: On BTC weekly, vector bands from high-volume weeks highlight multi-month zones—breaks signal shifts.

1Hr Stock Breakout HunterThis is a script works for 15min or 1hr, it tells you a trend is breakingout

Pi Cycle BTC Top + Pre-Alert BandsPi Cycle BTC Top + Pre-Alert Bands is an advanced implementation of the classic Pi Cycle Top model, designed for Bitcoin cycle analysis on higher timeframes (especially 1D BTCUSD/BTCUSD·INDEX).
The original Pi Cycle Top uses two moving averages:
• 111-day SMA (short MA)
• 350-day SMA ×2 (long MA)
A Pi Top is signaled when the 111 SMA crosses above the 350×2 SMA. Historically, this has occurred near major BTC cycle highs.
This script extends that idea with a 3-step early-warning sequence:
• Pi Green – early compression: short/long MA ratio crosses upward into the green band (convergence from below is required).
• Pi Yellow – mid-cycle warning: only fires if a valid Green has already occurred in the same cycle.
• Pi Cycle Top – final top: the classic Pi Cycle cross, limited to one top signal per cycle. After a top, no new Yellow or Top signals can appear until a new Green event starts the next cycle.
Background shading shows the active phase (Green / Yellow / late-cycle zone), so you can see at a glance where BTC is within its Pi-based macro structure.
All logic is non-repainting: request.security() uses lookahead_off and no future data is accessed.
Typical use
This indicator is intended as a macro-cycle timing and risk-awareness tool, not a stand-alone entry system. Many traders use it to:
• Watch for Pi Green as the start of a potential late-cycle advance.
• Treat Pi Yellow as a rising-risk environment and tighten risk management.
• Use the Pi Cycle Top as a historical high-risk zone where large profit-taking or hedging may be considered.
Always combine this with your own analysis (trend, volume, on-chain, macro) before making decisions.
How to set alerts
Add the indicator to your chart (1D BTCUSD or BTCUSD·INDEX recommended).
Click Alerts → Condition → Pi Cycle BTC Top + Pre-Alert Bands.
Choose one of:
• Pi Cycle – Green Pre-Alert (early convergence)
• Pi Cycle – Yellow Pre-Alert (after Green only)
• Pi Cycle – TOP (Single per Cycle, after Green)
Use “Once per bar close” for higher-timeframe reliability.
Disclaimer
This tool is for educational and analytical purposes only. The Pi Cycle concept is based on historical behavior and does not guarantee future results. This is not financial advice; always do your own research and manage risk appropriately.

Enhanced ML-FRAMA with HTFCore Concept
FRAMA (Fractal Adaptive Moving Average) is an adaptive moving average that automatically adjusts its sensitivity based on market volatility using fractal geometry. This indicator enhances it with Machine Learning predictions and multi-timeframe analysis.
Key Components:
1. ML-Enhanced FRAMA
ML Enhancement: Uses machine learning to adjust FRAMA's sensitivity
Dynamic Adaptation: ML predictions modify the smoothing constant based on market conditions
2. Machine Learning System
Three ML Models Combined:
K-Nearest Neighbors (KNN): Finds similar historical patterns
Trend Model: Uses EMA crossovers for trend detection
Momentum Model: Combines RSI, ROC, and volume for momentum
Features Used:
RSI, MACD, ATR, Rate of Change
Volume ratio and momentum
VWAP deviation
Higher timeframe RSI
Daily EMA trend
3. Higher Timeframe Integration
HTF1: 1-hour timeframe
HTF2: 4-hour timeframe
Confluence Trading: Requires agreement across multiple timeframes
4. Visual Features
Support/Resistance Circles: Dynamic levels based on ATR volatility
Color Coding:
Green: Bullish signals
Red: Bearish signals
Purple/Orange: HTF indicators
Trend Detection: Colors change based on direction
Requirements for Bullish Signal:
Price crosses above ML-FRAMA
ML prediction > 60% bullish
High confidence (>30%)
Volume 20% above average
Both HTF timeframes bullish
Performance Tracking:
Adaptive Weights: Automatically adjusts model weights based on recent accuracy
Dynamic K: Adjusts KNN neighbors based on market volatility
Outlier Detection: Filters unusual bars from training data
Trading Philosophy:
Multi-Timeframe Confirmation
Avoids false signals by requiring HTF agreement
Reduces noise by focusing on higher probability setups
Volume Confirmation
Requires above-average volume for valid signals
Volume momentum adds conviction
Machine Learning Edge
Learns from historical patterns
Adapts to changing market conditions
Combines multiple analysis techniques
Use Cases:
Trend Following: ML-FRAMA as dynamic support/resistance
Breakout Trading: Price crosses with volume and HTF confirmation
Mean Reversion: Support/resistance circles as reversal zones
Swing Trading: HTF confluence for higher probability setups
Strengths:
Adaptive: Adjusts to market volatility
Multi-timeframe: Reduces false signals
Volume-confirmed: Adds conviction
ML-enhanced: Learns from market behavior
Visual: Clear support/resistance levels
Ideal For:
Swing traders looking for high-probability entries
Trend followers wanting adaptive moving averages
Technical analysts who value multi-timeframe confirmation
Traders who want machine learning without complexity
The indicator essentially creates a "smart" adaptive moving average that learns from the market and only provides signals when multiple timeframes and technical factors align.

Trend Drawing + OB Signal (MTF) [ASCII]Script Description: Advanced Multi-Timeframe Trend Lines & OB/OS Signal
Overview
This advanced Pine Script indicator is designed to identify and project key support and resistance levels using pivot-based trend lines across multiple timeframes. It combines this powerful trend analysis with a sophisticated Overbought/Oversold (OB/OS) detection system using CCI and Bollinger Bands, providing clear trading signals with integrated alert functionality.
Key Features
1. Multi-Timeframe Trend Lines
Automated Pivot Detection: Automatically identifies significant swing highs and lows based on user-defined left/right bar parameters
Smart Timeframe Adaptation: Uses different sensitivity settings for each timeframe (15min to 1Week) for optimal pivot detection
Dynamic Line Projection: Draws trend lines connecting the two most recent pivots and extends them forward
Flexible Source Selection: Choose between Close price, Wick extremes, or Auto mode (Auto uses Wick for higher timeframes, Close for lower timeframes)
2. Advanced OB/OS Detection System
Dual Indicator Confirmation: Combines CCI momentum and Bollinger Band position for reliable signals
Customizable Parameters: Adjustable CCI length, OB/OS thresholds, and Bollinger Band settings
Bar Confirmation Option: Optional wait-for-close confirmation to avoid false signals
Visual Markers: Clear triangle markers above/below bars for quick signal identification
3. Timeframe Support
Available Timeframes: 15min, 30min, 1h, 2h, 4h, 8h, 12h, 1D, 1W
Independent Settings: Custom left/right bar parameters for each timeframe
Automatic Adaptation: Script automatically applies the correct settings for your current chart timeframe
Input Parameters
Trend Lines Configuration
Left/Right Bars: Defines the pivot detection sensitivity for each timeframe
Line Length: Controls how far trend lines extend into the future
Line Source: Choose between Close, Wick, or Auto selection
Colors: Customizable support/resistance line colors
OB/OS Signal Settings
CCI Parameters: Length and OB/OS thresholds
Bollinger Bands: Length and multiplier for band width
Plot Options: Toggle OB markers and bar confirmation
Signal Logic
OB UP Signal (Short Bias)
Conditions: CCI ≥ OB threshold AND Close ≥ Upper Bollinger Band
Marker: Red triangle down above bar
Alert Direction: SHORT
OB DOWN Signal (Long Bias)
Conditions: CCI ≤ OS threshold AND Close ≤ Lower Bollinger Band
Marker: Green triangle up below bar
Alert Direction: LONG
Alert System
The script includes pre-formatted JSON alerts for external integration:
Structured data format with symbol, timeframe, direction, and signal type
Secret key for authentication (replace "MY_SECRET" with your actual key)
Compatible with webhook services and custom alert handlers
Usage Tips
Timeframe Selection: Use higher timeframes (4H-Daily) for major levels, lower timeframes for precise entries
Parameter Tuning: Adjust left/right bars based on market volatility - increase for smoother trends, decrease for more reactive lines
Confirmation: Combine trend line breaks with OB/OS signals for high-probability setups
Risk Management: Always use proper stop losses - trend lines indicate potential areas, not guaranteed reversals
Technical Notes
Built with Pine Script v6
Maximum 200 lines/labels to maintain performance
Works on all asset types (forex, stocks, crypto)
Optimized for real-time and historical analysis
This script provides institutional-grade trend analysis with retail-friendly signals, making complex multi-timeframe analysis accessible to traders of all experience levels.
This description covers all the technical aspects while being accessible for users.

KC-BB Squeeze Trend Trader█ OVERVIEW
The KC-BB Squeeze Trend Trader identifies volatility compression and expansion by detecting when Bollinger Bands contract inside Keltner Channels and then release with confirmed momentum. It highlights potential trend-starting breakouts by combining squeeze detection, directional momentum, trend bias, and optional volume filters.
During periods of low volatility, price consolidates and energy builds. When volatility expands again, strong directional moves often follow. This tool helps traders spot those opportunities early with clear visual cues and optional performance tracking.
█ KEY FEATURES
Squeeze detection using Bollinger Bands inside Keltner Channels
Automatic identification of volatility expansion after the squeeze ends
Optional filters for momentum, trend direction, volume, and signal cooldown
Dynamic color fills for squeeze, bullish expansion, bearish expansion, and neutral states
Dashboard showing squeeze duration, tightness, momentum, trend, and volume context
Optional win-rate analytics using ATR-based target and stop evaluation
Multi-timeframe confirmation for higher-quality breakouts
█ HOW IT WORKS
A squeeze occurs when both Bollinger Bands sit inside the Keltner Channels.
A breakout begins when the Bollinger Bands expand outside the KCs.
Long signals appear when squeeze release aligns with bullish momentum and trend strength.
Short signals appear when bearish momentum and trend conditions agree.
Volume and cooldown filters help reduce noise and avoid low-quality entries.
█ HOW TO USE
Wait for a squeeze period (yellow fill).
Monitor duration and tightness: longer/tighter squeezes often lead to stronger moves.
When a long or short signal appears, use the plotted ATR-based target and stop as reference levels.
Watch for contraction or exit hints when momentum fades or volatility narrows again.
Higher timeframes generally provide cleaner and more reliable signals.
█ TIMEFRAME GUIDANCE
Crypto: 4H or 1D; consider increasing KC multiplier for high volatility.
Forex: 1H–4H; longer squeeze duration can improve selectivity.
Stocks: 1D–1W; consider slightly higher BB multiplier on slow-moving markets.
█ SETTINGS SUMMARY
Adjustable Bollinger Band and Keltner Channel lengths and multipliers
Three momentum modes: Linear Regression, Price–SMA, or ROC
Trend and volume filters (optional)
Configurable minimum squeeze duration and signal cooldown
ATR-based target and stop multipliers
Optional historically tight squeeze filter (percentile-based)
█ ALERTS
Squeeze Detected
Squeeze Released
Long Entry
Short Entry
Exit Hint
Historically Tight Squeeze
█ NOTES
ATR-based win-rate calculations provide simplified performance estimates.
Past behavior does not guarantee future movement.
Use position sizing and risk management appropriate for the instrument and timeframe.
█ CREDITS
Inspired by the Bollinger Band and Keltner Channel squeeze concept popularized by John Carter’s TTM Squeeze, with added enhancements for squeeze strength, filtering, and real-time performance metrics.

Z-Score IndicatorA Z-Score measures how many standard deviations a value is from its mean.
In finance, it indicates how far the current price is from its historical average in statistical terms.
Practically speaking, the Z-Score quantifies price anomalies and serves as the statistical foundation behind mean-reversion strategies and dispersion analysis (pairs trading, Z-bands, etc.).
±1σ: normal movement.
±2σ: moderate overextension.
±3σ: statistically extreme event (≈ 0.3% probability under a normal distribution).


SuperMegaIndicator5000SuperMegaIndicator5000
key levels
ema
volume on price High Vol LowV and chop on price
London open close
vwap
orb
and maybe a couple other indicators

Semi-Martingala Sicura 1.20x PROIncrements or a maximum amount of 200. If the previous trade is profitable, the count is reset and the initial amount is resumed. Exit management uses fixed percentage stop loss and take profit, set relative to the entry price. In summary, this strategy aims to capitalize on trend and momentum signals, using a semi-martingale system to increase positions in case of losses, but with precise limits to contain risk. Note: This method aims to be "safer" than a classic martingale, respecting increment limits and a maximum amount.
Comment by saying what you think and what I could change.

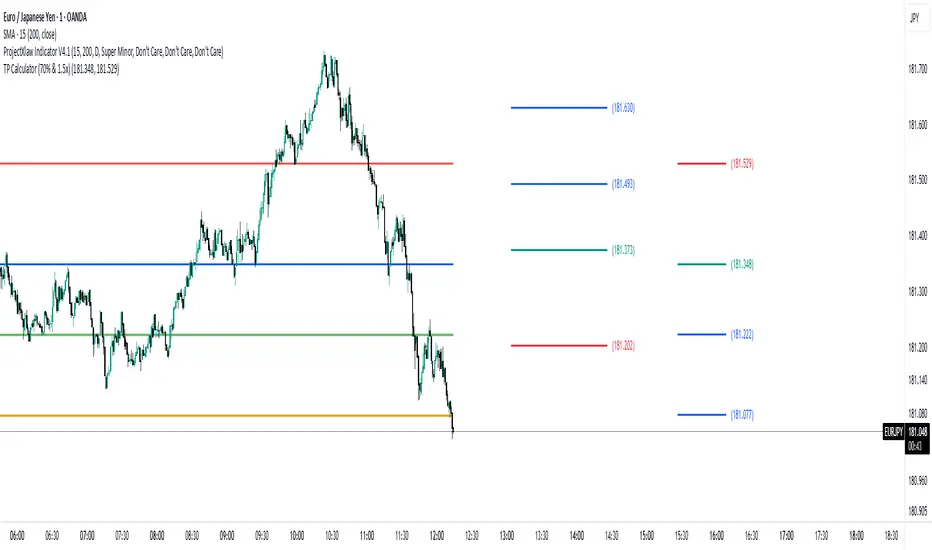
Fibonacci Set-upThe indicator plots Fibonacci retracements based on recent lows and highs.
Additionally it calculates position size, max leverage, max drawdown and pricelevels.
SwiftTrend█ OVERVIEW
SwiftTrend is a trend-following indicator inspired by the classic SuperTrend, but built on a completely different calculation method — using the average candle body size and the body midpoint (bodyMid). It reacts very dynamically to changes in momentum strength. The indicator is clean, easy to read, and perfect for traders who want fast yet confirmed trend direction. By adjusting the settings, you can make signals extremely sensitive or, conversely, reduce their frequency to almost completely eliminate trend flips on minor price moves.
█ CONCEPT
The indicator was created to strike the perfect balance between signal speed and effective noise filtering.
Instead of using classic ATR and price extremes (high/low), SwiftTrend uses the average candle body size and the midpoint of the previous candle’s body as its core reference. The dynamic trend line (avgLine) is protected by a tolerance zone – the trend only changes after price closes beyond this zone. This approach delivers significantly faster reaction times than many traditional solutions while maintaining excellent resistance to false signals during ranging markets.
█ FEATURES
Data source:
- Average candle body size: SMA(|open – close|, period)
- Reference point: midpoint of the previous candle’s body (bodyMid )
Dynamic trend line (avgLine):
- Built using Band Multiplier
- The line is “attracted” toward price movement
Tolerance zone (margin):
- Tolerance = Tolerance Multiplier × avgBody
- Default: 2.5 (for both band and tolerance)
Trend change logic:
- Down → Up: close > avgLine + tolerance
- Up → Down: close < avgLine – tolerance
Visual signals:
- “Buy” label (green upward arrow) and “Sell” label (red downward arrow) only on confirmed trend change
- Optional soft gradient fill between trend line and price
- Optional bar coloring based on current trend
- Trend line with breaks at reversal points
Alerts:
- Buy alert – triggers only when the closing price crosses from below to above the marginLineBase
- Sell alert – triggers only when the closing price crosses from above to below the marginLineBase
█ HOW TO USE
Add to chart → paste the code in Pine Editor or search for “SwiftTrend”.
Main settings:
- Average Body Periods → default 100
- Band Multiplier → default 2.5
- Tolerance Multiplier → default 2.5 (key sensitivity parameter)
- Colors, fill, and bar coloring – fully customizable
Interpretation:
- Green line & shading = uptrend
- Red line & shading = downtrend
- Higher Tolerance Multiplier = fewer but higher-quality signals
- Tolerance Multiplier near 0 = ultra-fast signals (aggressive mode)
█ APPLICATIONS
Excellent for:
- Trend-following (enter with trend, exit on reversal)
- Breakout and momentum strategies
- Filtering consolidation and noise – thanks to the adjustable tolerance zone
Best combined with:
- Classic support/resistance levels
- Fibonacci retracements, Pivot Points, psychological round numbers
- Confirmation from oscillators (RSI, Stochastic, MACD)
- Volume or volume profile analysis
Style adaptation:
- Scalping / daytrading → lower Tolerance Multiplier (0.8–1.8) + shorter period
- Swing / position trading → higher values (2.5–5.0) + longer period
█ NOTES
- Works on all markets and timeframes
- Success depends on matching the Tolerance Multiplier to your strategy and the instrument’s volatility
- Higher multiplier & period values = fewer signals, significantly higher quality
- At Tolerance Multiplier = 0 the indicator becomes extremely responsive – perfect for aggressive momentum trading

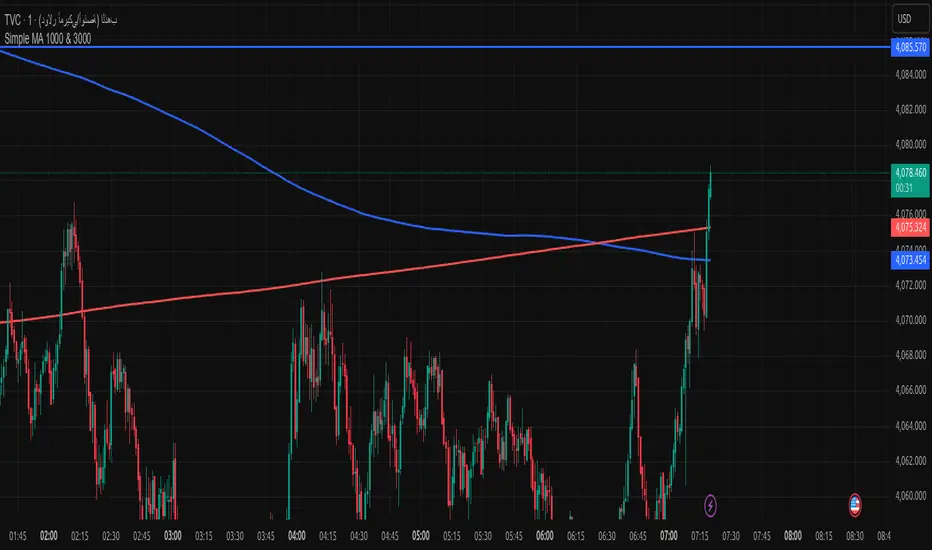
Simple MA 1000 & 3000when toche moving address add buy if from high or sell if from donw with sl 20pip
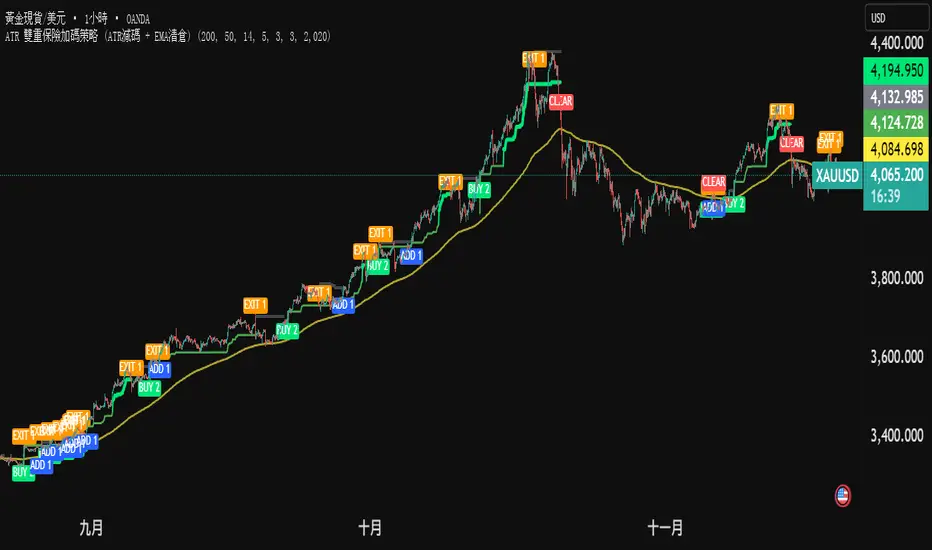
ATR 雙重保險加碼策略 (ATR減碼 + EMA清倉) (三寶爸黃金版)黃金雙保險戰法 (兩口單策略)
核心概念: 進場買兩口。一口賺了就跑(保本),一口死抱到底(拚大賺)。
1. 進場 (買 2 口):
只要價格站上黃線,而且突破前高。
別猶豫,直接買 2 口。
2. 減碼 (賣 1 口):
價格回檔碰到綠線。
代表短線轉弱,先賣掉 1 口。
好處: 錢先放口袋,心裡踏實。
3. 加碼 (買回 1 口):
如果你手上只剩 1 口,結果行情沒死,又創新高。
代表剛才賣錯了,趕快買回 1 口 (補回滿倉)。
好處: 繼續跟著趨勢賺錢。
4. 清倉 (全跑):
價格跌破黃線。
代表趨勢真的結束了,不管剩幾口,全部賣掉。
一句話總結: 「震盪時先賣一半保命,趨勢噴出時永遠滿倉在車上。」
Gold Dual-Insurance Tactic (2-Lot System)
Core Concept: Enter with 2 lots. Sell one early to lock in profits (Play Safe), and hold the other to catch the big wave (Go Big).
1. Entry (Buy 2 Lots):
When price is above the Yellow Line AND breaks the previous High.
Don't hesitate. Buy 2 lots immediately.
2. Scale Out (Sell 1 Lot):
When price pulls back and hits the Green Line.
This means short-term weakness. Sell 1 lot.
Benefit: Put money in your pocket. Peace of mind.
3. Add Position (Buy Back 1 Lot):
If you have only 1 lot left, but the market hits a New High.
It means the trend is alive. Quickly Buy back 1 lot (refill to full position).
Benefit: Continue maximizing profits with the trend.
4. Clear All (Exit Everything):
When price falls below the Yellow Line.
The trend is officially over. Sell everything, no matter what.
Global M2 Money Supply (100+ countries, USD, Offset)Global M2 Money Supply:
-potentially 100+ countries - countries can be added in Script,
-USD, Offset
-offset in months can be manually adjusted to account for the time that i takes for liquidity to hit the market

VWAP-EMA Ribbon by BucksTRDR📊 VWAP-EMA Ribbon by BucksTRDR
A comprehensive trend and momentum indicator combining 5 Exponential Moving Averages with dual VWAP levels (Session & Weekly) for multi-timeframe analysis.
🎯 KEY FEATURES
Five Exponential Moving Averages: • EMA 5 (Aqua) - Fast-moving, immediate price action • EMA 9 (Lime) - Short-term trend • EMA 21 (Yellow) - Medium-term trend • EMA 50 (Orange) - Key support/resistance • EMA 200 (Red) - Long-term trend baseline
Dual VWAP Analysis: • Session VWAP (Blue) - Resets daily, tracks institutional intraday levels • Weekly VWAP (Fuchsia) - Resets weekly, identifies longer-term value areas
Visual Design: • Bold VWAP lines (4px width) for clear reference levels • Color-coded EMAs (2px width) for easy identification • Clean, professional chart layout
📈 HOW TO USE
Trend Identification: ✓ Price above all EMAs + above VWAP = Strong uptrend ✓ Price below all EMAs + below VWAP = Strong downtrend ✓ EMAs fanning out = Momentum increasing ✓ EMAs converging = Potential trend reversal
Support & Resistance: ✓ Watch for bounces off individual EMAs ✓ VWAP acts as magnetic institutional level ✓ 200 EMA frequently serves as major support/resistance
Entry Signals: ✓ Pullbacks to 21 EMA in trending markets ✓ Price reclaiming VWAP after being below ✓ Faster EMA crossing above slower EMA ✓ Confluence of multiple EMAs at same level
Exit Signals: ✓ Price breaking below key EMAs ✓ Loss of VWAP support/resistance ✓ Death cross (50 EMA crossing below 200 EMA)
⚙️ CUSTOMIZATION
Fully Adjustable Settings: • All EMA lengths can be changed • All colors are customizable (EMAs + VWAPs) • Line widths adjustable • Individual on/off toggles for each indicator • Organized input groups for easy navigation
💡 BEST PRACTICES
Recommended Timeframes: • 5-minute charts for day trading • 15-minute for scalping and day trading • 1-hour for swing trading • Daily for position trading
Market Conditions: • Excellent for trending markets • Use caution in choppy/sideways conditions • Works on stocks, forex, crypto, indices, futures
Complementary Tools: • Combine with volume analysis • Add RSI for overbought/oversold confirmation • Use with candlestick patterns • Check multiple timeframes for confluence
🔍 WHAT MAKES THIS DIFFERENT
Unlike standard single EMA or VWAP indicators, this ribbon approach provides:
Multi-layered analysis - See short, medium, and long-term trends simultaneously
Volume-weighted context - VWAP shows institutional positioning
Clean visualization - All key moving averages in one organized display
Maximum flexibility - Adapt to any trading style or timeframe
📊 TRADING EXAMPLES
Bullish Setup: Price crosses above 21 EMA → bounces off 50 EMA → all EMAs slope upward → VWAP acting as support = Strong buy signal
Bearish Setup: Price crosses below 21 EMA → rejects at 50 EMA → all EMAs slope downward → VWAP acting as resistance = Strong sell signal
Reversal Signal: Price below all EMAs → reclaims 21 EMA → then 50 EMA → crosses above VWAP = Potential trend reversal
⚠️ DISCLAIMER
This indicator is provided "as is" for educational purposes only. BucksTRDR is not responsible for trading decisions made using this tool. Always conduct your own research and consult a financial professional before making investment decisions. Past performance does not guarantee future results.

Multi-Timeframe Stochastic (4x) z Podświetlaniem - PawelA script that provides information when most of the stocks are in the overbought or oversold zone.

Multi-Timeframe RSI (4x) z Podświetlaniem - PawełRSI z podświetleniem z różnych tfów z ustawianiem intensywnosci i kolorów.

Crypto Schlingel - PVSRA POC EMA Suite v5.903The Chart Indicator Suite combines a wide range of powerful tools that help traders accurately analyze market structures, volatility, and key price zones. With indicators such as POC, pivot points, EMAs, VWAP, Bollinger Bands, and important market levels such as yesterday/weekly high & low, daily open, psy high/low, and ADR, the suite offers a comprehensive overview of trends and market behavior. Supplemented by pvsra candles, long candle detection, and the display of relevant stock market opening hours, it reliably supports traders in making informed trading decisions.
Indicators are configurable
All of the indicators mentioned are fully configurable and can be flexibly adapted to individual trading strategies. Users can freely adjust parameters, display types, and sensitivities to highlight exactly the market information that is relevant to their personal trading style.
The individual fields in the configuration are self-explanatory or are explained in a toolbar, so that the possible settings become clear.
POC
The Point of Control (POC) is a central concept in market profile and volume profile analysis and plays an important role in technical chart analysis. Here is a detailed description of its usefulness and significance:
Definition
The point of control (POC) is the price level at which the most trading volume has taken place within a certain period of time.
It therefore shows the price at which buyers and sellers were most active – the center of market interest.
📊 Use and significance in chart analysis
1. Central support and resistance zone
Since the largest volume was traded at the POC, this price is considered a “fair zone” or equilibrium price.
The market often reacts strongly to the POC:
Above the POC → potential resistance if the price is coming from below.
Below the POC → potential support if the price is falling from above.
Example: If the price returns to the POC, this can be an entry opportunity for traders betting on a market reaction.
2. Interpretation of market acceptance
A price range with high volume (including POC) shows where the market has accepted a fair value.
Low volume, on the other hand, indicates rejection or disinterest.
→ The POC therefore helps to distinguish between accepted price zones and transition areas.
PIVOT POINTS
Pivot points are predefined price levels calculated from the previous day's price data (or a previous time unit).
They help traders identify potential support and resistance zones for the current trading day (or period).
Benefits of pivot points in chart analysis
1. Determining support and resistance areas
The calculated pivot levels (P, S1, S2, R1, R2, etc.) show where the market is likely to react:
Supports (S1, S2, S3) → possible downward turning points.
Resistance (R1, R2, R3) → possible upward turning points.
These zones are often observed by many traders at the same time, making them self-fulfilling marks.
2. Trend determination and market sentiment
If the market opens above the pivot (P) and remains there → signals buying pressure.
If the market trades below the pivot (P) → signals selling pressure.
A break above R1 or below S1 may indicate a strong trend day.
EMA Exponential Moving Average
The EMA is the exponentially weighted moving average of a price.
It shows the average price of a security over a certain period of time, weighted according to recency – that is:
👉 more recent price data has more influence than older data.
This distinguishes it from the simple moving average (SMA), in which all values are weighted equally.
Benefits of the EMA in chart analysis -> Identifying trends
The EMA reacts more quickly to price changes than the SMA and is therefore ideal for:
Identifying trend reversals at an early stage
Confirming trend directions
👉 Rising EMA → Upward trend
👉 Falling EMA → Downward trend
Traders often use combinations such as:
EMA 50 / EMA 200 → Long-term trends
SIGNIFICANCE OF HIGHS AND LOWS
The daily high, daily low, weekly high, and weekly low are objective price zones that show:
Where the market bought (high) or sold (low) the most, and where supply and demand reached their extremes in the past period.
These levels often act as magnetic price zones in ongoing trading, where traders react (entry, profit-taking, or stop setting).
🎯 Use of yesterday's high and low (previous day high/low)
🔹Support and resistance levels
Yesterday's high often acts as resistance when the price comes from below.
Yesterday's low becomes support when the price falls from above.
➡️ Traders watch these levels closely to trade breakouts or reversals.
EMA 9 / EMA 20 → Short-term movements
🎯 Benefits of weekly highs and lows (Weekly High/Low)
Important structural markers in the higher time frame
Weekly highs and lows show medium to long-term market structure.
They are often considered stronger supports/resistances than daily levels.
➡️ For example, if the price breaks above the weekly high, this usually signals institutional interest and may indicate a continuation of the trend.
➡️ Conversely, failure to break above a weekly high may indicate market weakness or a reversal.
DAILY OPEN
The Daily Open is the price at which trading begins on a new day.
It marks the first price after the close of the previous trading session.
👉 In many markets (e.g., Forex, index futures, crypto), this is the starting point of daily price movement, where market direction and sentiment realign.
🎯 Benefits of the Daily Open in chart analysis
Direction indicator (daily bias)
The Daily Open serves as a neutral center line for the current trading day.
Traders use it to assess the market direction (bias):
Price above the Daily Open → bullish day (buyers dominate)
Price below the daily open → bearish day (sellers dominate)
📈 → If the daily open is broken and held above, this indicates upward momentum.
📉 → If it is broken below, this signals weakness.
This simple observation helps traders trade with the daily trend rather than against it.
STOCK MARKET OPENING HOURS
Every major stock exchange has defined trading hours during which institutional capital is active.
Examples (CET):
Asia (Tokyo/ Hong Kong) 1:00 a.m. – 9:00 a.m.
Europe (London/Frankfurt) 08:00 – 17:30
USA (New York) 15:30 – 22:00
Market dynamics change significantly during these time windows, as volume, liquidity, and volatility fluctuate depending on the session.
📈 Benefits in chart analysis
🔹Recognizing volatility and liquidity phases
At the start of a session (e.g., 9:00 a.m. in Frankfurt or 3:30 p.m. in New York), trading volume rises sharply.
This results in strong movements, often with changes in direction or breakouts.
👉 These phases are particularly suitable for:
Breakout strategies
Volume or momentum trades
Example:
If an index (e.g., DAX or S&P 500) reacts strongly at the US opening, this indicates institutional activity that may shape the rest of the day.
PSY HIGH AND PSY LOW
Psy High and Psy Low stand for:
Psychological High → the psychologically significant upper price level of a particular range
Psychological Low → the psychologically significant lower price level
These are often round numbers or striking price zones that market participants unconsciously use as a guide.
Examples:
For EUR/USD: 1.0500, 1.1000, 1.1500
For DAX: 17,000, 17,500, 18,000
For BTC/USD: 60,000, 65,000, 70,000
Traders also refer to such levels as “big figures” or “round numbers.”
📊 Why are psy levels so important?
Because they are based on human perception and market psychology:
👉 People think in round numbers, not in decimals such as 1.1037 or 17.264.
That's why:
Private investors often place their stop losses or take profits just above or below these levels, Institutional traders place large limit orders in these zones, and Algorithms react to the liquidity created there.
→ This results in increased volume, reaction patterns, and price movements at these levels.
ADR (Average Daily Range)
The ADR measures the average daily trading range of a market over a specific period of time – i.e., how many points, pips, or dollars the price typically moves per day.
Example:
If the DAX has moved an average of 180 points per day over the last 14 days, the ADR(14) = 180.
🎯 The benefits of ADR in chart analysis
🔹 Assessment of daily volatility
The ADR shows how much a market typically moves per day.
→ This allows you to see whether the current day is more volatile or calmer than normal.
Interpretation – Meaning
Current range < ADR
→ Market is still moving within normal limits → Potential for further movement
Current range ≈ ADR
→ Daily target largely achieved → lower probability of significant expansion
Current range > ADR
→ Market overextended → increased probability of correction or consolidation
👉 This helps you to plan entries, price targets, and stops realistically.
VWAP (Volume Weighted Average Price)
The VWAP is the volume-weighted average price of a security for a specific period of time – usually per day.
👉 Unlike a simple moving average (e.g., EMA), the VWAP takes into account how much was actually traded – not just where the price was.
It therefore reflects the fair market value, taking into account the trading volume.
🎯 Benefits of VWAP in chart analysis
🔹 Determining the fair average price
The VWAP shows where the majority of the trading volume took place – i.e., the price that the majority of market participants actually paid.
➡️ This is the “fair price of the day.”
Price above VWAP → buyers dominate (bullish)
Price below VWAP → sellers dominate (bearish)
This information is particularly valuable for determining the intraday bias (direction of the day).
BOLLINGER BANDS
Bollinger Bands consist of three lines based on a moving average (usually SMA 20):
Middle band:
→ usually the 20-period SMA (simple moving average)
Upper band:
→ SMA + (2 × standard deviation)
Lower band:
→ SMA − (2 × standard deviation)
👉 This means that the bands “breathe” with volatility – they widen when the market is volatile and contract when the market is calm.
🎯 The benefits of Bollinger Bands in chart analysis
🔹 Measuring market volatility
The main function of Bollinger Bands is to visualize the volatility of a market:
Wide bands → high volatility → strong movement/trend phase
Narrow bands → low volatility → calm market/consolidation
📈 When the bands contract sharply (“Bollinger squeeze”) → often a harbinger of an impending breakout.
KAMA
The KAMA was developed by Perry J. Kaufman.
Unlike normal moving averages such as SMA or EMA, it dynamically adjusts its smoothing to market conditions:
Low volatility / strong trend → reacts faster to price movements
High volatility / sideways movement → reacts slower, reduces false signals
The core idea: adaptability instead of rigid smoothing.
🎯 Benefits of KAMA in chart analysis
🔹 Filtering out market noise
KAMA smooths out unnecessary price fluctuations (noise) that many normal indicators mistakenly interpret as signals.
➡️ This minimizes false signals in sideways phases, while real trends remain visible.
EXTRA LARGE WICKS
A wick (or wick) is the thin line above or below the candle body:
Top → Highest price during the period
Bottom → Lowest price during the period
Long wick → Significant rejection of the price at this extreme zone
Example: A long upper wick means that the price rose high but was then pushed back sharply.
🎯 Benefits of long wicks in chart analysis
🔹 Recognizing rejections and resistance
Long upper wick: Sellers did not allow the higher price → possible downward reversal
Long lower wick: Buyers defended the lower price → possible upward reversal
💡 The market “speaks” through these wicks: It shows where buyers or sellers are not giving in any further.

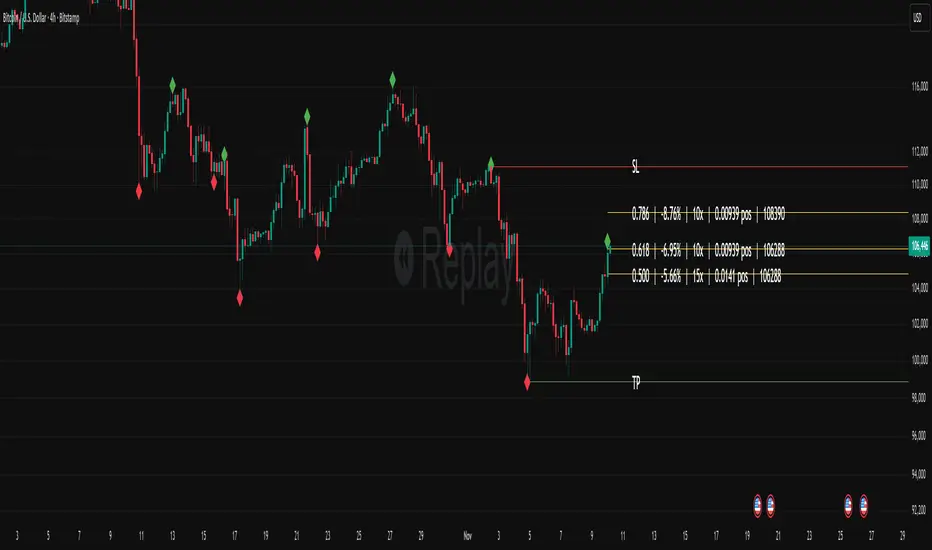
TP Calculator (70% & 1.5x)//@version=5
indicator("TP Calculator (70% & 1.5x)", overlay=true)
// -------- Inputs --------
entry = input.float(100.0, "Entry Price")
stoploss = input.float(90.0, "Stop Loss")
// -------- Determine Direction --------
// اگر SL پایینتر بود = پوزیشن Long
// اگر SL بالاتر بود = پوزیشن Short
isLong = stoploss < entry ? true : false
// -------- Calculations --------
distance = math.abs(entry - stoploss)
// جهت پوزیشن (بالا یا پایین TP میرود)
direction = isLong ? 1 : -1
tp1 = entry + direction * (distance * 0.70) // 70%
tp2 = entry + direction * (distance * 1.50) // 1.5x
// -------- Plot Levels --------
plot(entry, "Entry", color=color.blue, linewidth=2)
plot(stoploss, "Stop Loss", color=color.red, linewidth=2)
plot(tp1, "TP1 (70%)", color=color.green, linewidth=2)
plot(tp2, "TP2 (1.5x)", color=color.orange, linewidth=2)
CCI ±100 Price Deviation with SMA & VWAP Trend ColorIndicator Synopsis: CCI ±100 Price Deviation with SMA & VWAP
Purpose:
This indicator combines trend filtering, momentum smoothing, and dynamic price bands to help identify intraday trading opportunities. It’s designed for:
15-minute chart → trend identification
1–2 minute chart → precise entries based on dynamic bands
Components:
SMA of Typical Price (smaTP)
Smooth average of the current bar’s typical price (hlc3).
Acts as a dynamic midpoint for the ±100 deviation bands.
±100 Deviation Bands
Calculated using a modified CCI formula:
Upper = SMA TP + 0.015 × MAD × 100
Lower = SMA TP - 0.015 × MAD × 100
Works as dynamic support/resistance and potential reversal zones.
SMA of CCI length (scaled to price)
Smooths the CCI momentum signal to the price scale.
Acts as a confirmation filter for trade direction near bands.
Optional toggle and customizable color/line width.
VWAP (Volume Weighted Average Price)
Optional overlay with trend-based coloring:
Price above VWAP → bullish → green
Price below VWAP → bearish → red
Acts as primary trend filter.
How to Use the Indicator
Step 1: Determine Trend (15-minute chart)
Check VWAP trend:
Price > VWAP → bullish trend → only consider long trades
Price < VWAP → bearish trend → only consider short trades
Confirm with SMA TP slope:
Rising SMA → bullish bias
Falling SMA → bearish bias
This ensures you only trade in the direction of the intraday trend.
