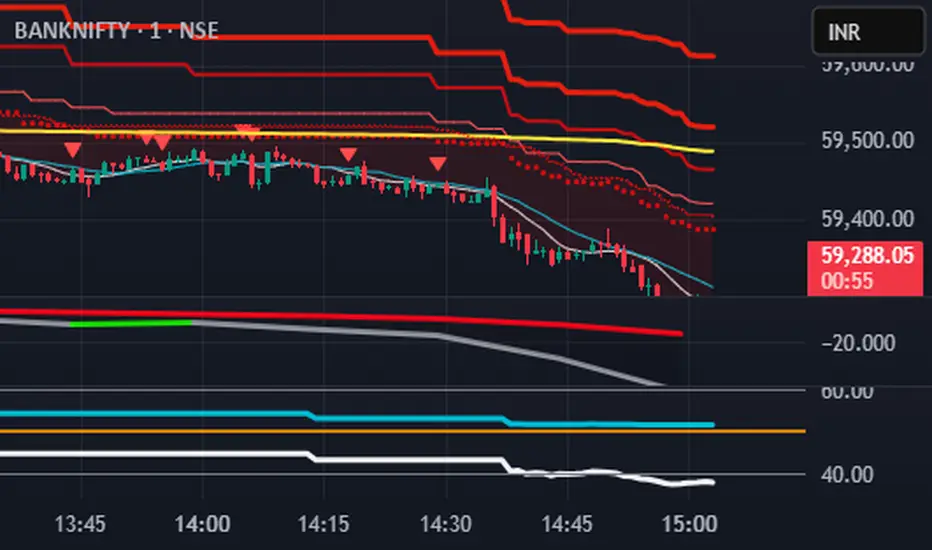
Dual TF Bearish Divergence (Working)//@version=6
indicator("Dual TF Bearish Divergence (Working)", overlay=true)
// ----------------- SIMPLE BEARISH DIVERGENCE FUNCTION -------------------
bearDiv(src, rsiLen, lookbackMin, lookbackMax) =>
r = ta.rsi(src, rsiLen)
ph = ta.pivothigh(src, lookbackMin, lookbackMin)
ph_rsi = ta.pivothigh(r, lookbackMin, lookbackMin)
ph2 = ph
ph2_rsi = ph_rsi
priceHH = not na(ph) and not na(ph2) and ph > ph2
rsiLH = not na(ph_rsi) and not na(ph2_rsi) and ph_rsi < ph2_rsi
barsOk = lookbackMin >= lookbackMin and lookbackMin <= lookbackMax
priceHH and rsiLH and barsOk
// ----------------- TF CALLS -------------------
b60 = request.security(syminfo.tickerid, "60", bearDiv(close, 14, 10, 15))
b240 = request.security(syminfo.tickerid, "240", bearDiv(close, 14, 10, 15))
dual = b60 and b240
// ----------------- PLOT -------------------
plotshape(dual, title="Dual Bear Div", style=shape.labeldown,
color=color.red, size=size.small, text="🔻BearDiv")
// ----------------- ALERT -------------------
alertcondition(dual, "Dual Bearish Div 60+240",
"Bearish Divergence on both 60m & 240m")
Bands and Channels

XAUUSD ULTIMATE+BB 🥇 [GOLD OPTIMIZED]🥇 XAUUSD ULTIMATE 100% - Best Gold Indicator
The most complete trading system for GOLD (XAUUSD) - 20+ indicators in ONE tool!
🔥 WHAT YOU GET:
✅ COMPLETE TRADING SYSTEM
- Buy/Sell signals with 0-100% confidence score
- Automatic SL/TP levels (optimized for gold)
- Real-time profit tracking in $ and %
- Clean visual interface with live dashboard
✅ POWERFUL FEATURES
- 📊 Bollinger Bands - Full visualization
- 📈 SuperTrend - Dynamic trend line
- 🎯 Divergence Detection - Early reversals
- 🕯️ Candlestick Patterns - Hammer, Engulfing, etc
- 💎 Order Blocks - Smart Money levels
- 🕐 Session Lines - London/NY high volatility periods
✅ SMART SIGNAL SYSTEM
- Multi-indicator confirmation (EMAs, RSI, MACD, Stochastic, ADX)
- Fast Entry Mode - Catches early moves
- Aggressive Mode - More signals
- Volume confirmation included
- Psychological levels ($50 increments)
✅ EASY TO USE
1. Add to XAUUSD chart
2. Adjust sensitivity (1-10)
3. Wait for BUY/SELL arrows
4. Follow displayed SL/TP levels
✅ ALERTS INCLUDED
- Buy/Sell signals
- Divergence alerts
- Profit targets (0.15%, 0.30%)
- Bollinger Band extremes
🎯 BEST FOR:
- Gold scalping (M5-M15)
- Day trading (M15-H1)
- All experience levels
⚙️ FULLY CUSTOMIZABLE
- Adjustable sensitivity
- Show/hide any feature
- Custom SL/TP multipliers
- Choose your trading style
💡 WHY IT'S THE BEST:
- Gold-specific optimization
- 20+ indicators working together
- Professional-grade accuracy
- Clean, easy-to-read interface
- Works in all market conditions

Custom MTF VWAP 5x This is a combination of all VWAPs I use to find high probability trade setups and targets by only taking trades when different VWAPs align

My Multiple MA-BandsRelease Notes
MY-BAND – Adaptive Moving Average Channel Indicator
MY-BAND is a customizable Moving Average Band / Channel indicator designed to help traders clearly visualize trend direction, dynamic support & resistance, and market structure on any timeframe.
This indicator builds adaptive price bands around Moving Averages, making it easier to identify:
Trend continuation
Trend reversal
Volatility expansion and contraction
Key breakout and pullback zones
It works perfectly for crypto, forex, and stock markets.
🔧 Key Features
Multi-Timeframe MA Bands
HiLo & LLMA Moving Average Types
Dynamic Channel Width
ZigZag Structure Detection
Average Center Line
Trend Bending Option
Support & Resistance Layer
Fully Adjustable Inputs
Works on All Timeframes
📊 How to Use
Trend Trading
Price above upper band → Strong bullish trend
Price below lower band → Strong bearish trend
Pullback Entries
Enter on pullback to middle MA in trend direction
Breakout Trading
Strong breakout outside the band signals continuation
Market Structure
ZigZag feature helps identify swing highs & lows
⚙️ Inputs Explanation
MA Timeframe (MA TF) – Select the timeframe for MA calculation
Length 1 & Length 2 – Fine-tune band sensitivity
MA Type – Choose between HiLo or LLMA
Width – Controls band distance
AVG Line – Show central average line
Zigzag – Display market structure swings
Extend – Extend channel into the future
Bending – Smooth adaptive band behavior
✅ Best For
Trend Followers
Scalpers
Swing Traders
Crypto Futures Traders
Breakout & Pullback Strategies
⚠️ Disclaimer
This indicator is for educational and analytical purposes only. It does not provide financial advice. Always use proper risk management and confirm signals with other indicators.

EMAs Cloud by LuigiTradezWhat you get now:
Beautiful EMA cloud with dynamic coloring
Regular Bullish/Bearish Divergence (big green/red triangles + "DIV")
Hidden Bullish/Bearish Divergence (smaller aqua/orange triangles + "H")
Fully customizable RSI length and lookback
Built-in alert conditions (you can create alerts in TradingView)

Multi-TF Harmonic + UT Bot + RSI Scanner [Final Fixed]Overview This indicator is an all-in-one dashboard designed to monitor 4 key timeframes (5m, 15m, 1H, 4H) simultaneously on a single chart. It seeks Confluence by combining the Counter-trend strategy of Harmonic Patterns with the Trend-following strategy of the UT Bot, backed by RSI momentum analysis.
Core Logic
Harmonic Patterns: Detects Gartley, Bat, Butterfly, Crab, Deep Crab, and Cypher patterns. It highlights when the price enters the Potential Reversal Zone (PRZ).
UT Bot: Identifies the current trend direction (Buy/Sell) using ATR Trailing Stop logic with Heikin Ashi smoothing.
RSI: Monitors Overbought (>70) and Oversold (<30) levels.
Signal Conditions
LONG ENTRY: Bullish Pattern + Price in PRZ + UT Bot Buy Trend.
SHORT ENTRY: Bearish Pattern + Price in PRZ + UT Bot Sell Trend.
WATCH: Price is in PRZ, but the trend has not yet aligned with the pattern direction.
How to Use Simply apply this indicator to any chart. The dashboard (default: Bottom Left) will display the status for 5m, 15m, 1H, and 4H timeframes without needing to switch charts.

Humontre Signal Channel — Free EditionHumontre Signal Channel is a clean, high-clarity trend and volatility tool designed to help traders identify directional bias, momentum shifts, and breakout conditions with minimal noise.
The Free Edition provides the core engine behind the Humontre system: dynamic EMA bands, adaptive trend coloring, and precise LONG / SHORT signals.
Whether you trade Crypto, Forex, Indices or Stocks , the Signal Channel keeps you aligned with market structure in a simple and intuitive way.
🔍 How It Works
1. Dynamic EMA Channel
A fast-reacting EMA forms the core of the system. The channel boundaries can be calculated using:
ATR × Multiplier (recommended)
Percentage mode (alternative for low-volatility markets)
This creates a flexible volatility envelope that naturally highlights trend strength and momentum expansion.
2. Adaptive Trend Coloring
The EMA automatically shifts colors:
Green → bullish pressure
Red → bearish pressure
Clear, objective trend visualization without interpretation.
3. Long & Short Signals
Signals appear when price closes outside the band:
LONG → Close crosses above the upper band
SHORT → Close crosses below the lower band
Repeated signals in the same direction are filtered for cleaner momentum confirmation.
4. Multi-Market Ready
Works on all markets and timeframes:
Crypto
Forex
Indices
Stocks
Commodities
🆓 Free Edition Includes
Dynamic EMA Channel
ATR or % Band Mode
Adaptive Trend Colors
Clean LONG / SHORT Signals
Basic Alerts
Minimal, unobtrusive chart visuals
Ideal for learning the Humontre system and spotting breakout opportunities.
⭐ Upgrade to the Pro Edition (Invite-Only)
The Humontre Signal Channel — Pro Edition unlocks advanced professional features:
Automatic SL & TP levels
Dynamic Risk-to-Reward box
SL/TP labels & smart line system
Live trade tracking
Full trade history table
UI & theme customization
Alerts for SL/TP hits
Much more coming…
If you’d like access, feel free to contact me.
📌 Disclaimer
This indicator is for educational purposes only and does not constitute financial advice. Always use proper risk management.

Forex indicator By petran Elevate your market analysis with this powerful, all-in-one visual toolkit designed for discretionary traders across Forex, indices, and commodities (metals).
Core Features:
Trading Sessions Overlay: Clear visual bands highlighting the Asian, London, and New York trading sessions directly on your chart. Never miss a market open or a session overlap again.
Smart Daily Levels: Automatically plots the most essential reference points from the previous day:
PDH / PDL (Previous Day High/Low) – Key support and resistance.
PWH / PWL (Previous Week High/Low) – Higher timeframe context.
DO (Day Open) – A crucial intraday pivot level.
Motivational Watermark: A unique and customizable text overlay at the top of your screen. Display your favorite trading quote, rule, or reminder to maintain the right mindset during the trading day.
Clean & Customizable: Designed for clarity. Adjust colors, session times, and watermark text to fit your personal trading style and chart aesthetics.
Why Traders Choose This Indicator:
Saves Time: No more manually drawing sessions or calculating yesterday's levels.
Improves Discipline: The visual sessions and watermark help you trade only during your planned times and follow your rules.
Universal Application: Works seamlessly on any liquid market where session activity and daily ranges matter.
Perfect for traders who rely on price action, session-based strategies, and need a clean, informative chart environment.

S.T. TREND INDICATORIt is TREND indicator. it has 8 supertrends which can be used for different higher time frame & with different atr & multiplier.which will give better idea of varius trend like long ,medium,short & immediate trend.it also has daily & weekly vwap. and two sma with adjustable length & timeframe. source used for calculation of supertrends is 1min HA candles.yyou can use it onnormal japnees candle also.
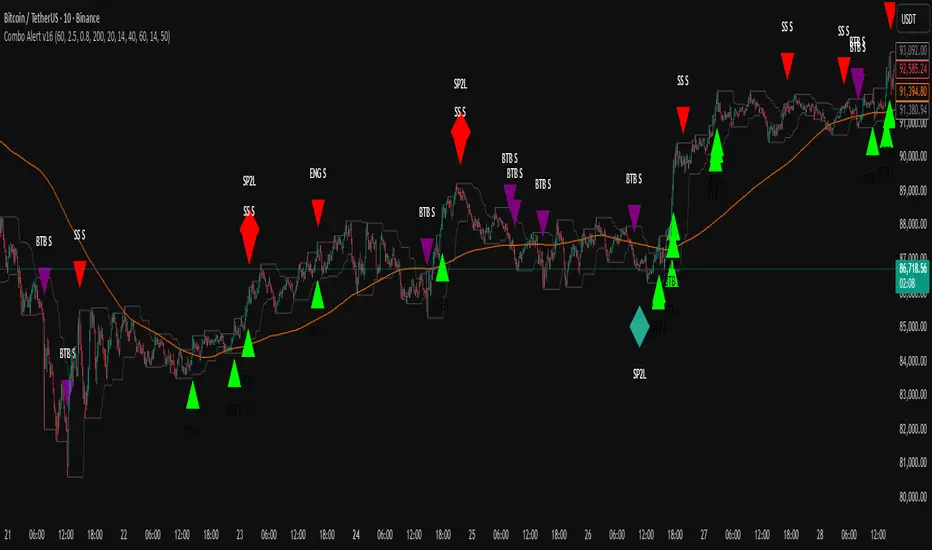
TWS + Engulfing + SP2L + BTB (RSI Focused)-by-shahriar📝 Final TradingView Script Description: Combo Alert v16 (Updated)
TWS + Engulfing + SP2L + BTB (RSI Focused) - Combo Alert v16
This script is a comprehensive, multi-component technical analysis tool designed to identify high-probability reversal and continuation patterns, focusing on strict filtering via Relative Strength Index (RSI) and Volume. It combines four distinct pattern types: Three White Soldiers (TWS), Engulfing Candles, Setup Price Action + 2-Candle Confirmation (SP2L), and Breakout Through Bands (BTB).
🔑 Core Logic and Signal Generation
The script utilizes a tiered filtering system. Here is a breakdown of the two most critical signals:
1. SP2L (Setup Price Action + 2-Candle Confirmation) - Reversal Focus
SP2L is designed to catch strong reversals after a clear setup phase.
• Setup: The first candle must be a strong reversal pattern (Hammer, Shooting Star, or Engulfing).
• Confirmation: The current candle must definitively break the previous candle's range:
o SP2L Buy: The current candle's Close price must exceed the High of the setup candle.
o SP2L Sell: The current candle's Close price must fall below the Low of the setup candle.
• Filter: This signal only fires when the RSI confirms an oversold (Buy) or overbought (Sell) condition.
2. BTB (Breakout Through Bands) - Trend Focus
BTB is a powerful trend-following signal.
• Breakout: The price must break out of the Donchian Channel (the highest high or lowest low over the past dcLength periods).
• Trend Filter: The breakout must align with the broader trend, meaning the Close price must be above the 200-period SMA for Buy signals (and below for Sell signals).
• Volume Filter: The breakout must be confirmed by high volatility, requiring the current Volume to exceed the Average Volume by the specified Multiplier.
⚙️. Full Customization and Sensitivity Control (Inputs)
The indicator provides granular control over all filtering mechanisms, allowing traders to adjust sensitivity and signal strength based on the asset and desired timeframe.
Input Name,Default,Code Variable,Adjustment Guide
Volume Multiplier (x Avg),2.5,volMult,"Controls Volume Sensitivity (BTB). Increase value for fewer, higher conviction signals."
Min Body Ratio (0.8 = 80%),0.8,minBodyRatio,Controls the required proportion of the candle body relative to its total range.
RSI Oversold Level,40,rsiOversold,Controls Reversal Sensitivity (Buy Filter). Lowering this value requires a deeper oversold condition.
RSI Overbought Level,60,rsiOverbought,Controls Reversal Sensitivity (Sell Filter). Raising this value requires a deeper overbought condition.
SMA Length (Trend Filter),200,smaLength,Period for the Moving Average used to define the overall market trend.
Donchian Channel Length (BTB),20,dcLength,Look-back period for the Donchian Channel breakout window.
⚙️.Users can manage which patterns are displayed by going to the Styles tab in the indicator settings and selectively enabling or disabling the plot visibility for each specific signal type. This allows you to focus only on the patterns that fit your specific strategy.
⚠️ Due Diligence and Risk Disclaimer
Prior to making any trading decisions, all users must conduct their own thorough research (Due Diligence). This indicator is a tool for confirmation and analysis, not a recommendation to buy or sell. All trades should be executed based on your personal knowledge, independent analysis, and established risk management framework.
ASI Momentum CloudASI Momentum Cloud (AMC) — a scaled Accumulative Swing Index (ASI) momentum indicator with an EMA cloud for visual trend context, signal smoothing, and configurable scaling for any instrument.
---
## Overview
The ASI Momentum Cloud visualizes ASI-based momentum while providing a three-EMA cloud that highlights trend bias and momentum strength. The indicator scales ASI values for better visibility across different instruments and adds an SMA signal line for entry/exit clarity. Designed for traders who want a momentum oscillator with trend context and simple alertable signals.
## Key features
* Scaled ASI value (`ASI Multiplier`) for improved chart readability.
* Configurable `Daily Limit` to adapt the ASI calculation to different asset volatilities.
* SMA signal line to smooth ASI and provide clear cross signals.
* Three-EMA cloud (Fast / Mid / Slow) to show bullish/bearish bias and momentum shifts.
* Lightweight, low-latency computation — suitable for multiple timeframes.
* Built-in cloud coloring: green tint when Fast EMA > Slow EMA, red tint otherwise.
## How it works (brief)
1. ASI is calculated each bar using price movement components (high/low/close relationships) and normalized by the `Daily Limit`.
2. `ASI Multiplier` scales the values for visual clarity.
3. A short SMA (`Period Length`) acts as the indicator’s signal/smoother.
4. Three EMAs (Fast / Mid / Slow) form a cloud — their relative positions determine the cloud color and trend bias.
## Inputs (as shown in settings)
* **Daily Limit** — numeric; adjusts ASI normalization (default: `10000`). Tune to instrument volatility.
* **ASI Multiplier** — numeric; scales the ASI for visibility (default: `100`).
* **Period Length** — SMA length for the signal line (default: `14`).
* **EMA Cloud Fast Length** — fast EMA (default: `7`).
* **EMA Cloud Mid Length** — middle EMA (default: `14`).
* **EMA Cloud Slow Length** — slow EMA (default: `28`).
## How to interpret signals
* **Bullish bias:** EMA Fast > EMA Slow → cloud green (favour long bias).
* **Bearish bias:** EMA Fast < EMA Slow → cloud red (favour short bias).
* **Momentum entry:** ASI line crossing **above** the Signal SMA — momentum turning positive.
* **Momentum exit / short entry:** ASI line crossing **below** the Signal SMA — momentum turning negative.
* **Confirmation:** Prefer entries that align with cloud bias (e.g., take long crossovers when cloud is green).
* **Divergence:** Watch for price making new highs/lows while ASI fails to confirm — possible momentum exhaustion.
## Suggested alert messages (copy/paste)
* `ASI Momentum Cloud — ASI crossed above Signal (potential buy)`
* `ASI Momentum Cloud — ASI crossed below Signal (potential sell)`
* `ASI Momentum Cloud — Cloud turned bullish (EMA Fast > EMA Slow)`
* `ASI Momentum Cloud — Cloud turned bearish (EMA Fast < EMA Slow)`
Use these messages in TradingView alert conditions tied to the corresponding cross or condition.
## Recommended usage & timeframes
* Works on any timeframe; commonly useful on 1H, 4H, Daily for trend-following, and lower timeframes for intra-day momentum signals.
* Adjust **Daily Limit** and **ASI Multiplier** for low-volatility instruments (smaller limit, higher multiplier) or high-volatility instruments (larger limit, lower multiplier).
* Combine with price action, support/resistance, or higher-timeframe trend for better signal quality.
## Notes & credits
* Version: 1.0 — initial release.
* If you adapt or redistribute, please credit the original script.
* Built for clarity and practical trading signals — tweak the input values to match your instrument and trading style.
## Risk disclaimer
This indicator is a technical tool and not investment advice. Backtest and paper-trade any strategy before using real capital. Use proper risk management.

My Band by MAMY-BAND – Adaptive Moving Average Channel Indicator
MY-BAND is a customizable Moving Average Band / Channel indicator designed to help traders clearly visualize trend direction, dynamic support & resistance, and market structure on any timeframe.
This indicator builds adaptive price bands around Moving Averages, making it easier to identify:
- Trend continuation
- Trend reversal
- Volatility expansion and contraction
- Key breakout and pullback zones
It works perfectly for crypto, forex, and stock markets.
🔧 Key Features
✅ Multi-Timeframe MA Bands
✅ HiLo & LLMA Moving Average Types
✅ Dynamic Channel Width
✅ ZigZag Structure Detection
✅ Average Center Line
✅ Trend Bending Option
✅ Support & Resistance Layer
✅ Fully Adjustable Inputs
✅ Works on All Timeframes
📊 How to Use
Trend Trading
Price above upper band → Strong bullish trend
Price below lower band → Strong bearish trend
Pullback Entries
Enter on pullback to middle MA in trend direction
Breakout Trading
Strong breakout outside the band signals continuation
Market Structure
ZigZag feature helps identify swing highs & lows
⚙️ Inputs Explanation
MA Timeframe (MA TF) – Select the timeframe for MA calculation
Length 1 & Length 2 – Fine-tune band sensitivity
MA Type – Choose between HiLo or LLMA
Width – Controls band distance
AVG Line – Show central average line
Zigzag – Display market structure swings
Extend – Extend channel into the future
Bending – Smooth adaptive band behavior
✅ Best For
Trend Followers
Scalpers
Swing Traders
Crypto Futures Traders
Breakout & Pullback Strategies
⚠️ Disclaimer
This indicator is for educational and analytical purposes only. It does not provide financial advice. Always use proper risk management and confirm signals with other indicators.

Trend Trader//@version=6
indicator("Trend Trader", shorttitle="Trend Trader", overlay=true)
// User-defined input for moving averages
shortMA = input.int(10, minval=1, title="Short MA Period")
longMA = input.int(100, minval=1, title="Long MA Period")
// User-defined input for the instrument selection
instrument = input.string("US30", title="Select Instrument", options= )
// Set target values based on selected instrument
target_1 = instrument == "US30" ? 50 :
instrument == "NDX100" ? 25 :
instrument == "GER40" ? 25 :
instrument == "GOLD" ? 5 : 5 // default value
target_2 = instrument == "US30" ? 100 :
instrument == "NDX100" ? 50 :
instrument == "GER40" ? 50 :
instrument == "GOLD" ? 10 : 10 // default value
// User-defined input for the start and end times with default values
startTimeInput = input.int(12, title="Start Time for Session (UTC, in hours)", minval=0, maxval=23)
endTimeInput = input.int(17, title="End Time Session (UTC, in hours)", minval=0, maxval=23)
// Convert the input hours to minutes from midnight
startTime = startTimeInput * 60
endTime = endTimeInput * 60
// Function to convert the current exchange time to UTC time in minutes
toUTCTime(exchangeTime) =>
exchangeTimeInMinutes = exchangeTime / 60000
// Adjust for UTC time
utcTime = exchangeTimeInMinutes % 1440
utcTime
// Get the current time in UTC in minutes from midnight
utcTime = toUTCTime(time)
// Check if the current UTC time is within the allowed timeframe
isAllowedTime = (utcTime >= startTime and utcTime < endTime)
// Calculating moving averages
shortMAValue = ta.sma(close, shortMA)
longMAValue = ta.sma(close, longMA)
// Plotting the MAs
plot(shortMAValue, title="Short MA", color=color.blue)
plot(longMAValue, title="Long MA", color=color.red)
// MACD calculation for 15-minute chart
= request.security(syminfo.tickerid, "15", ta.macd(close, 12, 26, 9))
macdColor = macdLine > signalLine ? color.new(color.green, 70) : color.new(color.red, 70)
// Apply MACD color only during the allowed time range
bgcolor(isAllowedTime ? macdColor : na)
// Flags to track if a buy or sell signal has been triggered
var bool buyOnce = false
var bool sellOnce = false
// Tracking buy and sell entry prices
var float buyEntryPrice_1 = na
var float buyEntryPrice_2 = na
var float sellEntryPrice_1 = na
var float sellEntryPrice_2 = na
if not isAllowedTime
buyOnce :=false
sellOnce :=false
// Logic for Buy and Sell signals
buySignal = ta.crossover(shortMAValue, longMAValue) and isAllowedTime and macdLine > signalLine and not buyOnce
sellSignal = ta.crossunder(shortMAValue, longMAValue) and isAllowedTime and macdLine <= signalLine and not sellOnce
// Update last buy and sell signal values
if (buySignal)
buyEntryPrice_1 := close
buyEntryPrice_2 := close
buyOnce := true
if (sellSignal)
sellEntryPrice_1 := close
sellEntryPrice_2 := close
sellOnce := true
// Apply background color for entry candles
barcolor(buySignal or sellSignal ? color.yellow : na)
/// Creating buy and sell labels
if (buySignal)
label.new(bar_index, low, text="BUY", style=label.style_label_up, color=color.green, textcolor=color.white, yloc=yloc.belowbar)
if (sellSignal)
label.new(bar_index, high, text="SELL", style=label.style_label_down, color=color.red, textcolor=color.white, yloc=yloc.abovebar)
// Creating labels for 100-point movement
if (not na(buyEntryPrice_1) and close >= buyEntryPrice_1 + target_1)
label.new(bar_index, high, text=str.tostring(target_1), style=label.style_label_down, color=color.green, textcolor=color.white, yloc=yloc.abovebar)
buyEntryPrice_1 := na // Reset after label is created
if (not na(buyEntryPrice_2) and close >= buyEntryPrice_2 + target_2)
label.new(bar_index, high, text=str.tostring(target_2), style=label.style_label_down, color=color.green, textcolor=color.white, yloc=yloc.abovebar)
buyEntryPrice_2 := na // Reset after label is created
if (not na(sellEntryPrice_1) and close <= sellEntryPrice_1 - target_1)
label.new(bar_index, low, text=str.tostring(target_1), style=label.style_label_up, color=color.red, textcolor=color.white, yloc=yloc.belowbar)
sellEntryPrice_1 := na // Reset after label is created
if (not na(sellEntryPrice_2) and close <= sellEntryPrice_2 - target_2)
label.new(bar_index, low, text=str.tostring(target_2), style=label.style_label_up, color=color.red, textcolor=color.white, yloc=yloc.belowbar)
sellEntryPrice_2 := na // Reset after label is created

Grok/Claude Quantum Signal Pro * Enhanced v2# QSig Pro+ v2 — Dynamic RSI Enhancement
## Release: Quantum Signal Pro Enhanced v2
**Author:** ralis24 (with Claude assistance)
**Version:** 2.0
**Platform:** TradingView (Pine Script v6)
---
## Overview
Version 2 introduces **Trend-Adaptive RSI Thresholds** — a significant enhancement that dynamically adjusts buy and sell levels based on real-time trend strength. This allows the indicator to more effectively capture dips in uptrends and sell bounces in downtrends, rather than waiting for extreme oversold/overbought conditions that rarely occur during strong directional moves.
---
## The Problem v2 Solves
In the original QSig Pro+, RSI thresholds were fixed at 30 (oversold) and 70 (overbought). While these levels work well in ranging markets, they create issues in trending conditions:
- **Strong Uptrends:** Price rarely drops to RSI 30. Pullbacks typically bottom around RSI 40-50, causing missed buy opportunities.
- **Strong Downtrends:** Relief rallies rarely push RSI above 70. Bounces often exhaust around RSI 55-65, causing missed sell opportunities.
The v2 solution: **Let the market's trend strength dictate the appropriate RSI levels.**
---
## New Feature: Dynamic RSI Thresholds
### How It Works
The indicator now detects three distinct market states and applies corresponding RSI thresholds:
| Market State | Detection Criteria | RSI Buy Level | RSI Sell Level |
|--------------|-------------------|---------------|----------------|
| **Strong Uptrend** | +DI > -DI, ADX > 24, ADX rising | < 40 | > 80 |
| **Strong Downtrend** | -DI > +DI, ADX > 24, ADX rising | < 20 | > 60 |
| **Neutral/Ranging** | ADX < 24 or ADX falling | < 30 | > 70 |
### Trend State Detection Logic
```
Strong Uptrend = (+DI > -DI) AND (ADX > threshold) AND (ADX > ADX )
Strong Downtrend = (-DI > +DI) AND (ADX > threshold) AND (ADX > ADX )
Neutral = Neither condition met
```
### Anti-Whipsaw Protection
To prevent rapid switching between threshold sets during choppy transitions, a **confirmation buffer** requires the trend state to persist for a configurable number of bars (default: 2) before the indicator switches regimes.
---
## New Input Parameters
A new input group "**Dynamic RSI Thresholds**" has been added with the following settings:
| Parameter | Default | Range | Description |
|-----------|---------|-------|-------------|
| Enable Trend-Adaptive RSI Levels | ON | toggle | Master switch for the feature |
| ADX Strong Trend Threshold | 24 | 15-40 | ADX must exceed this to qualify as "strong" trend |
| ADX Rising Lookback (bars) | 3 | 1-10 | ADX must be higher than N bars ago to confirm rising |
| Trend Confirmation Bars | 2 | 1-5 | Bars trend must persist before switching thresholds |
| RSI Buy Level (Strong Uptrend) | 40 | 30-55 | Oversold threshold during confirmed uptrends |
| RSI Sell Level (Strong Uptrend) | 80 | 70-90 | Overbought threshold during confirmed uptrends |
| RSI Buy Level (Strong Downtrend) | 20 | 10-30 | Oversold threshold during confirmed downtrends |
| RSI Sell Level (Strong Downtrend) | 60 | 50-70 | Overbought threshold during confirmed downtrends |
| RSI Buy Level (Neutral/Ranging) | 30 | 20-40 | Standard oversold threshold |
| RSI Sell Level (Neutral/Ranging) | 70 | 60-80 | Standard overbought threshold |
---
## Enhanced Info Panel
The information panel now displays two new rows:
1. **Trend State** — Shows current regime: "STRONG UP" (green), "STRONG DOWN" (red), or "NEUTRAL" (gray)
2. **RSI Levels** — Displays the currently active thresholds (e.g., "40 / 80" during uptrends)
Additionally, the **ADX row** now includes a directional arrow (↑ or ↓) indicating whether ADX is rising or falling.
---
## Enhanced Signal Labels
Buy and sell labels on the chart now include contextual information:
**Before (v1):**
```
BUY: 97,234.50
```
**After (v2):**
```
BUY: 97,234.50
STRONG UP | RSI<40
```
This provides immediate visual confirmation of which threshold regime triggered the signal.
---
## Enhanced Alert System
### New Alert Conditions
Three new alerts have been added for trend state changes:
- **🔼 Strong Uptrend Started** — Fires when market transitions to strong uptrend (thresholds shift to 40/80)
- **🔽 Strong Downtrend Started** — Fires when market transitions to strong downtrend (thresholds shift to 20/60)
- **⚖️ Trend Neutralized** — Fires when trend weakens and thresholds reset to 30/70
### Enhanced Webhook JSON
The JSON alert payload now includes additional fields for bot integration:
```json
{
"action": "BUY",
"symbol": "BTC/USDT",
"price": "97234.50",
"rsi": "38.5",
"rsi_threshold": "40",
"adx": "28.3",
"fisher": "-1.87",
"trend_state": "STRONG UP"
}
```
---
## Bonus Enhancement: Dynamic Fisher Thresholds
As an additional refinement, the Fisher Transform thresholds now adjust slightly based on trend state:
| Trend State | Fisher Buy Level | Fisher Sell Level |
|-------------|------------------|-------------------|
| Strong Uptrend | -1.5 (loosened) | -2.0 (standard) |
| Strong Downtrend | -2.0 (standard) | +1.5 (loosened) |
| Neutral | -2.0 (standard) | +2.0 (standard) |
This allows the indicator to trigger signals in strong trends where momentum oscillators rarely reach extreme levels.
---
## Practical Trading Impact
### Strong Uptrend Example (BTC rally)
- **Before:** Waiting for RSI < 30 means missing most pullback entries
- **After:** RSI < 40 triggers buy signals on normal pullbacks within the trend
### Strong Downtrend Example (Bear market bounce)
- **Before:** Waiting for RSI > 70 means holding through entire relief rallies
- **After:** RSI > 60 triggers sell signals on bounce exhaustion
### Ranging Market
- Thresholds remain at traditional 30/70 levels where mean reversion works best
---
## Backward Compatibility
The dynamic RSI feature can be completely disabled by turning off "Enable Trend-Adaptive RSI Levels" in the settings. When disabled, the indicator behaves identically to v1 using the neutral threshold values (30/70).
---
## Summary of Changes
| Component | v1 | v2 |
|-----------|----|----|
| RSI Thresholds | Fixed 30/70 | Dynamic based on trend state |
| Trend State Detection | Not present | +DI/-DI + ADX + Rising confirmation |
| Whipsaw Protection | Not present | Configurable confirmation bars |
| Info Panel Rows | 10 | 12 (added Trend State, RSI Levels) |
| ADX Display | Value only | Value + direction arrow |
| Signal Labels | Price only | Price + Trend State + Threshold |
| Alert Conditions | 10 | 13 (added 3 trend state alerts) |
| Webhook Fields | 5 | 7 (added rsi_threshold, trend_state) |
| Fisher Thresholds | Fixed | Adaptive (subtle adjustment) |
---
## Recommended Settings by Market Type
### Crypto (High Volatility)
- ADX Strong Trend Threshold: 24
- RSI Buy (Uptrend): 40-45
- RSI Sell (Downtrend): 55-60
### Forex (Medium Volatility)
- ADX Strong Trend Threshold: 22
- RSI Buy (Uptrend): 38-42
- RSI Sell (Downtrend): 58-62
### Stocks/Indices (Lower Volatility)
- ADX Strong Trend Threshold: 20
- RSI Buy (Uptrend): 35-40
- RSI Sell (Downtrend): 60-65
---
## Installation
1. Open TradingView and navigate to Pine Editor
2. Remove or rename existing QSig Pro+ indicator
3. Paste the complete v2 code
4. Click "Add to Chart"
5. Configure Dynamic RSI Thresholds in settings as desired
---
*QSig Pro+ v2 — Smarter entries through trend-aware signal generation*

3:55 PM Candle High/Low Levels (ARADO VERSION)a lil better in smaller tfs. Its a veryyyyy cool indicator guys (thanks ivan)

Bank Zone by TheRealWealthVision V2The Bank Zone indicator is designed to help traders identify key price areas where institutions, banks, and large market participants are likely active. It highlights potential zones of accumulation, distribution, liquidity grabs, and high-value reaction levels.
This tool automatically detects structural shifts, dynamic zones, and real-time market behavior to support more accurate decision-making. It is suitable for scalping, intraday trading, and swing trading across all markets including Forex, Indices, Crypto, Stocks, Commodities, and more.
Main Features
Automatic detection of potential institutional zones
Real-time dynamic updates
Clear visual highlights on the chart
Designed to work on all timeframes
Fully compatible with the latest TradingView Pine Script engine
Best For
Identifying high-probability reaction areas
Understanding where big players may enter or exit
Improving trade timing and precision
Building a cleaner, more structured market view
Important Notice
This indicator does not repaint historical zones improperly, does not generate unrealistic signals, and follows all TradingView guidelines for script behavior.

Fib Golden RatioDynamic Fib High → Low (0.5 & 0.618)
This indicator automatically tracks the current day’s High and Low and plots the key Fibonacci retracement levels 0.5 (50%) and 0.618 (Golden Ratio) based on the live intraday price range.
The tool is designed for traders who want simple, clean, and dynamic intraday Fibonacci levels without clutter on the chart.
How It Works
Detects the start of a new trading day
Tracks the highest high and lowest low of the current day
Continuously recalculates:
Fibonacci 0.5 (Midpoint)
Fibonacci 0.618 (Golden Ratio)
Plots clean continuous lines across the chart
Fib is calculated from High → Low, matching how typical intraday fib tools are visually applied
Why This Indicator
No drawings to manually adjust
No user configuration required
Extremely lightweight and fast
Automatically adjusts as the day progresses
Perfect for identifying intraday mean reversion zones, pullback zones, and reaction levels
Ideal Use Cases
Intraday directional trading
Scalping pullbacks
Mean reversion setups
Identifying dynamic support/resistance zones
Option scalping (CE/PE)

Deviaton Tracker - QuantSyDeviation Tracker - QuantSy
An adaptive volatility band system that maps price behavior across statistical deviation zones. Provides visual context for market extremes and tracks duration patterns for probabilistic mean reversion analysis.
What it offers:
Dynamic bands that adjust to current volatility conditions, creating clear visual zones for price action. The system continuously monitors time spent in each zone and builds a statistical profile of typical duration patterns, helping identify when price may be overextended.
Best for:
Spotting potential reversal areas at volatility extremes
Understanding current price positioning relative to recent behavior
Timing entries and exits based on statistical probabilities
Risk management and position sizing decisions
Clean gradient visualization provides immediate context while the underlying statistical engine tracks behavioral patterns across all market conditions.
**⚠️ Disclaimer**
Educational tool only - does not constitute investment advice. The developer assumes no liability for any trading profits or losses incurred through the use/misuse of this indicator.
This indicator does not include any features related to interest, leverage, or gambling. Users are fully responsible for making sure their assets and trading practices align with Islamic guidelines.

SCOTTGO ORB V1SCOTTGO ORB (Opening Range Breakout) Indicator
The ORB Indicator is a powerful tool for day traders and scalpers, designed to automatically identify and project key price levels based on the market's initial trading activity—the Opening Range (OR).
It helps you quickly visualize the market structure, potential breakout zones, and price targets for the day.
🔑 Key Features & Customization
1. Dynamic Opening Range Calculation
Flexible Time Periods: Easily define your Opening Range using preset times of 5, 15, or 30 minutes. You can also use the International Overrides to set a custom start and end time with a specified timezone.
Visual Range: The indicator automatically calculates and shades the range between the ORB High and ORB Low prices. The Opacity of this shaded box is fully adjustable.
2. Comprehensive Price Targets
The indicator projects multiple levels of price targets (PTs) based on the size of the initial Opening Range, enabling you to set profit targets and manage risk. Targets are grouped for easy toggling:
Default Targets (50%): Visualize the immediate $50\%$ price extension above and below the ORB.
Extended Targets (75%, 100%): View the $75\%$ and full $100\%$ extension levels.
Further Targets (150%, 200%): Explore extended targets for volatile or trending days.
Mid Point: Optional line to display the $50\%$ retracement/midpoint of the ORB itself.
3. Fibonacci Extensions
Access highly relevant price projections using classic Fibonacci ratios:27.2% and 61.8% Extensions: These provide additional high-probability price targets for breakout scenarios.
4. Breakout & Retest Signaling
Entry Signals: Displays on-chart labels for potential ORB Breakouts and subsequent
Retests (BRB), helping you identify high-probability entry points.
Alert Options: Set alerts for simple ORB level crosses or restrict alerts only to confirmed breakout scenarios (Alert only on ORB breakouts).
🎨 Style Customization
All main ORB lines, target levels, and Fibonacci lines can be individually styled (color, thickness, line type) directly within the TradingView Style tab for a personalized chart experience. Dedicated inputs are available for setting colors for 50%, 75%, 100%, and Fibonacci 27.2% / 61.8% levels.
💡 How to Use
1. Set Your ORB Period: Choose the time frame that best suits your market (e.g., 15 minutes is common for US indices).
2. Monitor the Breakout: Once the ORB session ends, wait for the price to break above the ORB High or below the ORB Low.
3. Target and Risk: Use the projected Price Targets to define your potential profit zones, and place stop-losses just inside the ORB range.
SCOTTGO

Anchored VWAP + Bands + Signals//@version=5
indicator("Anchored VWAP + Bands + Signals", overlay=true)
// ===== INPUTS =====
anchorTime = input.time(timestamp("2025-12-02 00:00"), "Anchor Date/Time")
std1 = input.float(1.0, "±1σ Band")
std2 = input.float(2.0, "±2σ Band")
// ===== VWAP CALCULATION =====
var float cumPV = 0.0
var float cumVol = 0.0
if time >= anchorTime
cumPV += close * volume
cumVol += volume
vwap = cumVol != 0 ? cumPV / cumVol : na
// ===== STANDARD DEVIATION =====
barsSinceAnchor = bar_index - ta.valuewhen(time >= anchorTime, bar_index, 0)
sd = barsSinceAnchor > 1 ? ta.stdev(close, barsSinceAnchor) : 0
// ===== BANDS =====
upper1 = vwap + std1 * sd
lower1 = vwap - std1 * sd
upper2 = vwap + std2 * sd
lower2 = vwap - std2 * sd
plot(vwap, color=color.orange, title="VWAP")
plot(upper1, color=color.green, title="+1σ Band")
plot(lower1, color=color.green, title="-1σ Band")
plot(upper2, color=color.red, title="+2σ Band")
plot(lower2, color=color.red, title="-2σ Band")
// ===== SIGNALS =====
buySignal = ta.crossover(close, lower1)
sellSignal = ta.crossunder(close, upper1)
plotshape(buySignal, style=shape.triangleup, location=location.belowbar, color=color.green, size=size.small, title="Buy Signal")
plotshape(sellSignal, style=shape.triangledown, location=location.abovebar, color=color.red, size=size.small, title="Sell Signal")
alertcondition(buySignal, title="Buy Alert", message="Price touched lower 1σ band – Buy Opportunity")
alertcondition(sellSignal, title="Sell Alert", message="Price touched upper 1σ band – Sell Opportunity")

BT LigmaThe BT Ligma indicator combines momentum-based signals with volatility filters to identify potential trend reversals and high-probability entry points.
It uses a set of Exponential Moving Averages (EMAs) – typically a fast EMA (e.g., 9-period) crossing over a slower one (e.g., 21-period) – to generate baseline buy/sell signals. These are enhanced by a proprietary "Ligma Spread" filter, which measures the dynamic spread between short-term price action and a volatility envelope (similar to Bollinger Bands but customized with ATR multipliers). This filter helps weed out false signals in choppy markets by requiring a minimum spread threshold before confirming a trade alert.
BT Ligma allows a user to select up to 3 EMAs, the MA calculation method, and signal individual candles that cross EMA 1 & 2, or all 3 bands in the same bar.
Version 1.4, includes refined alert logic, including audio/visual notifications and optional trailing stops based on EMA alignments.
To use it effectively for trade entries:
Long (Buy) Entries: Look for a bullish EMA crossover (fast EMA above slow) combined with a positive Ligma Spread expansion (indicating increasing momentum). Enter when the signal fires on a close above the recent swing high, ideally on a timeframe like 15m or 1h for scalping/day trading. Pair this with volume confirmation or RSI above 50 to avoid overbought traps.
Short (Sell) Entries: Wait for a bearish EMA crossover (fast below slow) with a contracting or negative Ligma Spread (signaling potential downside volatility). Enter on a close below the recent swing low, using higher timeframes (e.g., 4h) for swing trades to capture larger moves.
General Tips: Always apply risk management – set stops below/above the slow EMA, target 2-3x risk-reward ratios, and avoid trading during low-liquidity periods. Backtest on historical data to tweak parameters, and combine with fundamentals like news events for better context.
Daily Anchored VWAPAnchors VWAP to whatever time you want instead of the usual start of session. I use it for BTC so that I can anchor around NY open instead of the night before.

Donchian ForecastDonchian Forecast – multi-timeframe Donchian/ATR bias with ADX regime blending
Donchian Forecast is a multi-timeframe bias tool that turns classic Donchian channels into a normalized trend/mean-reversion “forecast” and a single bias value in .
It projects a short polyline path from the current price and shows how that path adapts when the market shifts from ranging to trending (via ADX).
---
Concept
1. Donchian position → direction
For each timeframe, the script measures where price sits inside its Donchian channel:
-1 = near channel low
0 = middle
+1 = near channel high
This Donchian position is multiplied by ATR to create a **price delta** (how far the forecast moves from current price).
2. Local behavior: trend vs mean-reversion around Donchian
The indicator treats the edges vs middle of the Donchian channel differently:
* By default, edges behave more “trend-like”, middle more “mean-reverting”.
* If you enable the reversed option, this logic flips (edges = mean-reverting, middle = trend-
like).
* This “local” behavior is controlled smoothly by the absolute Donchian position |pos| (not by hard zone switches).
3. Global ADX modulation (regime aware)
ADX is mapped from your chosen low → high thresholds into a signed factor in :
* ADX ≤ low → -1 (fully reversed behavior, more range/mean-reversion oriented)
* ADX ≥ high → +1 (fully normal behavior, more trend oriented)
* Values in between create a **smooth transition**.
* This global factor can:
* Keep the local behavior as is (trending regime),
* Flip it (range regime), or
* Neutralize it (indecisive regime).
4. Multi-timeframe aggregation (1x–12x chart timeframe)
* The script repeats the same logic across 12 horizons:
* 1x = chart timeframe
* 2x..12x = multiples of the chart timeframe (e.g., 5m → 10m, 15m, …; 1h → 2h, 3h, …).
* For each horizon it builds:
* Donchian position
* ATR-scaled delta (in price units)
* Locally + globally blended delta (after Donchian + ADX logic).
* These blended deltas are ATR-weighted and summed into a single bias in , which is then shown as Bias % in the on-chart table.
---
### What you see on the chart
* Forecast polyline
* Starting at the current close, the indicator draws a short chain of **up to 12 segments**:
* Segment 1: from current price → 1x projection
* Segment 2: 1x → 2x projection
* … up to 12x.
* Each segment is:
* Green when its blended delta is ≥ 0 (upward bias)
* Red when its blended delta is < 0 (downward bias)
* This is not future price, but a synthetic path showing how the Donchian/ATR/ADX model “expects” price to drift across multiple horizons.
* Bias table (top-center)
* `Bias: X.Y%`
* > 0% (green) → net upward bias across horizons
* < 0% (red) → net downward bias
* Magnitude (e.g., ±70–100%) ≈ strength of the directional skew.
* `ADX:` current ADX value (from your DMI settings).
* `ADXBlend:` the signed ADX factor in :
* +1 ≈ fully “trend-interpretation” of Donchian behavior
* 0 ≈ neutral / mixed regime
* -1 ≈ fully “reversed/mean-reversion interpretation”
---
Inputs & settings
Core Donchian / ATR
* Donchian Length – lookback for Donchian high/low on each horizon.
* Price Source – input series used for position inside the Donchian channel (default: close).
* ATR Length – ATR lookback for all horizons.
* ATR Multiplier – scales the size of each forecast step in price units (higher = longer segments / more aggressive forecast).
*Local behavior at high ADX
* Reversed local blend at high ADX?
* Off (default) – edges behave more trend-like, middle more mean-reverting.
* On – flips that logic (edges more mean-reverting, middle more trend-like).
* The actual effect is always modulated by the global ADX factor, so you can experiment with how the regime logic feels in different markets.
Global ADX blending
* DMI DI Length – period for the DI+ and DI- components.
* ADX Smoothing – smoothing length for ADX.
* ADX low (mean-rev zone) – below this level, the global factor pushes behavior toward reversal/range logic .
* ADX high (trend zone) – above this level, the global factor pushes behavior toward **trend logic**.
* Values between low and high create a smooth blend rather than a hard on/off switch.
---
How to use it (examples)
* Directional bias dashboard
* Use the Bias % as a compact summary of multi-horizon Donchian/ATR/ADX conditions:
* Consider only trades aligned with the sign of Bias (e.g., longs only when Bias > 0).
* Use the magnitude to filter for **strong vs weak** directional contexts.
* Regime-aware context
* Watch ADX and ADXBlend:
* High ADX & ADXBlend ≈ +1 → favor trend-continuation ideas.
* Low ADX & ADXBlend ≈ -1 → favor range/mean-reversion ideas.
* Around 0 → mixed/transition regimes; forecasts will be more muted.
* Visual sanity check for systems
* Overlay Donchian Forecast on your usual entries/exits to see:
* When your system trades **with** the multi-TF Donchian bias.
* When it trades **against** it (possible fade setups or no-trade zones).
This script does not generate entry or exit signals by itself. It is a contextual/forecast tool meant to sit on top of your own trading logic.
---
Notes
* Works on most symbols and timeframes; higher-timeframe multiples are built from the chart timeframe.
* The forecast line is a model-based projection, not a prediction or guarantee of future price.
* Always combine this with your own risk management, testing, and judgement. This is for educational and analytical purposes only and is not financial advice.
