BTC 1D UpdateThe Hook: Is the floor finally in? $70k is the new battleground. 🩸📉
If you’re looking at your portfolio today, take a deep breath. Bitcoin has officially plunged below $71,000, hitting lows we haven't seen since early November 2024. We’ve wiped out over $500 billion in market cap this week alone, and nearly $1.7 billion in leveraged positions have been vaporized in the last 24 hours.
Why the panic? It’s a "perfect storm" of macro uncertainty. The market is reeling from $272 million in ETF outflows, a partial U.S. government shutdown causing delays in key economic data, and the nomination of Kevin Warsh as Fed Chair, which has investors scrambling to safe-havens like gold.
The Technical Roadmap:
The Critical Support: We are currently battling to hold the $70,129 – $70,900 zone. Losing this could trigger an accelerated slide toward the next major demand level at $68,000 or even $65,000.
The Recovery Trigger: To flip the narrative, we need to reclaim $74,434 on the daily chart. Once we flip that level back into support, the path back to $80k and beyond reopens.
Sentiment Check: The Fear & Greed Index has tanked to 11 (Extreme Fear). Historically, this level of "blood in the streets" is exactly where long-term wealth is built while the "paper hands" exit.
The Play: The smart money isn't panic-selling; they are waiting for the 4H candle to confirm buyer absorption at these levels. Don't be the exit liquidity—be the one who understands the math behind the move.
#Bitcoin #BTC #CryptoTrading #TechnicalAnalysis #TradingView #Web3 #BTCDump #MarketPanic
What traders are saying

Why Bitcoin’s Stability Is a Warning, Not StrengthBitcoin’s inability to participate in the recent “debasement trade” is not a sign of hidden strength — it’s a sign of waning relevance in the current macro cycle.
While gold and silver surged during the final euphoric phase, Bitcoin’s stagnation near $82,000 suggests that capital actively chose hard assets over digital ones, not that Bitcoin avoided speculative excess. In other words, investors didn’t “miss” Bitcoin — they rejected it.
Rather than having “less froth to shed,” Bitcoin may simply lack incremental demand. The market has already priced in its scarcity narrative, ETFs, and institutional adoption. Without a new catalyst, stability becomes distribution, not consolidation.
The idea that liquidity exiting metals will rotate into crypto assumes that Bitcoin is viewed as a safe alternative store of value. Current flows argue the opposite: in periods of uncertainty, capital is choosing tangible, historically defensive assets, not high-volatility digital instruments.
Bitcoin’s scarcity also cuts both ways. Unlike gold and silver, Bitcoin has no industrial or sovereign demand floor. If speculative demand dries up, there is nothing to absorb sell pressure. Scarcity without utility can amplify downside, not protect against it.
If the Warsh nomination triggers prolonged global liquidity tightening, Bitcoin is likely to suffer more than metals, not less. Cryptocurrencies remain among the most liquidity-sensitive risk assets. Tightening doesn’t just pressure them — it starves them.
Bottom line
Bitcoin’s calm may not be coiled strength. It may be complacency before repricing.
In this view, metals already flushed excess and proved their role. Bitcoin still has to.

Best entry of all timeJust entry liquidity - when you see liquidity, and market structure change, along with benchmarks like gold and geopolitics. You should be in and win

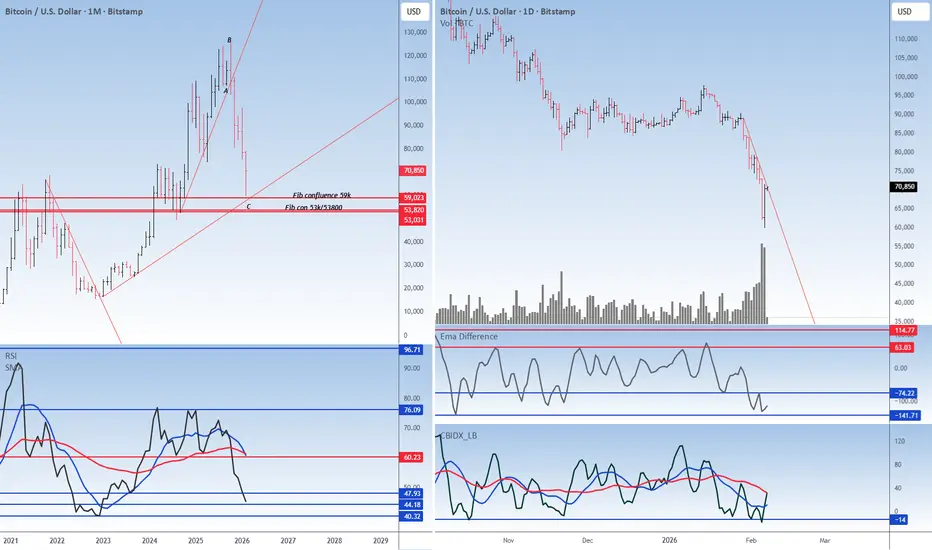
The crypto has found its supportBitcoin CMP $70690
The beauty of looking at various asset classes is that they rise and fall together. In my view the correction in the crypto is over.
Elliott- The v waves within the C wave is done. Hence to me this correction is over.
Fib- The crypto reversed just shy away from the 59K which is the confluence zone on the chart.
Trendline- the same area is also supported with a trendline. Hence the zone is a strong strong support.
Oscillators- All the oscillators are at support. This is yet another indication of strength.
Bar - the daily chart is showing a railway track which is a directional signal.
Capitulation- the huge volume on the bottom is indicating capitulation.
Conclusion- yesterday it was silver that bounced back strongly and bitcoin too which is indicating a reversal.
BITCOIN Bitcoin Liquidity Sweep Setup – Distribution in Progress?
Bitcoin is currently trading inside a clear upper liquidity zone after a strong impulsive recovery from the lows. Price has now made three attempts to break the upper supply area, but each push is showing weakening momentum.
🔎 What I’m Seeing:
Multiple rejections from the upper liquidity block
Equal highs / buy-side liquidity resting above
Momentum slowing on each attempt
Smart money showing distribution behavior
As long as price stays below the 73k supply zone, probability favors a controlled move lower.
📉 Bearish Scenario:
If price fails to hold 70.5k–70k, we can expect:
First target: 69k
Next liquidity pocket: 66.5k
Extended target: 64k demand zone
📈 Bullish Invalidation:
A strong 15m close above 73k with volume expansion can trigger a squeeze toward 74.5k–75k.
Currently leaning sell on rise unless structure shifts.
Risk management is key — liquidity is being engineered on both sides.


Astro Timing🧭 TRADER’S ASTRO-COMPASS: Saturday, Jan 31, 2026 Timezone: New York (EST)
📉 MARKET PROBABILITY: The market has a split personality today. The pre-market session offers high probability setups (an echo of yesterday's Jupiter), but the main session turns into a volatility trap. Rule of the day: "Hit and Run." If you catch a move early, lock it in. Staying until the afternoon increases the probability of a total drawdown.
🟢 PROFIT WINDOW: Until 05:50 AM (EST)
Factors: Moon in Cancer (Intuition) Sextile Uranus (Volatility spike) + Trine Saturn (Structure).
The Setup: We are riding the tailwinds of yesterday’s "Royal Conjunction" with Jupiter. Uranus brings unexpected volume spikes.
Strategy: High liquidity for crypto/forex scalping. Saturn acts as your automatic "Take Profit" button here—don't get greedy, lock the gains immediately.
⚪️ DEAD VOLUME (Void): 05:52 AM – 08:09 AM (EST)
Status: Moon Void of Course.
Risk: Zero edge. Orders may hang, liquidity dries up. Do not initiate new positions.
🔴 MARGIN CALL ZONE: After 11:00 AM (EST)
Factor: Moon enters Leo and applies to Opposition with Pluto (Peak impact at 02:21 PM).
Psychology (Leo): Triggers "God Mode" and FOMO. You might feel the urge to go "all in" to impress or recover losses.
Reality (Pluto): Pluto is the planet of force majeure and bankruptcy. In financial astrology, the Moon-Pluto opposition is the classic signature of a "account wipeout" or a sudden market crash against the retail trader.
Strategy: Close the terminal. You are not trading against the trend here; you are trading against a steamroller.

BTCUSD/BITCOIN SELL PROJECTION 03.02.26BTCUSD SELL PROJECTION | Market Breakdown Explained
“Let’s break down the current BTCUSD market structure and why the sell bias is still valid.
Bitcoin is clearly trading inside a parallel downtrend channel, showing strong bearish continuation. After a strong impulsive drop, price attempted a pullback but failed to break the upper trendline, confirming sellers are still in control.
We can clearly see a bearish continuation pattern, where price broke the neckline support, which is a major confirmation for further downside. This breakdown was followed by a Three Black Crows candlestick pattern, showing strong institutional selling pressure.
Currently, price is trading below the R1 resistance zone, and this area is acting as a supply zone. Any pullback toward this zone is considered a sell-on-retest opportunity.
There is a visible Fair Value Gap (FVG) above the current price. The market may retrace slightly to fill this imbalance, but as long as price stays below the downtrend trendline, the bias remains bearish.
The trendline acts as our stop loss area, protecting the sell setup.
On the downside, the first target is Support S1, marked as Target Price 1.
If selling momentum continues, the final target aligns with Support S2, near the lower trendline, marked as Target Price 2.

BTCUSD Reacts From Demand Zone After Strong Bearish MoveBTCUSD has shown a sharp fall from the upper resistance area near 90,500–91,500, where sellers clearly dominated and price failed to hold higher levels. This rejection led to a strong bearish move, confirming a short-term downtrend with consistent lower highs and lower lows. The descending trendline reflects continued selling pressure and weak upside acceptance.
After the decline, price reached an important demand zone around 76,000–77,000. In this area, selling pressure reduced and buying interest appeared, leading to a short-term bounce. This zone is supported by previous price consolidation and acts as a key support in the current market structure. The reaction suggests temporary stability, not a confirmed trend change.
While price stays above 76,000, consolidation or a corrective move toward 82,000–85,000 is possible. This zone may act as near-term resistance, as it aligns with earlier breakdown levels. Acceptance above this range would reduce bearish strength and support further recovery.
If price fails to sustain above the demand zone, downside risk remains open toward the 73,000 support region. Overall bias stays cautious, with high volatility expected near marked levels.

BTC 1D UpdateThe Hook: Blood in the streets? Or the opportunity of 2026? 🩸📉
If you’re feeling the heat today, you’re not alone. Bitcoin just took a massive swing, slicing through supports to hit a local low around $80,553. The "Fear & Greed Index" has officially tanked into Extreme Fear (20/100), and the timeline is full of panic.
What’s driving this? It’s a perfect storm: nearly $1 billion in ETF outflows in a single day, combined with the uncertainty of a partial US government shutdown and the buzz around Kevin Warsh’s nomination for Fed Chair.
My Technical Roadmap:
The "Bounce" Target: We are sitting right on a major wick support at $80,559. For a bullish reversal, we need to reclaim $84,478 quickly. If we flip that, the path toward the $90k gap and eventually $94,271 reopens.
The "Pain" Scenario: If this $80k floor gives way, don't try to catch the knife. The next major technical "reloading zone" isn't until $74,458.
The Outlook: Historically, "Extreme Fear" is where the smart money builds their next cycle of wealth. We are shaking out the "paper hands" before the February trend takes over.
The Play: Patience is your best friend right now. Watch the 4H close—if we hold $80k, the "spring" could be massive.
#Bitcoin #BTC #CryptoTrading #TechnicalAnalysis #TradingView #Web3 #FOMC #BTCDump

Bitcoin Bybit chart analysis FEBURARY 2Hello
It's a Bitcoin Guide.
If you "follow"
You can receive real-time movement paths and comment notifications on major sections.
If my analysis was helpful,
Please click the booster button at the bottom.
This is Bitcoin's 30-minute chart.
The Nasdaq indicators will be released shortly at 12:00 PM.
We've proceeded as safely as possible, keeping in line with the current market conditions.
*When the light blue finger moves,
Two-way neutral strategy:
1. After touching the purple finger once at the top (autonomous shorting),
Switch to a long position at $77,247.9 at the light blue finger at the bottom.
/Stop-loss price if the light blue support line is broken.
If the price falls immediately without touching the first section,
Place the second section at the bottom as a long position waiting area. / Place the stop-loss price if the green support line is broken.
2. The top section is the target price -> If the price touches the good section repeatedly,
Maintain the long position. / If the price touches the top section and immediately falls,
Place the first section as a confirmation area for re-entry into the long position.
From the bottom, there's a possibility of further lows being broken.
The third section at the very bottom is a double bottom risk zone.
Currently, there's no clear support line, making long positions risky.
A rebound is needed, and I'll focus on this.
*Key criteria for this are a Nasdaq rise or sideways movement, and the XAUUSD gold price should continue to decline.
Please use my analysis to this point for reference only.
I hope you operate safely, with a focus on principled trading and stop-loss orders.
Thank you.

Bearish Continuation Setup After Dead-Cat Bounce (1H)
What the chart is saying:
Clear bearish trend: Price has been making lower highs and lower lows. The broader structure is decisively bearish.
Range breakdown: The blue box shows a consolidation range that broke to the downside, confirming continuation rather than accumulation.
Strong sell-off into demand: Price aggressively dropped into the red support zone (~62k–64k), where buyers stepped in hard, creating a sharp bounce.
Relief rally, not reversal: The current move up is a retracement, not a trend change. Momentum looks corrective, not impulsive.
Key resistance zone (~71k–72k):
This green area is previous support turned resistance
It aligns with the breakdown level → classic short opportunity
Planned trade idea (as drawn):
Entry: Into resistance (green zone)
Invalidation: Clean acceptance above resistance
Target: Prior support / liquidity pool around 63k
R:R: Favorable if rejection confirms
Bias:
📉 Bearish below resistance
Only a strong breakout + hold above 72k would weaken the short thesis
What to watch next:
Rejection wicks, bearish engulfing, or momentum divergence at resistance
Volume drying up on the push into the green zone
Failure to reclaim broken structure
⚠️ This setup assumes trend continuation, not a bottom. Until structure flips, rallies are sell-the-rip candidates.

BTC Price going down According to current uncertainty in the world market. In my opinion now BTC is going down and testing the support level. #btc

Bitcoin For Short sideBitcoin is likely to form a downside impulse wave if viewed as a continuation of a impulse wave and a correction.

Option Selling Strategies – Complete Guide1. Introduction to Option Selling
Option selling, also known as option writing, is a strategy where a trader sells (writes) options to earn premium income. Unlike option buyers, who need a strong price move to profit, option sellers benefit when the market moves sideways, slowly trends, or even slightly moves against them.
In option selling, time decay (Theta) works in your favor. Every passing day reduces the option’s value, allowing sellers to profit even if price does nothing.
However, option selling involves high risk if not managed properly, which is why it is considered a professional strategy, best used with strict risk management.
2. Why Traders Prefer Option Selling
Most professional traders prefer option selling because:
• Higher probability of profit (60–80%)
• Income generation through time decay
• Works best in range-bound markets
• Consistent returns if risk is controlled
Statistically, options expire worthless most of the time, which benefits sellers.
But remember:
Option selling gives small, consistent profits but can lead to large losses if risk is ignored.
3. Key Concepts Every Option Seller Must Know
Before strategies, you must understand:
a) Time Decay (Theta)
Time decay accelerates in the last 2–3 weeks before expiry. Sellers earn as option value melts daily.
b) Implied Volatility (IV)
• Sell options when IV is high
• Avoid selling when IV is extremely low
High IV means higher premium.
c) Margin Requirement
Option selling requires large margin, especially naked selling.
d) Risk Management
Never sell options without a hedge unless you’re highly experienced.
4. Popular Option Selling Strategies
4.1 Short Call (Naked Call Selling)
Market View: Bearish or sideways
Instrument: Sell Call option
How it Works:
You sell a call option expecting the price to stay below the strike price.
Example:
NIFTY at 22,000
Sell 22,200 CE
If NIFTY stays below 22,200 → profit = premium received.
Pros:
• High probability
• Fast premium decay
Cons:
• Unlimited loss if market rallies
• Requires high margin
👉 Best for experienced traders only.
4.2 Short Put (Naked Put Selling)
Market View: Bullish or sideways
Instrument: Sell Put option
How it Works:
You sell a put option expecting the price to stay above the strike price.
Example:
NIFTY at 22,000
Sell 21,800 PE
If NIFTY stays above 21,800 → profit = premium.
Pros:
• Works well in rising markets
• Time decay advantage
Cons:
• Large downside risk
• High margin requirement
4.3 Covered Call Strategy
Market View: Mildly bullish or sideways
Risk Level: Low
How it Works:
You hold shares and sell a call option against them.
Example:
You own 100 shares of RELIANCE
Sell OTM call option
You earn:
• Option premium
• Dividends (if any)
Pros:
• Limited risk
• Extra income on holdings
Cons:
• Upside capped
👉 Very popular among long-term investors.
4.4 Cash Secured Put
Market View: Bullish
Risk Level: Medium
How it Works:
You sell a put while keeping enough cash to buy shares if assigned.
Example:
Sell TCS 3,600 PE
Keep funds ready to buy TCS if assigned.
Pros:
• Safe way to enter stocks
• Premium reduces buying cost
Cons:
• Capital intensive
4.5 Bear Call Spread (Call Credit Spread)
Market View: Bearish or sideways
Risk Level: Limited
How it Works:
• Sell lower strike call
• Buy higher strike call
Example:
Sell 22,200 CE
Buy 22,400 CE
Pros:
• Limited loss
• Lower margin
• Ideal for beginners
Cons:
• Limited profit
4.6 Bull Put Spread (Put Credit Spread)
Market View: Bullish or sideways
Risk Level: Limited
How it Works:
• Sell higher strike put
• Buy lower strike put
Example:
Sell 21,800 PE
Buy 21,600 PE
Pros:
• Defined risk
• Works well in trending markets
4.7 Iron Condor
Market View: Range-bound
Risk Level: Limited
Structure:
• Sell OTM Call
• Buy further OTM Call
• Sell OTM Put
• Buy further OTM Put
Profit Zone:
Price must stay within a defined range.
Pros:
• High probability
• Risk limited
• Stable income strategy
Cons:
• Small profit
• Needs adjustment if breakout occurs
4.8 Iron Butterfly
Market View: Very low volatility
Profit: Maximum at ATM
This is an advanced strategy where both call and put are sold at ATM.
5. Best Time to Use Option Selling
✔ When market is range-bound
✔ When IV is high
✔ During weekly expiry
✔ After major news events
Avoid selling before:
❌ Budget
❌ RBI policy
❌ Global events
6. Risk Management Rules for Option Sellers
This is the most important section.
Golden Rules:
Always define max loss
Use stop-loss
Prefer hedged strategies
Avoid over-trading
Risk only 1–2% capital per trade
Exit early if target achieved
Never sell options emotionally
7. Psychology of Option Selling
Option selling tests patience and discipline.
• Small daily profits feel easy
• One bad trade can wipe weeks of gains
• Overconfidence is dangerous
Successful option sellers:
✔ Follow system
✔ Accept small losses
✔ Think in probabilities
8. Conclusion
Option selling is one of the most powerful ways to generate consistent income in the stock market when done correctly. It suits traders who understand probability, volatility, and risk management.
For beginners, start with:
• Credit spreads
• Covered calls
• Iron Condors
Avoid naked selling until you gain experience.
Remember:
Option selling is not about predicting the market, but managing risk while letting time work for you.

BTC Weekly OB Bounce + Daily Displacement Long SetupBTC Weekly OB Respect + Daily Displacement Setup
BTC perfectly respecting Weekly Order Block (pink zone ~$62-63K) creates bullish HTF bias. Price bounced with higher lows, confirming institutional demand defense.
Trade Thesis
Weekly OB hold → Daily displacement above orange Daily OB (~$65-67K) → Upside structure break → Long bias activated.
Entry Criteria
• Daily close above Daily OB with displacement candle
• Volume spike confirmation
• Pullback to FVG/OB retest for entry
• Avoid if weekly support breaks

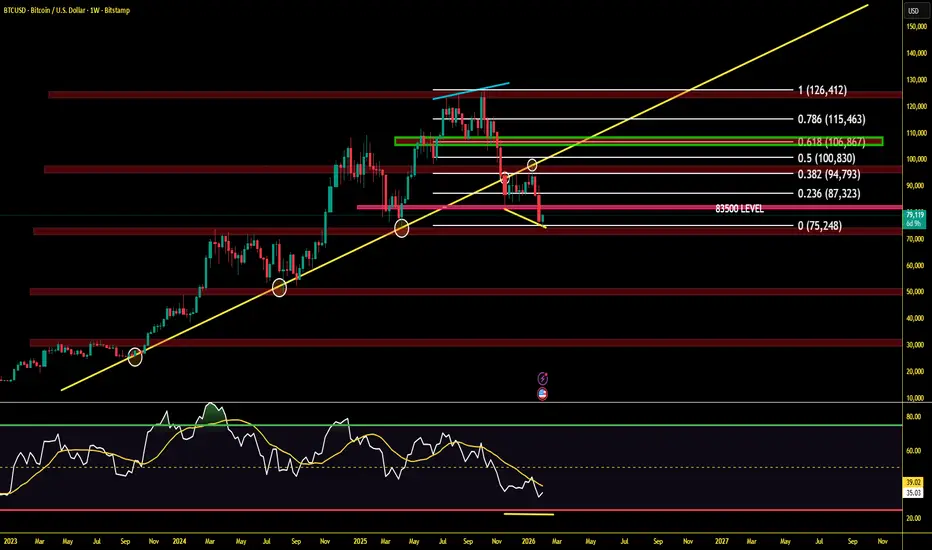
BTCUSD Weekly Close Decides the Next Major Move 83,500 Is strongBTCUSD is at a critical decision zone.
A weekly close above 83,500 can trigger a short-term relief rally towards the 0.618 Fibonacci retracement.
However, the 106,300 – 106,800 region remains a major supply and profit-booking zone.
Timeframe Context:
This analysis is based on the daily structure with weekly candle confirmation.
Key Observations:
• 83,500 is acting as a decisive support/resistance flip level
• A weekly close above 83,500 increases the probability of a move towards the 0.618 retracement zone
• The 106,300 – 106,800 area aligns with 0.618 Fibonacci + historical supply, making it a high-risk zone for fresh longs
Trading Insight:
Any upside from current levels should be treated as a relief rally, not a confirmed bullish continuation.
Strong rejection or bearish confirmation near the 0.618 zone can lead to a larger corrective move or crash.
Conclusion:
Trade the move, respect the levels, and wait for confirmation —
levels lead, price reacts.
Bitcoin: Post-Impulse Correction Near the Golden RatioRead time: ~3–4 minutes
The Bigger Picture
Bitcoin completed a clean, non-overlapping 5-wave impulse from the cycle lows, respecting a well-defined rising channel. This structure suggests the broader trend remains intact, but every impulse must correct — and that phase is now underway.
Transition from Impulse to Correction
Following the completion of the full 5-wave advance, price shifted into a corrective mode . The decline so far has been controlled and channel-bound , indicating a correction rather than a structural breakdown.
Importantly, price continues to trade inside the rising channel , keeping the higher-timeframe trend technically valid — for now.
Fibonacci Context: Where Things Get Interesting
The ongoing correction is now approaching the classic 0.5–0.618 Fibonacci retracement zone , a typical depth for a Wave (2) pullback after a strong impulse.
This area also overlaps with:
A former supply zone
A potential supply → demand transition area
Prior reaction zones within the channel
That confluence makes this a high-attention zone , not an automatic buy.
Reversal Zone: What Actually Matters
A meaningful reversal from this region requires confirmation , not assumptions.
Key characteristics to watch for:
RSI bullish divergence
Bullish engulfing candle
Hammer or long lower-wick rejection
No signals = no reversal. Price alone doesn’t qualify.
A Reality Check on Depth
While the 0.5–0.618 zone is typical, retracements can be deep .
If price fails to hold this region, the correction may extend into:
A deeper retracement toward 0.786 , or
A more complex corrective structure (WXY)
Until momentum confirms, this remains a watch zone , not a conviction zone.
Why Track Bitcoin Even If You Don’t Trade It?
Bitcoin acts as a global risk and liquidity barometer .
It often moves ahead of equities , reflecting shifts in risk appetite and capital flow before traditional markets react. Even for non-crypto participants, BTC offers valuable insight into broader market psychology.
Final Take
Structure remains corrective within a larger uptrend
Key support lies near the golden Fibonacci zone
Confirmation is mandatory before calling a bottom
A break below this zone would delay or invalidate the bullish continuation thesis
Disclaimer:
This analysis is for educational purposes only and does not constitute investment advice. Please do your own research (DYOR) before making any trading decisions.

Bitcoin Market Structure Shift: The "Kiss of Death" RetestThe current 1-hour chart for BTC/USD shows Bitcoin struggling to maintain upward momentum after a significant sell-off. Price action is currently respecting a descending trendline that has acted as a ceiling for several days.

BTC/USD: Rebound from 2026 Lows – Path to $100K Re-Accumulation?Based on the detailed technical analysis: Bitcoin is showing signs of life after a sharp weekend flush that saw prices hit a fresh 2026 low near $74,500. My current analysis highlights a potential structural shift as we defend critical support levels and look to reclaim mid-range liquidity.
The Technical Setup:
Support Defense: We have successfully held the $74,000 - $75,000 zone. This level has proven pivotal, acting as a base for the current relief rally.
Immediate Resistance: The first major hurdle is the $78,500 - $79,200 supply zone (gray box). A clean breakout and retest of this level as support is essential to confirm a shift in momentum.
Secondary Target: Once above $80k, I am eyeing a move toward the $90,000 psychological barrier. This was a heavy rejection point in January and will likely act as a major profit-taking zone.
The Strategy: I am anticipating a zig-zag recovery pattern. The goal is to see a series of higher highs and higher lows:
A push through $79k, followed by a shallow retracement to confirm the floor.
A secondary impulsive leg toward $90k.
Consolidation before a final push toward the $100,000 target by late Q1/early Q2.
Risk Management: While the "whale" accumulation at these discounts is encouraging, the overall trend remains heavy. A daily close below $74,000 would invalidate this bullish path and likely lead to a deeper correction toward the $72k liquidity pool.
Note: This is for educational purposes only. Market conditions are highly volatile; always manage your risk and stick to your plan.

BTC Bullish or Bearish Weekly Structure:
Price completed a sizable retracement from ATH — near the 0.5 FIB of the entire move. The 0.5–0.618 Fibonacci zone is historically strong. If it holds, bulls remain intact. A break below $75k weekly close signals deeper correction.
Short Timeframe (4H)
Sharp bearish candles showing momentum exhaustion only at support. Potential short retracement bounces near current lows (~72.5–75k). If 4H breaks structure lower, expect continuation.
Multi-Timeframe Bias Summary:
Long-Term (Monthly/Weekly): Neutral–Bullish Still above macro support.
Major trend intact until lows broken.
Mid-Term (Daily): Neutral–Bearish Price in corrective mode. Needs reclaim of $92k–98k for bullish reversal.
Short-Term (4H): Bearish Lower lows & lower highs. Reaction bounces likely, but structure remains downward.
Disclaimer: This analysis is for educational and informational purposes only. It does not constitute financial, investment, tax, or trading advice.

BITCOIN Intra trade planThis is the plan for btc, if we see any bullish price action then i will plan my trade.

Bitcoin 4H Chart Shows Exhaustion After Sharp Sell-Off Bitcoin has experienced a strong impulsive decline, breaking multiple short-term supports and accelerating downside momentum. After this sharp sell-off, price is now attempting a reaction from lower levels, suggesting temporary exhaustion from sellers.
🔍 What the Chart Is Showing
➤ Clear impulsive bearish leg with minimal pullbacks
➤ Price stretched far below short-term moving averages
➤ Current move appears to be a technical reaction, not a trend reversal
➤ MA 200 remains far above price, keeping higher-timeframe bias bearish
📉 Price Action Insight
➤ Strong sell-offs are often followed by volatile corrective moves
➤ Current bounce may act as a liquidity grab or trap for late buyers
➤ Any upward move into previous breakdown zones can attract fresh selling interest
➤ Directional confirmation is required before assuming trend change
🎯 Key Scenarios to Watch
➤ Corrective pullback → continuation lower
➤ Sideways consolidation → volatility expansion
➤ Only sustained acceptance above major resistance can change structure
⚠️ Execution & Risk Notes
➤ Avoid emotional trades after aggressive candles
➤ Let price show intention, don’t anticipate
➤ Respect volatility and keep risk small
📌 No indicators magic — only price behavior and structure.
📚 Trading is a game of probabilities, not predictions.
Disclaimer:
This analysis is shared strictly for educational and informational purposes. It does not represent financial advice or a recommendation to buy or sell any asset. Cryptocurrency markets are highly volatile. Always do your own research and manage risk responsibly. The author is not liable for any trading losses.
