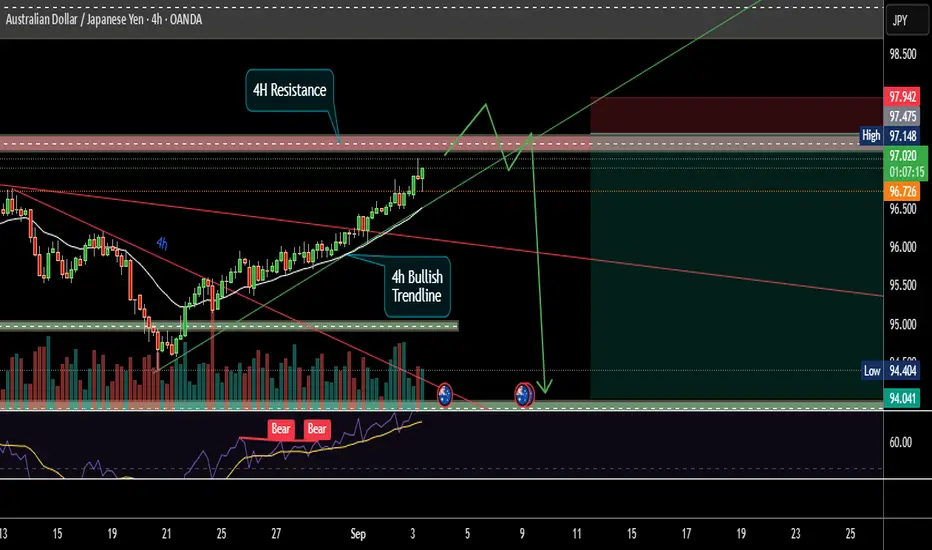
AUD/JPY 4H chartAUD/JPY 4H chart:
The price was in an upward channel, then broke down sharply below both the Ichimoku cloud and the support trendline.
There’s a clearly marked resistance zone around 100.2–100.6, which the price rejected strongly.
The chart shows a target line drawn downward from the breakout are
About Australian Dollar / Japanese Yen
This pair is the Australian Dollar against the Japanese Yen. In regards to U.S. equities on a short to medium term basis, it is often one of the most highly correlated pairs to price action. The pair tends to decline is a risk off approach and rise in a low risk environment on carry flows.
Related currencies

AUDJPY – High-Probability Sell Zone IdentifiedAUDJPY – High-Probability Sell Zone Identified
After a strong bullish correction, price has entered a major resistance zone where previous supply caused a strong sell-off. Market structure shows signs of exhaustion — ideal for a short setup.
📉 Trade Setup Details:
Pair: AUDJPY
Timeframe: 3H
Dir

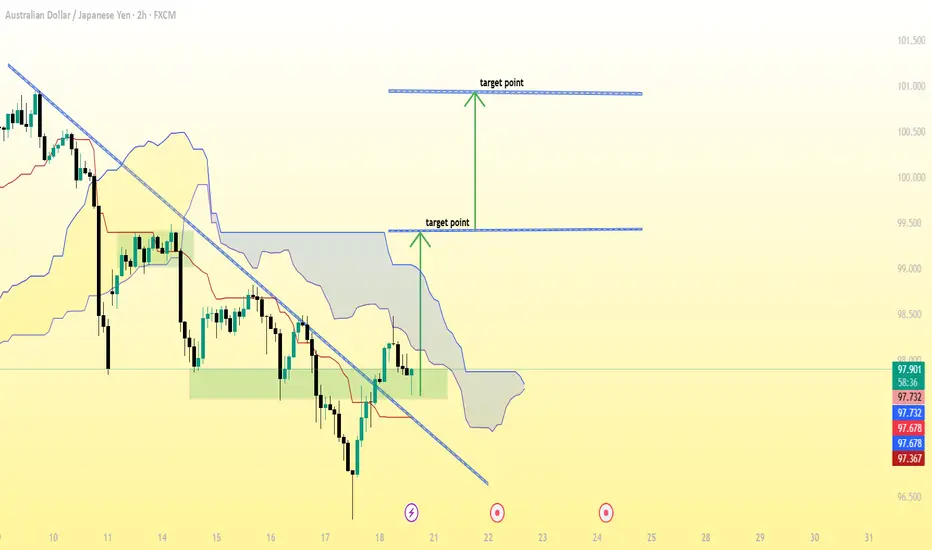
AUD/JPY (2-hour timeframe), here’s a breakdown of what’s visibleAUD/JPY (2-hour timeframe), here’s a breakdown of what’s visible:
The downtrend line has been broken to the upside, suggesting a potential bullish reversal.
The Ichimoku Cloud shows price moving above or attempting to move above the cloud — another bullish signal.
Two target points are already ma
AUDJPY Sell SetupPrice is retesting the supply zone between 98.20 – 98.45 after a strong bearish fall.
Expecting rejection to push price back toward 96.30 – 96.20 zone.
🎯 Entry: 98.20 – 98.40
🛑 SL: 98.50
✅ TP: 96.30
⚖️ High RR setup | Follow the structure | Patience = Profit

AUDJPY – SELL SETUP (2H TIMEFRAME)AUDJPY – SELL SETUP (2H TIMEFRAME)
📉 Bias: Bearish Rejection Zone Formed
Price made a strong downside move after a sharp drop and is now pulling back into a major supply zone (100.370 – 100.992).
This area aligns with previous structure highs and imbalance, making it a high-probability reversal zo

SELL ENTRY - AUDJPY🔻 SELL ENTRY - AUDJPY 🔻
Price has tapped into a premium supply zone on the 15-min timeframe after a strong bullish push.
Now expecting rejection and possible continuation to the downside.
📊 Timeframe: 15 Min
📈 Setup Type: Supply Zone / Lower High Formation
🎯 Direction: SELL
⚙️ Confirmation: Beari

AUDJPY – Bearish Supply Zone Setup (H1 Chart)📊 AUDJPY – Bearish Supply Zone Setup (H1 Chart)
Pair: AUDJPY
Timeframe: 1H
Setup Type: Supply Zone (Rally-Base-Drop)
🔎 Market Context:
AUDJPY has been showing bearish momentum after rejecting higher levels.
Price is currently consolidating and attempting a retest of a strong supply zone (97.794

AUDJPY MULTI TIME FRAME ANALYSISHello traders , here is the full multi time frame analysis for this pair, let me know in the comment section below if you have any questions , the entry will be taken only if all rules of the strategies will be satisfied. wait for more price action to develop before taking any position. I suggest yo

A beautiful AUDCHF high RnR scenarioAUDCHF is approaching 4H resistance zone which has already show rejection previously. There is also a steep bullish trend line creating a confluence. RSI has already shown Bearish Divergence. All these signaling a coming very good sell side opportunity. Below are points detailing the same.
1. Price
AUDJPY SHORTSAUDJPY – Short Setup Idea
Bulls are clearly showing weakness — just look at the 4H chart on the right. The climb has been slow and corrective, suggesting a lack of strong momentum to the upside.
Price has recently reached into a 4H supply zone. At first glance, it looked as though the zone was inv

See all ideas
Summarizing what the indicators are suggesting.
Oscillators
Neutral
SellBuy
Strong sellStrong buy
Strong sellSellNeutralBuyStrong buy
Oscillators
Neutral
SellBuy
Strong sellStrong buy
Strong sellSellNeutralBuyStrong buy
Summary
Neutral
SellBuy
Strong sellStrong buy
Strong sellSellNeutralBuyStrong buy
Summary
Neutral
SellBuy
Strong sellStrong buy
Strong sellSellNeutralBuyStrong buy
Summary
Neutral
SellBuy
Strong sellStrong buy
Strong sellSellNeutralBuyStrong buy
Moving Averages
Neutral
SellBuy
Strong sellStrong buy
Strong sellSellNeutralBuyStrong buy
Moving Averages
Neutral
SellBuy
Strong sellStrong buy
Strong sellSellNeutralBuyStrong buy
Displays a symbol's price movements over previous years to identify recurring trends.
Frequently Asked Questions
The current rate of AUDJPY is 102.411 JPY — it has decreased by −0.02% in the past 24 hours. See more of AUDJPY rate dynamics on the detailed chart.
The value of the AUDJPY pair is quoted as 1 AUD per x JPY. For example, if the pair is trading at 1.50, it means it takes 1.5 JPY to buy 1 AUD.
The term volatility describes the risk related to the changes in an asset's value. AUDJPY has the volatility rating of 0.29%. Track all currencies' changes with our live Forex Heatmap and prepare for markets volatility.
The AUDJPY showed a 0.39% rise over the past week, the month change is a 2.79% rise, and over the last year it has increased by 5.74%. Track live rate changes on the AUDJPY chart.
Learn how you can make money on rate changes in numerous trading ideas created by our community.
Learn how you can make money on rate changes in numerous trading ideas created by our community.
AUDJPY is a minor currency pair, i.e. a popular pair that is not associated with USD. Such pairs are also called cross currency pairs.
Currencies are usually traded through forex brokers — choose the one that suits your needs and go ahead. You can trade AUDJPY right from TradingView charts — just log in to you broker account. Check out the list of our integrated brokers and find the best one for your needs and strategy.
When deciding to buy or sell currency one should keep in mind many factors including current geopolitical situation, interest rates, and other. But before plunging into a deep research, you can start with AUDJPY technical analysis. The technical rating for the pair is buy today, but don't forget that markets can be very unstable, so don't stop here. According to our 1 week rating the AUDJPY shows the buy signal, and 1 month rating is buy. See more of AUDJPY technicals for a more comprehensive analysis.