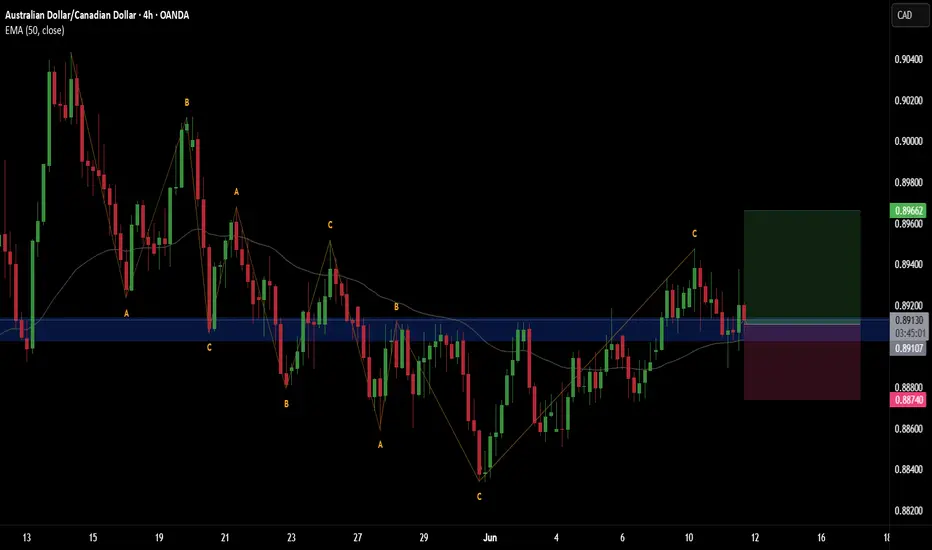
Expecting audcad sell delivery for buy setupsBetween these two red lines inside weekly+daily imb, the set-up could be find for buys
Why? Price already taken the liquidity above and it possible scenario
shows the probability
of retracement ( where structure shift indicates sellside delivery,
however buys will be
more safer approach fundamentally
and technically both .
Fundamental reason : aud have strong
intrest rate i.e (3.6%)
whereas CAD indicates 2.25%
And Technically it's bullish orderflow .🤝
CANADIAN DOLLAR / AUSTRALIAN DOLLAR
No trades
What traders are saying

AUDCAD 4HR T/F ANALYSIS----
audcad 4hr t/f analysis---- red highlighted portion is a arc so it`s dual direction if breakout above breakout line then we can sure previous whole demand can repeat , trend are bullish so we can go with trend | if we want enter in trend then wait for after breakout and retesting then we can plane a trade on retesting point let`s see----

Aud Cad Short-Term Downtrend: The short-term trend has been identified as being "DOWN" since December 10, 2025, indicating that minor, temporary corrections might occur within the larger bullish trend.
Resistance Zones: The price is testing strong resistance or supply zones around the 0.9140–0.9150 area, where sellers have previously stepped in, which could lead to a short-term drop.

AUD/CAD Bullish in Daily time frameTechnically : AUD/CAD is technically ready for bullish move. As the wave 1( impulse) followed by wave 2 (Correction), Wave 3 (impulse), followed by wave 4(Correction). Wave 5 Start will be determined by Fundamental connection.
Fundamental Data : CAD CPI will be published tomorrow. Based on the release of this Fundamental data, AUD/CAD bullish move will be determined.


AUDCAD_Short Elliot Wave I anticipate AUDCAD to form an ABC pattern targeting 0.9060, with a strict stop-loss at 0.9216. The risk-to-reward ratio is 1:4. Please conduct your own research before executing any trade.

AUDCAD Short_Elliot Wave I anticipate a bearish trend in AUDCAD, potentially completing a five-wave downward movement. The trade setup offers a risk-to-reward ratio of 1:3. Please conduct your own research before making any investment decisions."

AUD/CAD Approaching Support: Strong Bounce IncomingAUD/CAD has finished a strong 5-wave move to the upside, completing Wave (1)/(A). Since then, price has been moving in a corrective channel and is now forming an A-B-C decline toward the lower support zone. The current structure suggests one more push down to complete Wave C of (2)/(B), where buyers are likely to step back in. Once that final dip finishes, the chart expects a powerful Wave (3)/(C) rally to the upside, targeting new highs. In simple terms: small drop left → correction ends → strong bullish continuation ahead.
Stay tuned!
@Money_Dictators
Thank you :)

Buy Trade - AUD/CADGreetings to everyone!
You can place a buy trade on AUD/CAD and check out my chart for the ideal entry, stop-loss & target placement.
Remember :-
* Move your SL to breakeven once the trade reaches 1:1 R.
* Aim for a minimum reward of 1:1.5 R.
* Don't risk more than 3% of your total margin.
Let's execute this trade smartly! 🚀
💬 About Me:
I am a professional trader with over four years of experience in the markets. I focus on swing trading using the 4H timeframe, mainly in the forex space. The trades I share here are the actual positions I’m executing. I post them as a small gesture to give back to the trading community that’s been a big part of my journey.
Cheers! 🙏

AUDCAD Short Setup – Precision Entry ZoneAUDCAD Short Setup – Precision Entry Zone
Price made a clear retest at resistance after a sharp drop. The structure shows lower highs formation indicating bearish momentum continuation.
📉 Trade Idea:
Pair: AUDCAD
Timeframe: 15 Min
Direction: Sell
Entry: 0.91181
Stoploss: 0.91248
Target: 0.90979
💡 Reasoning:
Price broke strong support and flipped it into new resistance.
Weak pullback candles near resistance confirm rejection.
Perfect zone for continuation sell setup.
⚙️ Risk-Reward: 1:3 (High Probability Trade Setup)
📍 Strategy: Retest + Structure Confirmation
🔥 Discipline: Follow plan — Entry, SL, and Target strictly.

AUDCAD Sell Setup📉 AUDCAD Sell Setup
Price is retesting a strong supply zone after multiple rejections.
Waiting for confirmation around 0.9140–0.9150 area to continue the bearish momentum.
🧠 Smart entry | 🎯 High RR setup | ⏳ Patience before the drop

SELL ENTRY - AUDCAD🔻 SELL ENTRY - AUDCAD 🔻
Price reached a premium supply zone after a strong impulsive drop.
Now retesting the zone for potential continuation to the downside.
📊 Timeframe: 15 Min
📈 Setup Type: Supply Zone / Break of Structure
🎯 Direction: SELL
💰 Risk-to-Reward: High Probability Setup
⚙️ Confirmation: Bearish rejection from supply
💬 "Trade smart. Risk small. Let the market do the work."

AUDCAD – Supply Zone Trade Setup (H1 Chart)📊 AUDCAD – Supply Zone Trade Setup (H1 Chart)
Pair: AUDCAD
Timeframe: 1H
Setup: Rally-Base-Drop (Supply Zone)
🔹 Price is approaching a strong supply zone around 0.92500 – 0.92650.
🔹 Expecting sellers to step in once liquidity is collected near this zone.
🔹 Planned short entry around the zone, with stop-loss above the supply area.
🔹 Target aligned with previous demand area at 0.90900 – 0.91000.
⚖️ Risk to Reward (RR): ~1:3
📅 Setup valid for the upcoming week (Oct 6–10).

AUDCAD besrish ( Sell )📌 Trade Plan (AUDCAD)
Sell Limit (Entry Zone):
0.91514
0.91493
Stop Loss (SL): Just above the marked “Caution” zone (around 0.91680–0.91700 area).
Take Profit (TP):
TP Liquidity: 0.90767
---
📌 Why Sell?
Price retesting supply zone (Caution area).
Wyckoff distribution + UTAD test confluence.
Sell limit aligned with imbalance/fair value gap.
Liquidity resting below recent lows (target 0.90767).
📌 News Support
CAD strength outlook from recent economic data.
AUD pressured by weaker commodity demand.
High-impact news could trigger liquidity run to downside.

AUDCAD MULTI TIME FRAME ANALYSISHello traders , here is the full multi time frame analysis for this pair, let me know in the comment section below if you have any questions , the entry will be taken only if all rules of the strategies will be satisfied. wait for more price action to develop before taking any position. I suggest you keep this pair on your watchlist and see if the rules of your strategy are satisfied.
🧠💡 Share your unique analysis, thoughts, and ideas in the comments section below. I'm excited to hear your perspective on this pair .
💭🔍 Don't hesitate to comment if you have any questions or queries regarding this analysis.


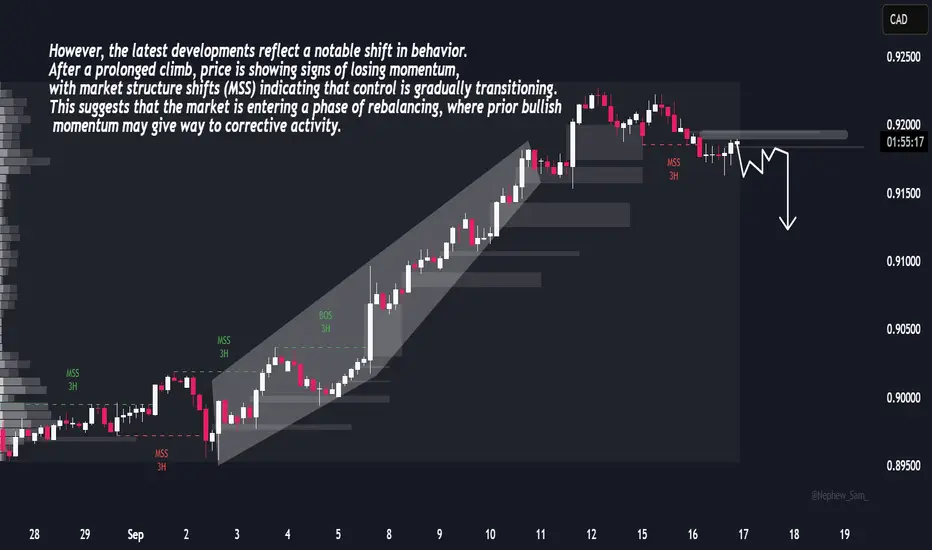
AUDCAD Price Forecast – Structural Shift in MomentumAUD/CAD has recently completed a strong trending phase, characterized by a well-defined upward channel with consistent expansions. The sequence of price action showed clear momentum as each retracement was absorbed and followed by renewed buying interest, maintaining structural order throughout the move.
However, the latest developments reflect a notable shift in behavior. After a prolonged climb, price is showing signs of losing momentum, with market structure shifts (MSS) indicating that control is gradually transitioning. This suggests that the market is entering a phase of rebalancing, where prior bullish momentum may give way to corrective activity.
The projection implies that the pair could be preparing for a deeper adjustment, where short-term liquidity cycles reset positioning before a more sustainable trend emerges. This type of rotation is natural after extended directional moves and often signals the beginning of a new phase rather than immediate continuation.
Overall, AUD/CAD is transitioning from strength into a corrective cycle. While the broader market has proven its ability to trend effectively, near-term behavior suggests that the focus will be on how efficiently the market absorbs this correction before defining the next directional phase.
Bearish Signal at BreakoutThe AUDCAD is on strong Buy side since the start of this month. Enough to be in overbought area.
The Channel / Rising wedge is confirming its strong buy on H1 timeframe.
Now we are waiting for the breakout of this Rising Wedge. Yet we will not trade unless it doesn't break its Lower High at 0.9140 which will be the start of our Bearish Trend on H1 time frame. the first target is 0.9080 and 2nd Target is at 0.9026 .
I already placed two trades, 1 aiming for target 1 and 2nd aiming for target two. Remember, not to forget to move the SL to Break even after target 1 hits.
what about H4 time frame?
Well, the above analysis on H1 timeframe may pave the way to break the 0.9102 level which comes in between our Entry and Target 1. If it breaks then we must be sure for our target 2 while trading with 0 risk after moving down our SL to Break even if target 1 hits.

AUDCAD POTENTIAL SHORTLooking at AUDCAD on the 4h timeframe,currently looking to take shorting positions upon the retest of the recently formed daily supply zone which also confluences withe retest of the level in which the market broke out of and the inner 4h and 1h supply zones.

Bullish BiasMain hurdle for the price action is 0.90000, but as per the current market conditions, we can look for long because even on 15m timeframe we got a nice Descending TL breakout which invalidated the downtrend for a while.

AUDCAD BULLISH BIASClearly 15m shows good sign of strength with supporting ascending TL. We can look for long at the current price value.

Buy Trade - AUD/CADGreetings to everyone!
You can place a buy trade on AUD/CAD and check out my chart for the ideal entry, stop-loss & target placement.
Remember :-
* Move your SL to breakeven once the trade reaches 1:1 R.
* Aim for a minimum reward of 1:1.5 R.
* Don't risk more than 3% of your total margin.
Let's execute this trade smartly! 🚀
💬 About Me:
I am a professional trader with over four years of experience in the markets. I focus on swing trading using the 4H timeframe, mainly in the forex space. The trades I share here are the actual positions I’m executing. I post them as a small gesture to give back to the trading community that’s been a big part of my journey.
Cheers! 🙏
Sell Trade - AUD/CADGreetings to everyone!
You can place a sell trade on AUD/CAD and check out my chart for the ideal entry, stop-loss & target placement.
Remember :-
* Move your SL to breakeven once the trade reaches 1:1 R.
* Aim for a minimum reward of 1:1.5 R.
* Don't risk more than 3% of your total margin.
Let's execute this trade smartly! 🚀
💬 About Me:
I am a professional trader with over four years of experience in the markets. I focus on swing trading using the 4H timeframe, mainly in the forex space. The trades I share here are the actual positions I’m executing. I post them as a small gesture to give back to the trading community that’s been a big part of my journey.
Cheers! 🙏
